| A | B | C | D | E | F | G | H | I | J | |
|---|---|---|---|---|---|---|---|---|---|---|
1 | ||||||||||
2 | COVID-19 Aerosol Transmission Estimator | File --> Make a Copy OR Download to Excel (Click GREEN links below if don't see option) | ||||||||
3 | Developed by: | Shortcut: | ||||||||
4 | Direct copy in Google Drive (as Google Sheet) | |||||||||
5 | For more info: | Other languages: https://tinyurl.com/preguntas-espanol | ||||||||
6 | Model described in Peng et al. (2022). Includes peer-reviewed research in Miller et al. (2021) and Peng & Jimenez (2021) | Come back for new versions | ||||||||
7 | 5 min. read on aerosol evidence: | |||||||||
8 | Recorded webinar on this tool: | 2. Q&A session | ||||||||
9 | Informacion en espanol / castellano: | 2. Entrevista PF | 3. Entrevista HA | |||||||
10 | El Pais Simulation based on this: | English Version | ||||||||
11 | Subscribing to email list for tool: | |||||||||
12 | Feedback to improve this tool: | http://tinyurl.com/estimator-feedback | ||||||||
13 | Using extensive input and feedback from many people (But any mistakes are my own): | Linsey Marr, Shelly Miller, Giorgio Buonnano, Lidia Morawska, Don Milton, Julian Tang, Jarek Kurnitski, Xavier Querol, Matthew McQueen, Charles Stanier, Joel Eaves, Alfred Trukenmueller, Ty Newell, Greg Blonder, Andrew Maynard, Nathan Skinner, Clark Vangilder, Roger Olsen, Alex Mikszewski, Prasad Kasibhatla, Joe Bruce, Paul Dabisch, Yumi Roth, Andrew Persily, Susan Masten, Sebastien Tixier, Amber Kraver, Howard Chong, John Fay, Dustin Poppendieck, Jim Bagrowski, Gary Chaulklin, Richard Meehan, Jarrell Wenger, Alex Huffman, Bertrand Waucquez, Elizabeth Goldberg, Trish Greenhalgh, Lydia Bourouiba (only listing the most important here, many others have contributed feedback as well over email and Twitter. Thanks a lot to everyone!) | ||||||||
14 | Version & date | 3.6.8 | 21-Mar-22 | |||||||
15 | ||||||||||
16 | What we are trying to estimate | |||||||||
17 | The propagation of COVID-19 by aerosol transmission ONLY | |||||||||
18 | The model is based on a standard model of aerosol disease transmission, the Wells-Riley model. It is calibrated to COVID-19 per recent literature on quanta emission rate | |||||||||
19 | This is NOT an epidemiological model, rather can take input from such models for the average rate of infection for a given location and time period. Or it could possibly be used as a sub-component of an epi-model, to estimate aerosol transmission as a function of various parameters | |||||||||
20 | This model does NOT include droplet or contact / fomite transmission, and assumes that 6 ft / 2 m social distancing is respected. Otherwise higher transmission will result | |||||||||
21 | This model does NOT include transmission to the people present, when they are in locations other than the one analyzed here | |||||||||
22 | The model can easily be adapted to other situations, such as offices, shops etc. | |||||||||
23 | ||||||||||
24 | Simplicity and uncertainties - IMPORTANT, PLEASE READ | |||||||||
25 | The model is kept simple so that it can be understood and changed easily. The goal is to get the order-of-magnitude of the effects quickly, and to explore the trends. | |||||||||
26 | Several parameters are uncertain, and have been estimated based on current knowledge. Alternative estimates can be entered to explore their effect in the results. | |||||||||
27 | The model is consistent with known superspreading events of COVID-19. It represents the situation in which someone highly infectious is present in the space. Note that many people are much less infectious (e.g. Ma et al., 2020, Clinical Infectious Diseases, https://doi.org/10.1093/cid/ciaa1283), and for those the number of infected people will be too high. | |||||||||
28 | More complex and realistic models can be built, however the parametric uncertainty may still dominate the total uncertainty | |||||||||
29 | Parameters based on new research can be incorporated as they become available. Pls send them my way | |||||||||
30 | Disclaimer: this model is our best scientific estimate, based on the information currently available. It is provided in the hope that it will be useful to others, based on us | |||||||||
31 | receiving a large number of requests for this type of information. We trust most the relative risk estimates (when changing parameters such as wearing a | |||||||||
32 | mask or not) of two runs of the model. We also trust the order-of-magnitude of the risk estimates, if the inputs are correct. The exact numerical results | |||||||||
33 | for a given case have more uncertainty. For example if you obtain a 1% chance of infection, in reality it could be 0.2% or 5%. But it won't be 0.001% or 100%. | |||||||||
34 | Results also have to be interpreted statistically, i.e. the result is the average number of transmission cases, across many realizations of a given event. I.e. if | |||||||||
35 | 1000 similar events were conducted, this would be the average probability. Any one event may have much fewer or many more transmission cases. | |||||||||
36 | ||||||||||
37 | How to use the estimator | |||||||||
38 | This online version will be kept up-to-date. We can't allow people to make changes to the online version, as otherwise people would overwrite each other's changes | |||||||||
39 | People interested in using the model should download an Excel version from File --> Download or make a G Sheets copy with File --> Make a copy | |||||||||
40 | Or you can download an Excel version with the direct link above | |||||||||
41 | The online model will continue to be updated, so you may want to re-download the file later on, if you continue to use it, to get the latest updates | |||||||||
42 | See the version log at the bottom of this sheet for a brief description of the updates | |||||||||
43 | ||||||||||
44 | Inputs and Outputs | |||||||||
45 | Most important inputs are colored in orange | |||||||||
46 | Inputs are colored in yellow. | These are the cells you should change to explore different cases. | ||||||||
47 | Descriptions and intermediate calculations are not colored. Do not overwrite the calculations or you will break the estimator. | |||||||||
48 | Outputs are colored in blue. | These are the final results of the model for each case. Do not overwrite them or you will break the estimator. | ||||||||
49 | ||||||||||
50 | Note that in some cases, the case in a sheet assumes that an infected person is present (e.g. in the classroom). While in other cases we use the prevalence of the disease in the population as | |||||||||
51 | an input on the calculations. They can be converted easily, but pay attention to what each specific sheet is doing. | |||||||||
52 | ||||||||||
53 | All sheets are self-contained, except for the University case | |||||||||
54 | ||||||||||
55 | For the University case | |||||||||
56 | Approximately scaled for a large University in the Western US for the Fall 2020 semester | |||||||||
57 | First, results are calculated for a typical classroom ("Classroom Sheet"), assuming either one student or the professor are infected | |||||||||
58 | Assumes enhanced social distancing and masks in place | |||||||||
59 | Classroom size does not matter much, since students will scale with it | |||||||||
60 | Then, results are scaled to the whole campus ("Campus Sheet"), taking into account the probability of infection in the population | |||||||||
61 | ||||||||||
62 | Suggestions and improvements | |||||||||
63 | Please email me for any suggestions for improvements, additional input data etc. | jose.jimenez@colorado.edu | ||||||||
64 | ||||||||||
65 | Scientific Approach | |||||||||
66 | The model combines two submodels: (1) a standard atmospheric "box model", which assumes that the emissions are completely mixed across a control volume quickly (such as an indoor room or other space). See for example Chapter 3 of the Jacob Atmos. Chem. textbook, and Chapter 21 of the Cooper and Alley Air Pollution Control Engineering Textbook for indoor applications. This is an approximation that allows easy calculation, is approximately correct as long as near-field effects are avoided by social distancing, and is commonly used in air quality modeling. (2) a standard aerosol infection model (Wells-Riley model), as formulated in Miller et al. 2020, and references therein | |||||||||
67 | Miller et al. Skagit Choir Outbreak | |||||||||
68 | Original Wells-Riley model: | |||||||||
69 | Buonnano et al. (2020a) | |||||||||
70 | Buonnano et al. (2020b) | |||||||||
71 | ||||||||||
72 | Key parameters, sources, and uncertainties | |||||||||
73 | ||||||||||
74 | ||||||||||
75 | See FAQ sheet for the definition of quanta | |||||||||
76 | 970 q / h | This is from the Miller et al. choir superspreading case | ||||||||
77 | This value is at the high end of the Buonnano et al. values provided below, consistent with this being a superspreading event | |||||||||
78 | which was likely influenced by a very high emission rate of quanta from the specific index case | |||||||||
79 | We do not think that this very high value should be applied to all situations, as that would overestimate the infection risk. | |||||||||
80 | ||||||||||
81 | For comparison, values for measles can be over 5500 q h-1 (Riley et al. above). So COVID-19 is much less transmissible through the air than measles, but it | |||||||||
82 | can still be transmitted through aerosols under the right circumstances (indoors, lower ventilation, crowding, longer duration, activities that favor | |||||||||
83 | higher emission rates of respiratory aerosols such as singing, talking, aerobic exercise etc.) If you are curious, change the quantum emission rate | |||||||||
84 | to 5500 to see what measles would do, if it encountered a susceptible population with its high infectivity. | |||||||||
85 | ||||||||||
86 | Relative Quanta Exhalation Rates | |||||||||
87 | Calculated according to Peng et al. (2022) for the estimation of infection risk parameters | |||||||||
88 | Basic quanta exhalation rate | 18.6 | infectious doses (quanta) h-1 | Quanta exhalation rate for "Resting - Oral breathing". | ||||||
89 | This is for the original Wuhan variant | |||||||||
90 | Note that Buonanno et al. estimated a lower value of 2 q h-1. The uncertainty bands of both values overlap. See Peng et al. (2022) for further details | |||||||||
91 | ||||||||||
92 | The relative quanta emission rates are based on Buonnano et al. (2020a, b), and personal comm. from the author: | Paper 1 | Paper 2 | |||||||
93 | ||||||||||
94 | IMPORTANT: The uncertainty of these values is high, probably at factor of 5 or 10. We just don't know enough about this disease yet. Also there are likely superspreaders which are less frequent but may have higher emissions (as in the choir case). Thus don't take abs. probabilities of infection at face value, just look at the order-of-magnitude (i.e. it is of the order of 0.001% or 0.01% or 0.1% or 1% or 10% or approaching 100%?. It is the relative effect of control measures, disease prevalence etc. that is most useful from this estimator, given the current state of knowledge. | |||||||||
95 | ||||||||||
96 | For a more general set of activities, provided by the same author, based on their 2nd paper: | |||||||||
97 | [Note that these values are for the original Wuhan variant -- there is a modifier, described below, for other variants] | |||||||||
98 | Resting – Oral breathing = | 1 | All are dimensionless | |||||||
99 | Resting – Speaking = | 4.7 | ||||||||
100 | Resting – Loudly speaking = | 30.3 | ||||||||
101 | Standing – Oral breathing = | 1.2 | ||||||||
102 | Standing – Speaking = | 5.7 | ||||||||
103 | Standing – Loudly speaking = | 32.6 | ||||||||
104 | Light exercise – Oral breathing = | 2.8 | ||||||||
105 | Light exercise – Speaking = | 13.2 | ||||||||
106 | Light exercise – Loudly speaking = | 85 | ||||||||
107 | Heavy exercise – Oral breathing = | 6.8 | ||||||||
108 | Heavy exercise – Speaking = | 31.6 | ||||||||
109 | Heavy exercise – Loudly speaking = | 204 | ||||||||
110 | For a professor delivering a lecture: 2.2, 10.5, and 67 for oral breathing, speaking and aloud speaking (or singing) | |||||||||
111 | For a student sitting on a lecture: 2, 8, 48.5 for oral breathing, speaking and aloud speaking (or singing) | |||||||||
112 | To our knowledge the measurements of exhaled particle sizes and concentrations have not been reported for children as of this writing (L. Morawska, pers. comm.). Therefore we recommend scaling the adult measurements by body weight. | |||||||||
113 | ||||||||||
114 | Effect of Variants of Concern | |||||||||
115 | Some variants of concern such as the UK variant appear to be more transmissible than the original virus. | |||||||||
116 | Higher transmissibility appears to be due to higher viral load (and thus higher viral emission) and possibly reduced "infective dose" if the virus variant binds better to the ACE2 human receptors. In either case, this translates in an increase in the quanta emission rate for a given situation. A parameter in the spreadsheet allows entering the increase in transmissibility relative to the original virus. | |||||||||
117 | It is also possible that the increased transmissibility could be partially due to other effects, such as a longer infective period. In that case the quanta emission rate for a given situation would not change. As of May 2021 this possibility is considered less important. | |||||||||
118 | Values of increased transmissibility for variants of concern are not very well known. | |||||||||
119 | We recommend using values from the CDC variant surveillance page | |||||||||
120 | As of 2-May-2021, the values are 1.5 for the UK and South African variants, and 1.2 for the California variants | |||||||||
121 | As of July 2021, we recommend a factor of 2 for the Delta variant | |||||||||
122 | As of Nov-2021, we have made the Delta variant default in all the new format spreadsheets, since it seems to dominate almost everywhere | |||||||||
123 | As of 6-Jan-2022, we recommend a factor of 2.5 for the Omicron variant | |||||||||
124 | This is still uncertain and subject to update | |||||||||
125 | ||||||||||
126 | As of 6-Jan-2022, we have made the Omicron variant default in the new format spreadsheets, since it is dominating (or will soon) everywhere | |||||||||
127 | As of 21-Mar-2022, we recommend a factor of 3.3 for the Omicron BA.2 variant (vs. 2.5 for BA.1) | |||||||||
128 | ||||||||||
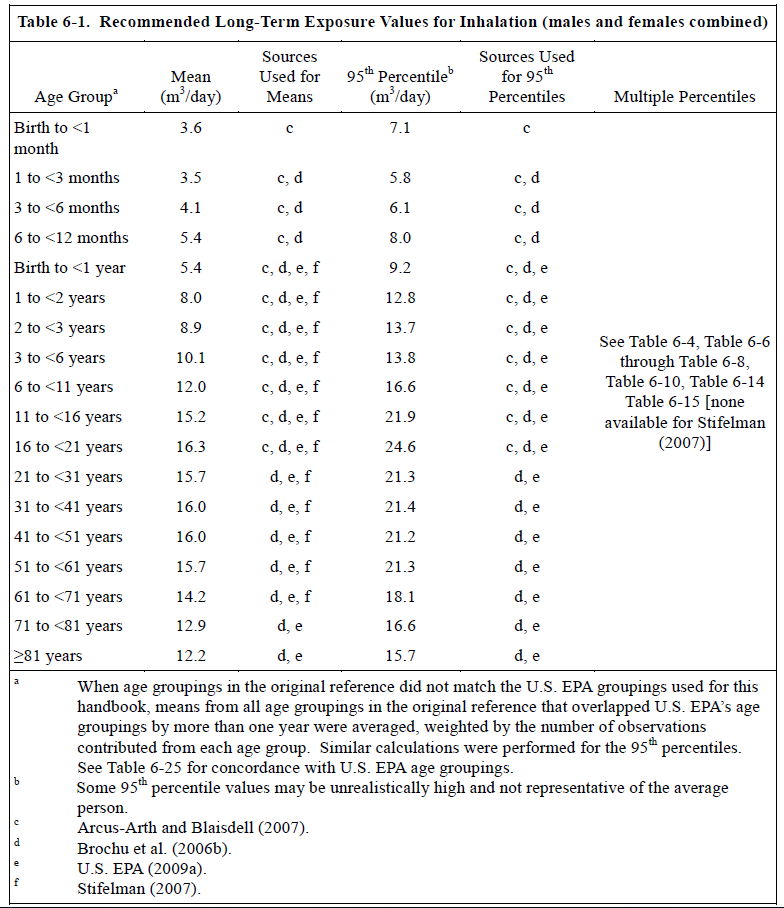
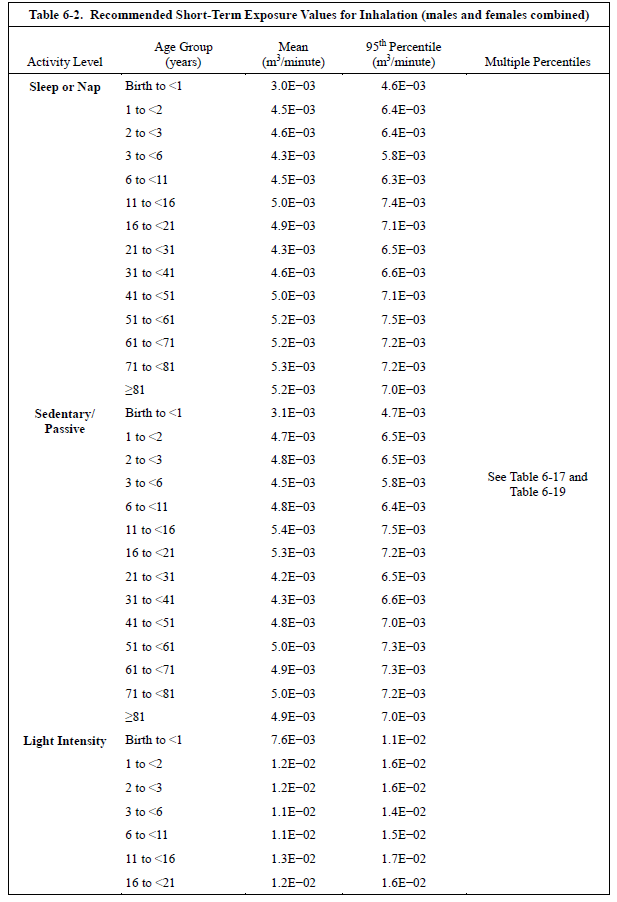
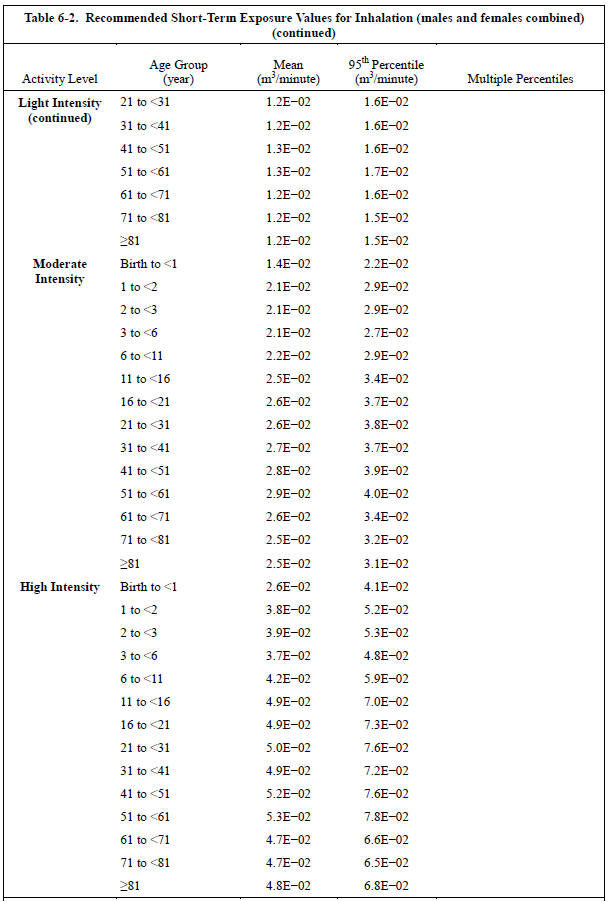
129 | In the current formulation of the estimator, these matter for the susceptible person. For the infected person, they are part of what causes the quanta emission rate to increase with activity. But e.g. talking increases quanta emission far more than what the breathing rate increases, because the emission of respiratory particles increases much more than breathing. | |||||||||
130 | Recommended values from US EPA Exposure Factors Handbook (Chapter 6), depend on age and activity level | |||||||||
131 | Table 6-1 for a daily average (includes sleeping though!), but use Tables below for a more accurate estimate | |||||||||
132 | ||||||||||
133 | ||||||||||
134 | ||||||||||
135 | ||||||||||
136 | ||||||||||
137 | ||||||||||
138 | ||||||||||
139 | ||||||||||
140 | ||||||||||
141 | ||||||||||
142 | ||||||||||
143 | ||||||||||
144 | ||||||||||
145 | ||||||||||
146 | ||||||||||
147 | ||||||||||
148 | ||||||||||
149 | ||||||||||
150 | ||||||||||
151 | ||||||||||
152 | ||||||||||
153 | ||||||||||
154 | ||||||||||
155 | ||||||||||
156 | ||||||||||
157 | ||||||||||
158 | ||||||||||
159 | ||||||||||
160 | ||||||||||
161 | ||||||||||
162 | ||||||||||
163 | ||||||||||
164 | ||||||||||
165 | ||||||||||
166 | ||||||||||
167 | ||||||||||
168 | ||||||||||
169 | ||||||||||
170 | ||||||||||
171 | ||||||||||
172 | ||||||||||
173 | ||||||||||
174 | ||||||||||
175 | ||||||||||
176 | ||||||||||
177 | ||||||||||
178 | ||||||||||
179 | ||||||||||
180 | ||||||||||
181 | ||||||||||
182 | ||||||||||
183 | ||||||||||
184 | ||||||||||
185 | ||||||||||
186 | ||||||||||
187 | ||||||||||
188 | ||||||||||
189 | ||||||||||
190 | ||||||||||
191 | ||||||||||
192 | ||||||||||
193 | ||||||||||
194 | ||||||||||
195 | ||||||||||
196 | ||||||||||
197 | ||||||||||
198 | Relative Quanta Breathing Rate | |||||||||
199 | Calculated according to Peng et al. (2022) for the estimation of infection risk parameters | |||||||||
200 | Basic breathing rate (susceptibles) | 0.288 | m3 / h | For a sedentary person in the 41-<51 age group. | ||||||
201 | ||||||||||
202 | ||||||||||
203 | Note that mask fit may be as important as the type of mask, see this video: https://twitter.com/jljcolorado/status/1280935408398766080 | |||||||||
204 | 50% | Default value for the general population, with a variety of types of masks (cloth, surgical) and also variation on how well they are worn | ||||||||
205 | Reference: Davies et al. (2013) | |||||||||
206 | This number can vary widely from about 10% to about 80%, depending on the quality of masks and how they are worn. | |||||||||
207 | 90% | For N95 masks (KN95, FF2). If well fitted and worn their efficiency for the large particles that most likely contain the viruses is 99% or more. However we use a lower value for their use in the community in the real world, since most people are not fitted, and they are not worn perfectly and can have leaks. 90% may even be optimistic in that situation. | ||||||||
208 | 0% | For N95 masks that have an exhalation valve. Most of the air is exhausted through the valve, and there is little filtering | ||||||||
209 | See for example this article for a picture of that type of mask: https://www.healthline.com/health-news/certain-type-n95-mask-harm-covid19-spread | |||||||||
210 | Such masks are good for occupational exposure, if a worker is sanding, drilling etc. But they don't protect against exhaled particles. | |||||||||
211 | 65% | For surgical masks, from Milton et al. (2013) | ||||||||
212 | This is probably too high for the general population, which won't wear surgical masks as well as in a research study. We suggest using 50% | |||||||||
213 | 23% | For face shields worn without a mask. This is a guess, since the one study available is for inhalation, not for emission. But it makes sense that efficiency would be low, due to limited inertia of exhaled particles under normal breathing or talking. From https://www.ncbi.nlm.nih.gov/pmc/articles/PMC4734356/ https://www.youtube.com/watch?v=eGONzm3vduI | ||||||||
214 | ||||||||||
215 | ||||||||||
216 | The physical flows during exhalation and inhalation are different, and affect aerosol particles differently. Therefore the efficiencies are typically different | |||||||||
217 | 30% | Davies et al. (2013; https://pubmed.ncbi.nlm.nih.gov/24229526/) reported a filtration efficiency of 50% for homemade cloth masks that people put on themselves. After discussion w/ Linsey Marr, we "discounted" this to be conservative, given imperfect wearing and fit in the community. We think 30-50% is a reasonable number. The higher value for situations with more conscientious people who pay more attention to keeping the mask well fit at all times. | ||||||||
218 | 90% | For N95 masks (KN95, FF2). If well fitted and worn their efficiency for the large particles that most likely contain the viruses is 99% or more. However we use a lower value for their use in the community in the real world, since most people are not fitted, and they are not worn perfectly and can have leaks. 90% may even be optimistic in that situation. | ||||||||
219 | 23% | For face shields worn without a mask, from https://www.ncbi.nlm.nih.gov/pmc/articles/PMC4734356/ https://www.youtube.com/watch?v=eGONzm3vduI Also note misconception that "face shields protect from falling aerosols". Aerosols actually RISE around the human body, driven by personal thermal plume. See https://doi.org/10.1016/j.buildenv.2015.04.010 | ||||||||
220 | ||||||||||
221 | ||||||||||
222 | This refers only to replacement of indoor air with outdoor air. Recirculation of air with filtering is under "additional control measures" | |||||||||
223 | Note that e.g. a ventilation rate of 1 h-1 does not mean that 100% of the air is replaced in 1 h. That's the "plug flow" assumption, the air inside is displaced by the new air. But due to mixing it doesn't work that way. A better approximation is that the fraction of the intial air that remains in the space vs time is exp (-ACH * time) * 100%. So after 1 h, what remains is exp(-1 * 1) =* 100% = 36%, after 2 h, what remains is exp(-1 * 2) = 14% and so on. | |||||||||
224 | An MIT calculator for natural ventilation (through cracks, windows etc.) can be downloaded here: http://coolvent.mit.edu/ | |||||||||
225 | This can be measured approximately for a given space with a fast (few minutes response) CO2 meter such as this one | |||||||||
226 | See this post which explains how to do it with some graphs: https://medium.com/@jjose_19945/how-to-quantify-the-ventilation-rate-of-an-indoor-space-using-a-cheap-co2-monitor-4d8b6d4dab44?source=friends_link&sk=6cda52f5682a4a450a10691f07d1ad2c | |||||||||
227 | How: go into the space, be there breathing for a while (more people would help). Then leave quickly. Look at the data later, and look at the point at which the CO2 - 400 ppm was 63% of the peak. That is the time constant, and the ventilation rate is 1 divided by that. See calculator below. | |||||||||
228 | CO2 at peak | 1495 | ppm (for your particular measurement) | |||||||
229 | CO2 outdoors | 415 | ppm (global atmospheric background, don't change unless you know what you are doing) | |||||||
230 | Excess CO2 | 1080 | ppm | |||||||
231 | CO2 at 63% decay | 812 | ppm (you need to estimate how long it took from the peak till it reached this level) | |||||||
232 | Time of 63% val | 0.85 | h | |||||||
233 | Ventilation rate | 1.18 | h-1 (this is the result that you have to enter in the Master spreadsheet for ventilation rate | |||||||
234 | Literature values for several situations in h-1 (= ACH, air-changes-per-hour) | |||||||||
235 | 0.5-1.5 | Houses | Typical values with the windows closed. Depends on how airtight the construction is. Older buildings tend to have higher values | |||||||
236 | 3-15 | Windows open | Estimate for open windows. Value varies a lot depending on outdoor wind speed and geometry. | |||||||
237 | 0.1-8 | Primary school | ||||||||
238 | 2.5 | Univ classroom | ||||||||
239 | 0.4-5 | Univ classroom | ||||||||
240 | 5-6 | Univ classroom | ||||||||
241 | 2-11 | Univ classroom | ||||||||
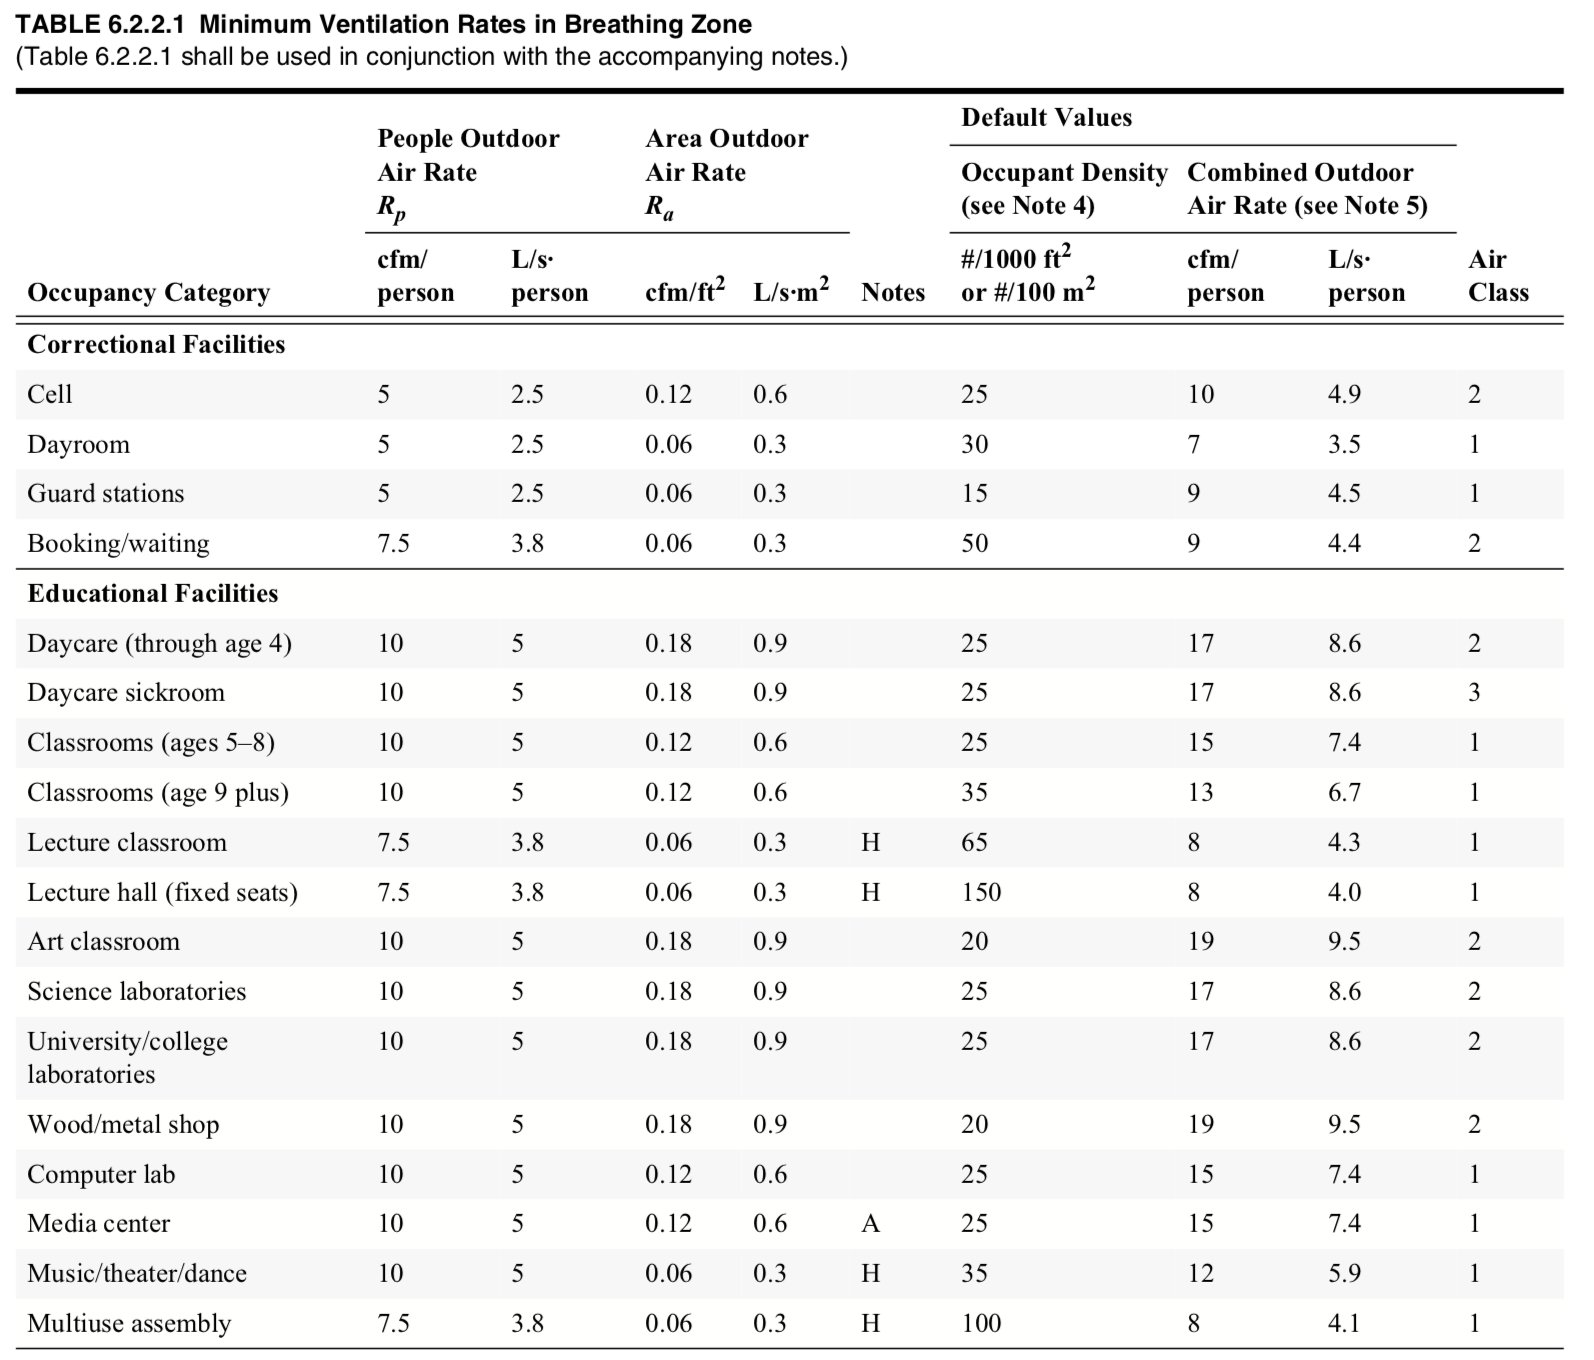
242 | Varies | ASHRAE 62 | ||||||||
243 | This is for commercial buildings. Per Prof. Shelly Miller: "If it was commissioned and maintained properly then this is probably a | |||||||||
244 | reasonable first estimate (if you can't measure or get hard data from facilities folks) (Link) | |||||||||
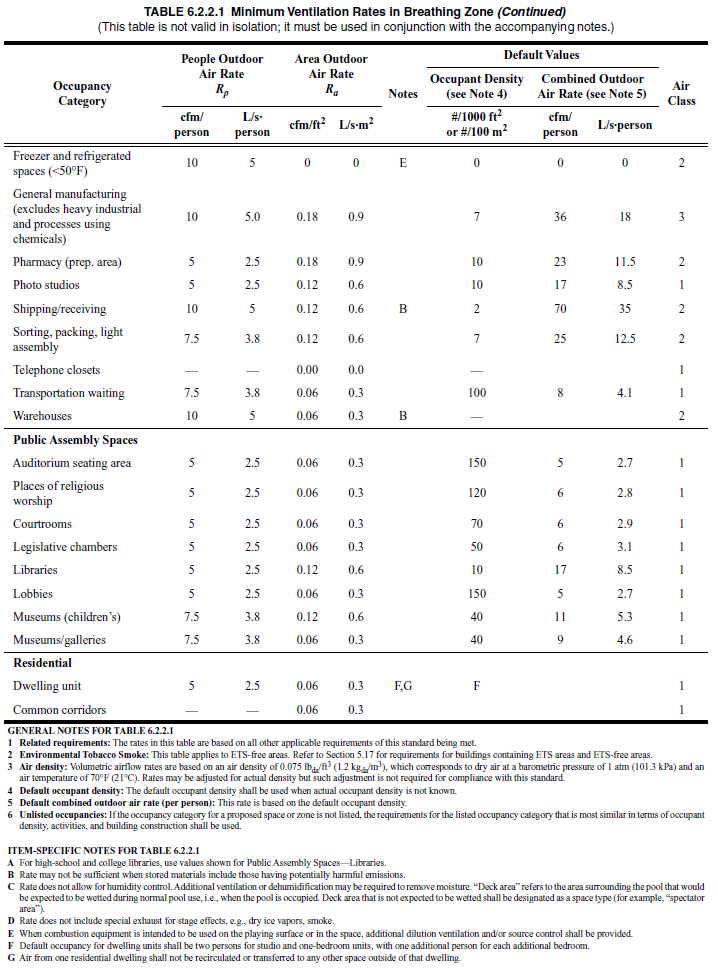
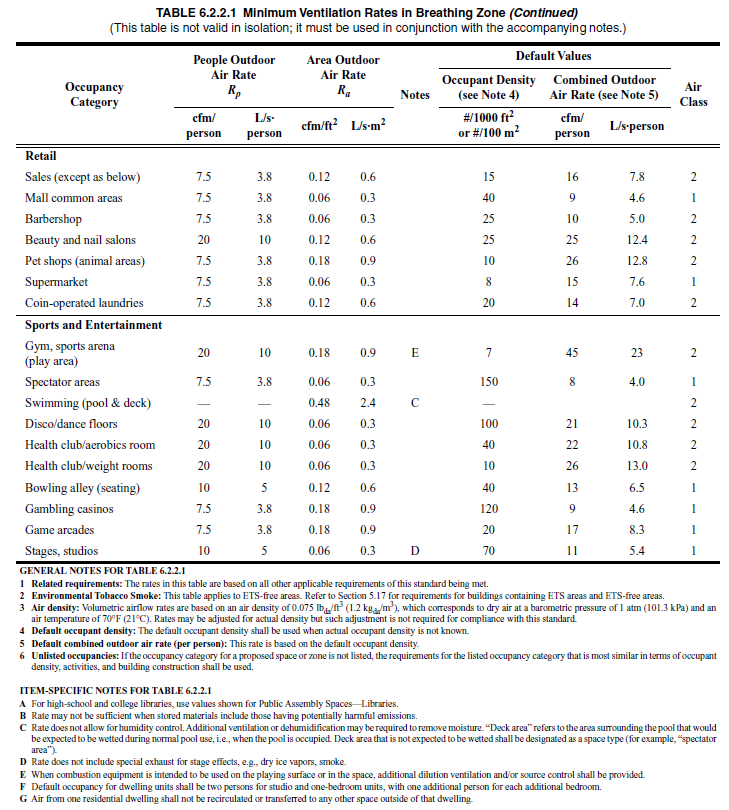
245 | Table from ASHRAE Std 62.1, 2013 version (I don't have the most recent version, and it cost $125 to purchase. I have asked an ASHRAE contact whether they could provide the more updated version). The design airflow is the sum of the people (max capacity) and the area terms. Applies to USA | |||||||||
246 | The standards from the table below will have been applied in the US for buildings built recently. Older buildings will have followed older standards. Old standards can also be obtained from the same ASHRAE page. E.g. for a building built in the US in 2005, look up the standard that was valid in 2005. Note that researchers do say that ventilation systems in old buildings are not always performing at the level they were designed to, due to a variety of maintenance problems. | |||||||||
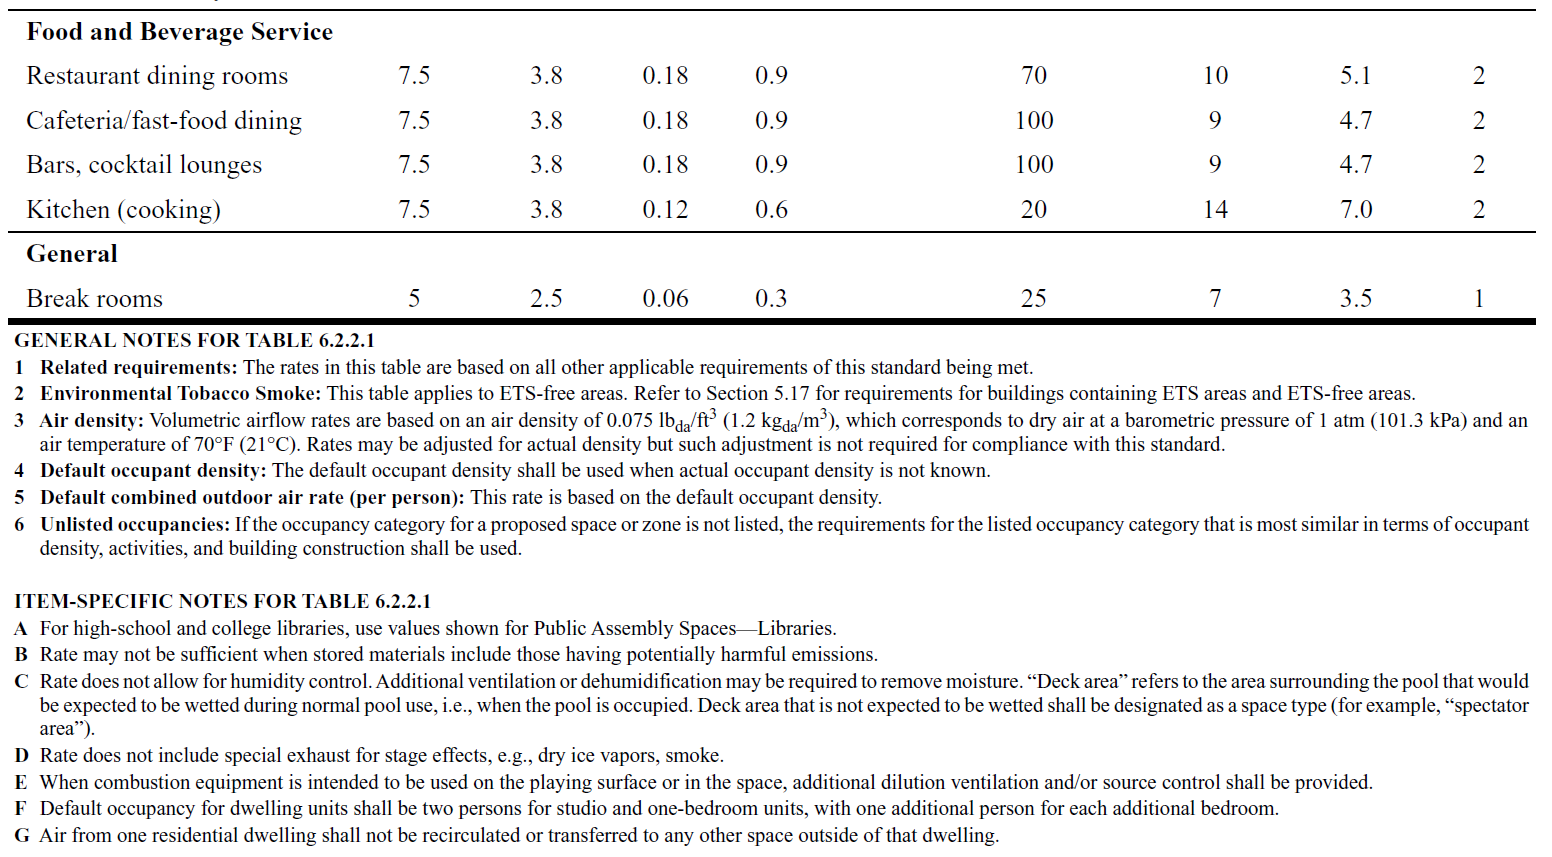
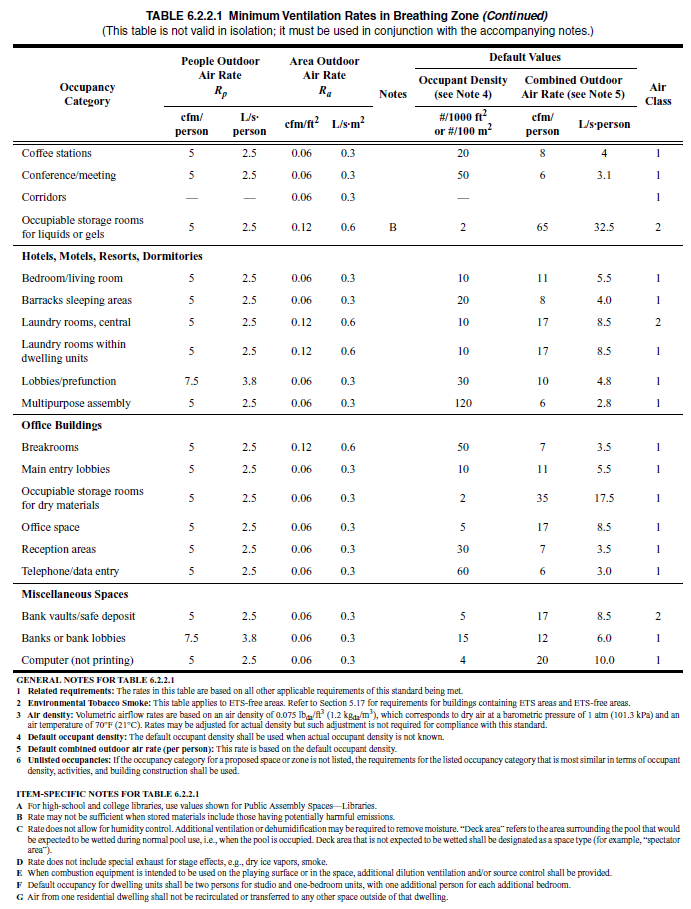
247 | To use in the other sheets, use the calculation below (example of daycare): | |||||||||
248 | Rp | 5 | L/s/person | From standard | ||||||
249 | Ra | 0.9 | L/s/m2 | From standard | ||||||
250 | Occupant density | 25 | per / 100 m2 | From standard | ||||||
251 | Surface area | 100 | m2 | For a specific location | ||||||
252 | Height of room | 3 | m | For a specific location | ||||||
253 | Volume of room | 300 | m3 | Product of two above, for a specific location | ||||||
254 | N occupants | 25 | people | Calculated according to standard, per values above | ||||||
255 | Vent Rate | 215 | L/s | Calculated according to standard, per values above | ||||||
256 | Vent. in h-1 | 2.58 | h-1 | This is the parameter you need to enter in the other sheets for vent. rate | ||||||
257 | ||||||||||
258 | ||||||||||
259 | ||||||||||
260 | ||||||||||
261 | ||||||||||
262 | ||||||||||
263 | ||||||||||
264 | ||||||||||
265 | ||||||||||
266 | ||||||||||
267 | ||||||||||
268 | ||||||||||
269 | ||||||||||
270 | ||||||||||
271 | ||||||||||
272 | ||||||||||
273 | ||||||||||
274 | ||||||||||
275 | ||||||||||
276 | ||||||||||
277 | ||||||||||
278 | ||||||||||
279 | ||||||||||
280 | ||||||||||
281 | ||||||||||
282 | ||||||||||
283 | ||||||||||
284 | ||||||||||
285 | ||||||||||
286 | ||||||||||
287 | ||||||||||
288 | ||||||||||
289 | ||||||||||
290 | ||||||||||
291 | ||||||||||
292 | ||||||||||
293 | ||||||||||
294 | ||||||||||
295 | ||||||||||
296 | ||||||||||
297 | ||||||||||
298 | ||||||||||
299 | ||||||||||
300 | ||||||||||
301 | ||||||||||
302 | ||||||||||
303 | ||||||||||
304 | ||||||||||
305 | ||||||||||
306 | ||||||||||
307 | ||||||||||
308 | ||||||||||
309 | Below are the additional tables from the standard, for other situations - enlarge the images to look for your situation of interest | |||||||||
310 | ||||||||||
311 | ||||||||||
312 | ||||||||||
313 | ||||||||||
314 | ||||||||||
315 | ||||||||||
316 | ||||||||||
317 | ||||||||||
318 | ||||||||||
319 | ||||||||||
320 | ||||||||||
321 | ||||||||||
322 | ||||||||||
323 | ||||||||||
324 | ||||||||||
325 | ||||||||||
326 | ||||||||||
327 | ||||||||||
328 | Standards for other regions should be roughly similar, but follow guidelines from other associations or national governments. | |||||||||
329 | ||||||||||
330 | ||||||||||
331 | There are several studies for this parameter that don't quite agree. I am consulting with the authors about what they recommend we use as a default | |||||||||
332 | Literature values in h-1 | |||||||||
333 | 0.63 | |||||||||
334 | ~0 | https://www.medrxiv.org/content/10.1101/2020.04.13.20063784v1 (lower confidence in this result due to lack of replicates) | ||||||||
335 | 0.2 - 1 | |||||||||
336 | 0.48 | |||||||||
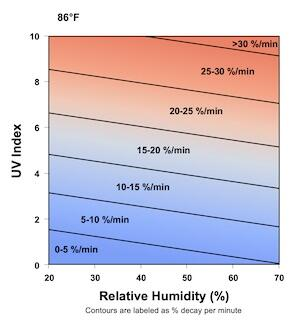
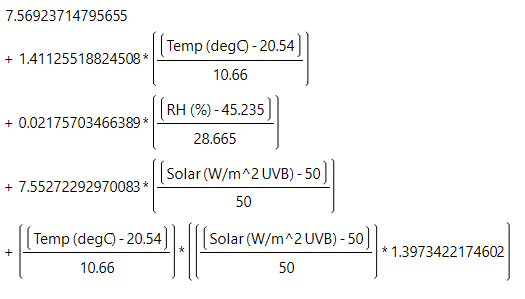
337 | ||||||||||
338 | The equation in the estimator is also implemented below. Enter your RH, T, UV index (0 indoors) to get decay estimate | |||||||||
339 | Graciously provided by Dr. Paul Dabisch, Dept. of Homeland Security, USA | |||||||||
340 | T (C) = | 20 | This is the input | |||||||
341 | T (F) = | 68 | For display only | |||||||
342 | RH (%) | 60 | (20 to 70, in % units) | |||||||
343 | UV index | 0 | 0 (indoors) to 10 (full sun noon) | |||||||
344 | ||||||||||
345 | Virus decay | 1.621 | h-1 | |||||||
346 | ||||||||||
347 | ||||||||||
348 | ||||||||||
349 | ||||||||||
350 | ||||||||||
351 | ||||||||||
352 | ||||||||||
353 | ||||||||||
354 | ||||||||||
355 | ||||||||||
356 | ||||||||||
357 | ||||||||||
358 | An important uncertainty is the size range of the infective particles. Here we assume 1-5 um, based on our read of the literature | |||||||||
359 | Literature values in h-1 | |||||||||
360 | 0.2-2 | (depends on air speed, particle size range) | ||||||||
361 | 0.24 | (as interpreted in Buonnano et al. 2020a) | ||||||||
362 | ||||||||||
363 | ||||||||||
364 | For a portable HEPA filter unit, use this calculation (metric units): | |||||||||
365 | HEPA flow rate | 440 | m3 h-1 | |||||||
366 | Room size | 147 | m3 | |||||||
367 | Removal rate | 3.0 | h-1 | Enter this value in cell for additional control measures | ||||||
368 | HEPA filter calculation (US units): | |||||||||
369 | HEPA flow rate | 260 | cfm (cubic feet per minute) | |||||||
370 | Room size | 5200 | ft3 | |||||||
371 | Removal rate | 3.0 | h-1 | Enter this value in cell for additional control measures | ||||||
372 | A more elaborate calculator for HEPA filters can be found here: https://tinyurl.com/portableaircleanertool | |||||||||
373 | ||||||||||
374 | For recirculated air, either with or w/o filter, w or w/o germicidal UV or other measures | |||||||||
375 | For air that is recirculated through an HVAC system, there are also particle losses. We know since virus RNA has been found in the surfaces of HVAC system, and also from basic aerosol dynamics and losses in tubing. This will happen even if there is no filtration, and will be enhanced by length of ducting and bends. If there are filters in the HVAC system, that will increase the removal. See the calculator below (HT Jim Bagrowski) | |||||||||
376 | If you have some other "air cleaner" in the ducts (ionic system etc.), you also need to estimate it in the same way as the previous item, depending on the rate of recirculation, and the efficiency of the system in removing particles. | |||||||||
377 | Recirculated flow rate = | 300 | m3 / h | Can also enter values in cubic feet per hour, if next row is in cubic feet | ||||||
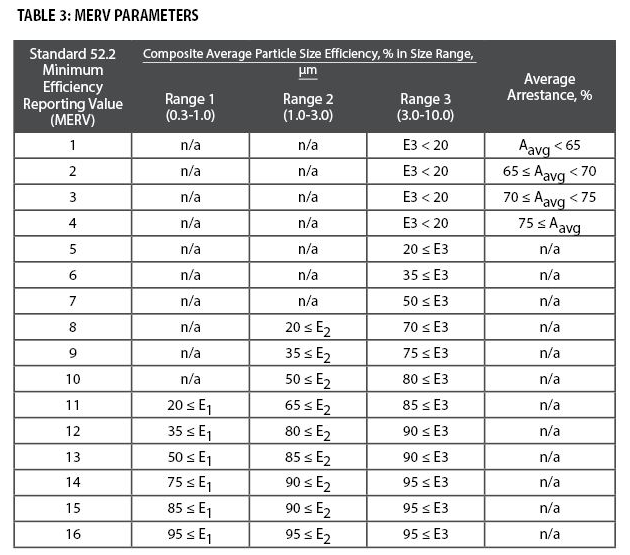
378 | Volume of room = | 100 | m3 | |||||||
379 | Filter efficiency = | 20% | Enter from table below, I recommend value in 1-3 microns. Example = MERV 8 | |||||||
380 | Removal in ducts, air handler = | 10% | Assuming some losses in bends, air handler surfaces etc. Just a guess | |||||||
381 | Other removal measures = | 0% | Germicidal UV (or other systems), from specs or the system | |||||||
382 | ACH for additional control meas = | 0.9 | h -1 | Enter this value in cell for "Additional control measures" | ||||||
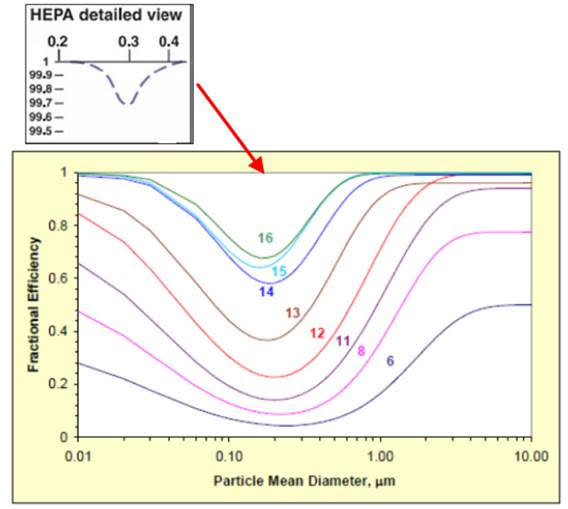
383 | ||||||||||
384 | - Table of filter efficiency from https://www.nafahq.org/understanding-merv-nafa-users-guide-to-ansi-ashrae-52-2/ We are not sure the particle size that contains more virus, but suspect it is 1-10 um mostly, based on our read of the literature. Therefore using 1-3 um to be conservative. - The curves are useful to understand the size dependence of filtering for different MERV grades in more detail. See this link https://www.nafahq.org/merv-filter-models/ for the details about the curves, and a lot more technical information on filtering. | |||||||||
385 | ||||||||||
386 | ||||||||||
387 | ||||||||||
388 | ||||||||||
389 | ||||||||||
390 | ||||||||||
391 | ||||||||||
392 | ||||||||||
393 | ||||||||||
394 | ||||||||||
395 | ||||||||||
396 | ||||||||||
397 | ||||||||||
398 | ||||||||||
399 | ||||||||||
400 | ||||||||||
401 | ||||||||||
402 | ||||||||||
403 | ||||||||||
404 | ||||||||||
405 | ||||||||||
406 | ||||||||||
407 | ||||||||||
408 | This depends on the state of the pandemic in a given region and time period, as well as the dynamics of the disease and its infectivity in different types of cases, which are not known very precisely | |||||||||
409 | For the US, you could use the online tools below to find the current estimated fraction of infectious people in a given county | |||||||||
410 | ||||||||||
411 | ||||||||||
412 | ||||||||||
413 | On a simple test for Boulder on 22-Jul, the tools give 0.08%, 0.25%, 0.49% infectious respectively. I have asked for input from epi folks about which may be more accurate, or whether the uncertainty is that large | |||||||||
414 | For other countries, this tool has country-level estimates of the current fraction of infected | |||||||||
415 | ||||||||||
416 | For the UK, you can get estimates from here: https://covid.joinzoe.com/data | |||||||||
417 | This parameter is not easy to quantify accurately, but one can hope to get the order-of-magnitude right from the disease prevalence data and/or the epidemiological models. People are thought to be contagious mostly the week around the onset of symptoms, so that has to be taken into account in the estimates. Also there is a fraction of undetected contagious cases (asymptomatic / presymptomatic), which will increase transmission. Plus one would hope that a major fraction of the cases that are in quarantine or a hospital and not transmitting the disease much. The uncertainty on the fraction of contagious individuals in the community is one more reason why the absolute risk values will be uncertain, but the relative risks will still be robust. | |||||||||
418 | A range of values is estimated below to provide some bounds. An in-between value of 0.3% is used as default, as the approx. geometric mean of the results below | |||||||||
419 | One estimate for New York City (NYC) at the height for their large outbreak in March-May 2020 | |||||||||
420 | Fraction of of the population that got infected over a period of 2 months | 20% | ||||||||
421 | Duration of infective period | 7 | days | |||||||
422 | Fraction of population infective at a given time: | 2.3% | ||||||||
423 | Another estimate for Boulder, CO in early June 2020 (low prevalence): | |||||||||
424 | New cases per day per 100,000 people (from NYT database) | 1.8 | ||||||||
425 | Fraction of asymptomatic or unreported cases | 50% | ||||||||
426 | Duration of infective period | 7 | days | |||||||
427 | Fraction of population infective at a given time: | 0.03% | ||||||||
428 | ||||||||||
429 | ||||||||||
430 | Immunity can be acquired due to vaccination or due to the disease | |||||||||
431 | Through vaccination | |||||||||
432 | The fraction of vaccinated people can be obtained from web sources such as the New York Time vaccination tracker | |||||||||
433 | To be more precise, if a vaccine is e.g. 90% effective, the number of immune people is the product of the number of vaccinated people and the vaccine efficacy. E.g. if 10 people present are vaccinated, and the vaccine is 905 effective, then 10 * 90% = 9, and you would use 9 vaccinated people to calculate the number of immune people present. | |||||||||
434 | It can get a little trickier, e.g. if you want to account for the efficacy in preventing mild disease vs serious disease etc. This is easiest to do by running the estimator several times, one for each case of interest. | |||||||||
435 | Through the disease | |||||||||
436 | As the disease progresses, the fraction of the population that has had the disease and has some immunity is not negligible, and may be higher than 20% in some areas. This reduces the number of people who could possibly get infected. | |||||||||
437 | It can be estimated from studies such as this one: https://jamanetwork.com/journals/jamainternalmedicine/fullarticle/2768834 | |||||||||
438 | You can estimate this number for US States and many countries using the total number of people ever infected at: https://covid19-projections.com/ | |||||||||
439 | Variants of concern complicate this estimation, since some of them appear to reduce the efficacy of the vaccines, and/or can lead to reinfection of previously-infected people | |||||||||
440 | As of May 2021 the details are not clear and appear complex. If this is important for your application, we suggest consulting the literature for the latest updates | |||||||||
441 | ||||||||||
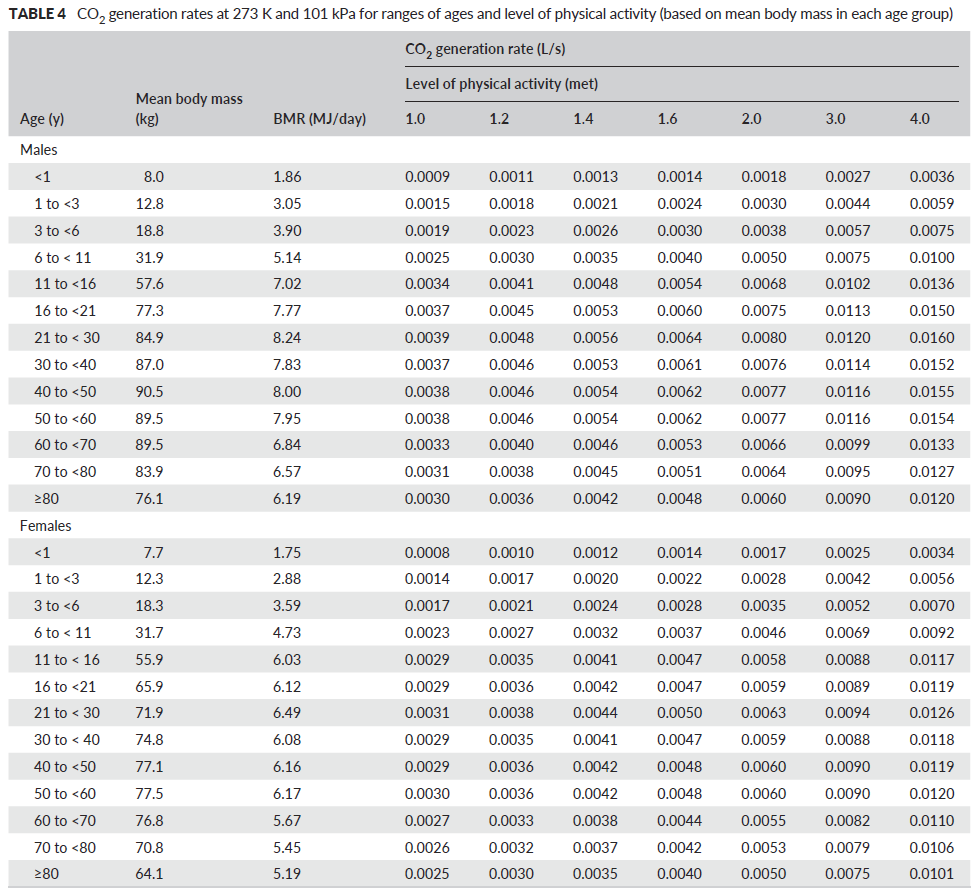
442 | ||||||||||
443 | See FAQs for the usefulness and limitations of this method | |||||||||
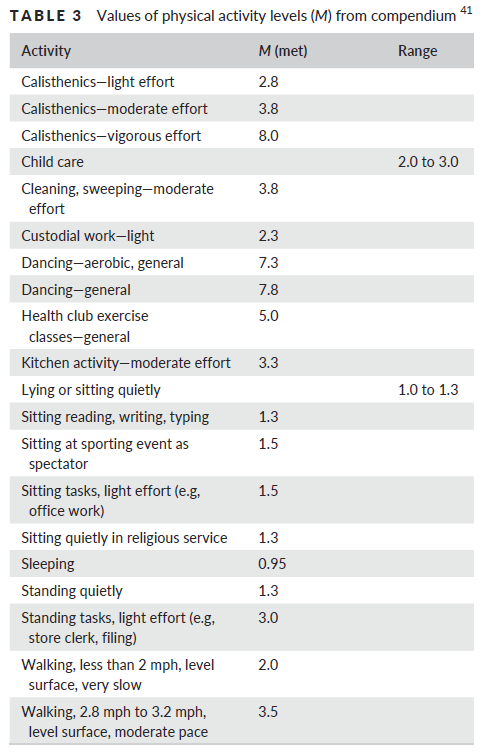
444 | The method and tables are from Persily and de Jonge (2017) | |||||||||
445 | First determine the metabolic rate (met) for the activity of interest from Table 3 | |||||||||
446 | Then, determine the CO2 generation rate based on the age, gender, and metabolic rate | |||||||||
447 | If met > 4 on table 3, you can use the highest value (for met = 4) in Table 4, or one could use the equations in the paper. For A Persily (pers comm): "when you get above 4, people usually can’t sustain such activity levels for very long, except maybe real athletes, and how their body responds depends a lot on physical conditioning, etc. One can still use equations 9 and 11 in Persily and de Jonge (2017), at high values but the uncertainties are likely to be higher for the reasons I just tried to explain" | |||||||||
448 | Then enter the value you determine on the spreadsheet for calculation | |||||||||
449 | ||||||||||
450 | ||||||||||
451 | ||||||||||
452 | ||||||||||
453 | ||||||||||
454 | ||||||||||
455 | ||||||||||
456 | ||||||||||
457 | ||||||||||
458 | ||||||||||
459 | ||||||||||
460 | ||||||||||
461 | ||||||||||
462 | ||||||||||
463 | ||||||||||
464 | ||||||||||
465 | ||||||||||
466 | ||||||||||
467 | ||||||||||
468 | ||||||||||
469 | ||||||||||
470 | ||||||||||
471 | ||||||||||
472 | ||||||||||
473 | ||||||||||
474 | ||||||||||
475 | ||||||||||
476 | ||||||||||
477 | ||||||||||
478 | ||||||||||
479 | ||||||||||
480 | ||||||||||
481 | ||||||||||
482 | ||||||||||
483 | ||||||||||
484 | Version log | |||||||||
485 | 1.0 | 15-Jun-2020 | Started development of the estimator, adapting previous work | |||||||
486 | 2.0 | 23-Jun-2020 | ||||||||
487 | 2.1-2.4 | 23-Jun-2020 | Made various clarifications and references to the text | |||||||
488 | 2.5 | 23-Jun-2020 | Some more clarifications, fixed some issues with text, added outdoors and demonstration cases | |||||||
489 | 2.6 and later | 24-27 June | Some clarifications to the text, added FAQs sheet and more detail on the input parameters | |||||||
490 | 2.7.0 and later | 28-29 June | Fixed mistake in description of Campus / B11 and / B12. Added and reorganized FAQs. Added ASHRAE Standards calculator | |||||||
491 | 2.7.7 and later | 30-Jun-20 | Fixed error in Outdoors and Demonstration tabs (in conversion to m/s). New results are even lower for transmission outdoors | |||||||
492 | Colored duration of event as an input, was white in several of the sheets. Clarified some of the labels. Added several FAQs and explanations. | |||||||||
493 | 2.7.9 and later | 1-Jul-20 | Text clarifications, added FAQs | |||||||
494 | 2.8.0 and later | 2-3 July | Added efficiency for face shields, added FAQs | |||||||
495 | 2.9.0 and later | 4-Jul-20 | Updated calculation of students in "Classroom" sheet, so that it can be calculated from the surface area per student. Updated FAQs | |||||||
496 | 3.0.0 and later | 6-Jul & later | Added calculator for portable HEPA filters in Readme sheet. Updated several FAQs | |||||||
497 | Clarified that the number of instructors = 1 in the classroom is an assumption and is not an input. | |||||||||
498 | Minor adjustments to outdoors case to match Skagit choir event, except outdoors instead of indoors (There were some small differences) | |||||||||
499 | Changed units of occupant density to people per 100 m2 to match the standard, as people / m2 was causing confusion | |||||||||
500 | 3.0.9 and later | 14-Jul-20 | Fixed bug in classroom sheet, instructor was using student breathing rate instead of instructor (not a big change in results) | |||||||
501 | Added link to Shelly Miller's report on air cleaners and table of rec. cleaners in the US (FAQs) | |||||||||
502 | 3.1.0 | 16-Jul & later | Added conditional vs absolute probability to Choir case | |||||||
503 | Updated multiple FAQs | |||||||||
504 | Tried implementing DHS virus decay rate on readme page. However results don't agree with online tool yet, checking w/ authors | |||||||||
505 | 3.2.0 | 20-Jul-20 | Released beta sheet with new format, for testing and comments | |||||||
506 | Added some steps towards the CO2 estimation | |||||||||
507 | 3.2.6 & later | 21-Jul-20 | Completed CO2 estimation, fixed multiple bugs in beta sheet (thanks to Prasad Kasibhatla for his eagle eyes!) | |||||||
508 | Finished calculator of Dabish DHS virus decay rates (consulting with him and other experts about what is best to use for that rate) | |||||||||
509 | Updated breathing rates with EPA report, clearly higher quality than what I was using before (thanks to Susan Masten) | |||||||||
510 | Added direct links for Copy to G Drive & download to Excel, since File doesn't work at > 100 users (thx Joe Bruce for pointing out this was possible) | |||||||||
511 | Fixed error in Campus sheet, N students in classroom was missing from calc of student cases (thanks to Prasad Kasibhatla) | |||||||||
512 | Clarified on each sheet which results are conditional vs. absolute, which seemed to be the most confusing feature | |||||||||
513 | Replaced "airborne" with "aerosol" everywhere to avoid confusion | |||||||||
514 | Updated multiple FAQs and readme descriptions | |||||||||
515 | 3.3.0 & later | 22-Jul & later | Added the fraction of immune people to the Master sheet | |||||||
516 | Updated class sheet using new master sheet | |||||||||
517 | Removed breathing rate of index case since it does not enter the calculations | |||||||||
518 | Updated Subway sheet to new master sheet | |||||||||
519 | 3.3.8 & later | 24-July & later | Added calculator for other removal measures (HT Jim Bragowski) | |||||||
520 | Added calculator to estimate ventilation rate from decay of CO2 after leaving location | |||||||||
521 | Añadido enlace a charla grabada en espanol / castellano, describiendo la herramienta, y demostrando cómo usarla | |||||||||
522 | Spelled checked whole document (HT Gary Chaulklin) | |||||||||
523 | Updated breathing rate for Class from sedentary to avg of sedentary and light activity for 16-21 yr old (Adapt as needed for your case) | |||||||||
524 | Highlighted that ventilation in L/s/person is what really matters for disease transmission | |||||||||
525 | Updated references for typical mask inhalation efficiency in the community (HT Linsey Marr) | |||||||||
526 | Updated calculation of ventilation in L/s/per to use total ppl present (as using susceptible + infected, no longer accurate if immune ppl present) | |||||||||
527 | Moved location of L/s/per and density of people to make those intermediate outputs clearer | |||||||||
528 | 3.4.0 & later | 31-Jul & later | Updated FAQs | |||||||
529 | Added stadium sheet based on a case study | |||||||||
530 | Added supermarket case | |||||||||
531 | Added additional tables from 2013 ASHRAE standard (sorry, I hadn't realized there were more pages when I first added this info) | |||||||||
532 | 3-Aug & later | Updated absolute probability from (1-exp(-B67*B89/B38)) to 1 - (1 - B70*B57)^B40. Only matters for high probs (HT Prasad Kasibhatla) | ||||||||
533 | 3.4.8 | 6-Aug & later | Added ratio of infection probability to excess CO2 breathed, to better quantify risk of inhaled CO2 under different situations | |||||||
534 | Added ppm CO2 levels for certain levels of risk for conditional and absolute cases | |||||||||
535 | Found better way to keep tables in FAQ in places, they kept jumping up every few days somehow | |||||||||
536 | Added more info to FAQ and Readme pages | |||||||||
537 | Fixed typo on background CO2 in readme, should be 415 pm not 550 ppm | |||||||||
538 | Labeled all sheets on the old format as "_Old" on their tab names. I intend to transfer those to the new format as soon as I can, hopefully the coming weekend. The new format is much clearer, in particular the difference between conditional and absolute probabilities is very confusing to a lot of people, so it helps to have them shown separately. | |||||||||
539 | 3.4.14 | Updated "for any one person" --> "for a given person" on the results label, as the former was being confused with being for all persons present | ||||||||
540 | 3.4.17 | 5-Sep-20 | Fixed error in calculator of fraction of infective population (Readme/row 398 at present, was dividing by asympt/unreported fraction, need to divide by 1-that | |||||||
541 | 3.4.18 | 29-Sep-20 | Added feedback form | |||||||
542 | 3.4.19 | 27-Oct-20 | Updating of references | |||||||
543 | 3.4.20 | 28-Nov-20 | Clarification of Readme page | |||||||
544 | 3.4.21 | 29-Dec-20 | Fixing typo on several of the case sheets | |||||||
545 | 3.4.22 | 1-Feb-21 | Updated Miller reference | |||||||
546 | 3.4.23 | 26-Mar-21 | Added Dr. Zhe Peng as co-developer | |||||||
547 | 3.4.24 | 26-Mar-21 | Fixed typo on cell B88 in Subway, Superm., and Stadium sheets (RH was being used erroneously instead of background CO2 level). HT Bill Mason | |||||||
548 | 3.5.1 | 23-Apr-21 | Added location and explanation for risk parameters from Peng et al. (2021) preprint. Parameter calculation to be added soon | |||||||
549 | 3.5.2 | 28-Apr-21 | Implemented calculation of risks parameters on Master-Choir sheet. Added calculation of the risk table | |||||||
550 | 3.5.3 | 3-May-21 | Clarified that vaccinated people are added to immune in spreadsheets and readme | |||||||
551 | Added increased quanta emission due to variants to all 5 latest format sheets, and explanation & link to Readme sheet | |||||||||
552 | Added relative breathing rate, relative quanta, and risk parameters to all 5 latest format sheets | |||||||||
553 | 3.5.5 | 4-May-21 | Added two new versions to the "Risk Table" | |||||||
554 | Explained in readme how to account for the effectiveness of the vaccine | |||||||||
555 | 3.5.6 | 19-Jul-21 | Added estimate of increased transmissibility of Delta variant to Readme page | |||||||
556 | Changed color of variant parameter to orange (important) and changed explanation on calculation spreadsheet | |||||||||
557 | 3.5.7 | 26-Jul-21 | Added simple calculation of equivalent ventilation rate outdoors to Risk Table sheet | |||||||
558 | 3.5.8 | 10-Nov-21 | Made the Delta variant default in all the new format spreadsheets, since it seems to dominate almost everywhere | |||||||
559 | 3.5.9 | 21-Dec-21 | Added the Omicron variant to the readme page, estimated increase of transmissibility of 4. Also added to explanation in all sheets | |||||||
560 | 3.6.0 | 6-Jan-22 | Changed Omicron transmissibility to 2.5, more consistent with recent literature (but still uncertain) | |||||||
561 | Changed the reference to the spreadsheet to the published peer reviewed paper by Peng. et al. (2022) | |||||||||
562 | 3.6.1 | 6-Jan-22 | Clarified the application of variants other than initial Wuhan variant to the "Risk Tables" sheet | |||||||
563 | 3.6.2 | 7-Jan-22 | Made basic quanta emission rate and breathing rate explicit variables in the "Risk Tables" sheet | |||||||
564 | Decreased hospitalization rate from 20% to 10%. This parameter varies with variant and age of participants. | |||||||||
565 | 3.6.3 | 7-Jan-22 | Changed the implementation of the quanta emission rate in the spreadsheets, to make it less confusing and more consistent w/ Peng et al. (2022) | |||||||
566 | IMPORTANT: Increased default (sedentary & silent) quanta emission rate from 2 to 18.6 q h-1, to make it consistent w/ results of Peng et al. (2022) | |||||||||
567 | The increase in the basic quanta emission rates increases the infection probabilities compared to prior versions. It is more consistent with known superspreading events in the literature, as demonstrated in Peng et al. (2022) | |||||||||
568 | 3.6.4 | 7-Jan-22 | Updated table of quanta emission rates in readme file to now list relative increases in the emission factor, for consistency with Peng et al. (2022) | |||||||
569 | 3.6.5 | 14-Jan-22 | Changed the exponent in the expression of absolute probability of infection from number of susceptible people to N - 1 | |||||||
570 | Changed the reference Peng et al. (2021) submitted in a few places to the published peer reviewed paper Peng. et al. (2022) | |||||||||
571 | 3.6.6 | 27-Jan-22 | Fixed error in risk calculation in the "Risk Tables" sheet. Only affected very high risk situations, making the risk appear larger than it is | |||||||
572 | Correction explaining it forthcoming in Environ. Sci. Technol. | |||||||||
573 | 3.6.7 | 27-Jan-22 | Added link to download Buonnano et al. model to FAQs. It used to be there but seems to have been lost at some point | |||||||
574 | 3.6.8 | 21-Mar-22 | Added Omicron BA.2 variant (relative transmissibility of ~3.3) | |||||||
575 | ||||||||||
576 | Planned Improvements for future consideration | |||||||||
577 | ||||||||||
578 | Other possible improvements | |||||||||
579 | Add a time-dependent solution for one case, with a graph | |||||||||
580 | Explain quanta in this tool vs MonteCarlo tools | |||||||||
581 | Add an initial condition of quanta, to reflect a previous run with a previous use of the space (that just decays exponentially) | |||||||||
582 | Add drop down menus for quanta, breathing rates to master sheet | |||||||||
583 | Adapting all the current cases into the updated general master sheet | |||||||||
584 | Adding an estimate of the close contact situation | |||||||||
585 | Adding the Guangzhou restaurant super-spreading event as an example | |||||||||
586 | Adding a hospital situation (need to ask people who work at hospitals for details) | |||||||||
| A | B | |
|---|---|---|
1 | ||
2 | Frequently Asked Questions (FAQs) about Estimator of COVID-19 Aerosol Transmission | |
3 | ||
4 | FAQs about the estimator: big picture | |
5 | ||
6 | Is there some general explanation of your tool for a general audience? | |
7 | Yes, see this CIRES Press Release: https://cires.colorado.edu/news/covid-19-airborne-transmission-tool-available | |
8 | National Geographic has created a simplified version of this tool, which is easier to use to compare different cases: https://www.nationalgeographic.com/science/2020/08/how-to-measure-risk-airborne-coronavirus-your-office-classroom-bus-ride-cvd/ | |
9 | Also this presentation: https://twitter.com/jljcolorado/status/1283868965849059328 | |
10 | Robin Lloyd has published a short summary in Scientific American: https://www.scientificamerican.com/article/coronavirus-news-roundup-for-june-20-june-26/ | |
11 | It has been covered in other news articles, too many to keep track of them here | |
12 | ||
13 | Are there examples where you or others have applied the estimator to investigate some cases in more detail? | |
14 | There has been limited time to document cases. I list below some useful cases that people have reported using the tool. If you run the tool for a given case, do share your results in some form, e.g. blog post, Twitter, or just a Google Doc that's publicly viewable, and send me the link for posting here. | |
15 | This blog post from Prof. Andrew Maynard applies the model to a one semester course at his University and explores the trends in the results | |
16 | Ryan Davis (a PhD graduate of our program at CU-Boulder) summarized his results for college classroom situations in Twitter | |
17 | ||
18 | How can I let other people know about the estimator? | |
19 | You can send them the link to this online document: https://tinyurl.com/covid-estimator | |
20 | Some people have trouble with the tinyurl links, in that case you can share the direct (if more cumbersome) link: https://docs.google.com/spreadsheets/d/16K1OQkLD4BjgBdO8ePj6ytf-RpPMlJ6aXFg3PrIQBbQ/edit#gid=519189277 | |
21 | If more than 100 people are trying to view the document, Google sends extra people automatically to the View-only version, which does not allow use of the File menu. In that case the links on the green area on the top right of the Readme page allow making a copy into Google Drive, or downloading into Excel | |
22 | If you use Twitter, you can also re-tweet the original release Tweet: https://twitter.com/jljcolorado/status/1275466006312304640 | |
23 | ||
24 | I get some Excel errors when I open the spreadsheet, do these matter? | |
25 | The downloaded spreadsheet can give some nominal errors when opening in Excel, but if you say "yes" it seems to run fine, so we don't think those affect anything. Nobody has told me that it doesn't work for them, once they download. | |
26 | I don't know how to change that, since it is a native GSheet and Google is converting it into Excel. Sorry for the confusion this may cause. (If any of you knows how to fix this detail, let me know) | |
27 | ||
28 | ¿Puede traducir esta herramienta al castellano / español? (Can you translate this tool into Spanish?) | |
29 | En principio podría porque soy de Zaragoza (España), aunque llevo 27 años en Estados Unidos. Pero también lo pueden hacer los usuarios poniendo el texto en el traductor de Google. De momento estamos cambiando cosas varias veces al dia, añadiendo explicaciones, corrigiendo algún error, añadiendo nuevos aspectos del cálculo, añadiendo casos etc. Así que recomendamos siempre bajar la ultima version antes de empezar a usar la herramienta. Y mantener dos versiones me llevaria mas tiempo de el que tengo ahora. Si las cosas se calman y la herramienta no esta cambiando (y todavía es útil), entonces haria el esfuerzo. | |
30 | ||
31 | How do I cite this estimator? | |
32 | Cite the peer-reviewed paper that describes the model and this estimator: Peng et al., Env. Sci. Technol. (2022). For the online estimator itself, cite "J.L. Jimenez and Z. Peng, COVID-19 Aerosol Transmission Estimator, https://tinyurl.com/covid-estimator, accessed XX-YYY-202Z" for scientific documents, or just the link for online documents should be sufficient. I do intend to keep the document online indefinitely. For scientific documents you should also cite the papers in which it is based (Miller et al., Buonnano et al. 1 & 2, Riley et al.) | |
33 | ||
34 | I would like to use this estimator, but this is very difficult to understand. What can I do? | |
35 | The experience so far from the feedback we are getting is that scientists (or people with quantitative backgrounds in other professions) are able to quickly understand the estimator and put it to use, sometimes asking us a question or two. People without a science or quantitative background have more trouble. I can't support users with limited background individually, unfortunately. If you are in the latter situation, I would reach out to someone you know who may be more familiar with science, physics, math, computer programming etc. and see if they can help. | |
36 | ||
37 | ||
38 | ||
39 | What is the structure of the model? | |
40 | It is a box model to track a pollutant (in this case the virus) in an indoor space, see for example Chapter 3 of Daniel Jacob's book http://acmg.seas.harvard.edu/people/faculty/djj/book/bookchap3.html#pgfId=112721, plus the Wells-Riley model of infection https://academic.oup.com/aje/article-abstract/107/5/421/58522 | |
41 | ||
42 | I don't use feet or square feet, can I just work on metric units? | |
43 | Yes, the sheets take the dimensions in feet, but they immediately convert them to meters, and use the meters in all subsequent calculations. So you can type your values in m or m2 directly into those cells (and ignore the ones in feet), and the spreadsheet will work the same. | |
44 | One exception is the surface area per student in the "Classroom" sheet. You will need to update that calculation to work with students / m2 | |
45 | ||
46 | How do I model a situation in which only some people are wearing masks? | |
47 | You can run two cases, one with masks and one without, and that will bound the probability of infection. | |
48 | To get the average effect, you can multiply the mask efficiency by the fraction of the people wearing masks, for both emission and inhalation. So for example if 50% of the people are wearing surgical / clothy masks, you would enter 25% (0.5 * 50%) for emission efficiency, and 15% (0.5 * 30%) for inhalation efficiency | |
49 | To estimate a specific case (e.g. infected person not wearing a mask, susceptible person is wearing a mask), just adjust the efficiencies of emission and inhalation accordingly in the sheet. | |
50 | ||
51 | If I use the classroom-campus sheets, and I double the class duration and half the number of classes, the number of cases increases. Is this a bug? | |
52 | If you shorten the semester to 6.5 weeks, double number of class periods, to get the same h/ semester for student and instructor, the number of cases stays the same | |
53 | If you double the class period to 100 min, but reduce the number of class periods (for students) from 2 to 1 in the default case, the number of cases increases from 593 to 704 student cases. This is slightly non-linear because the longer class period allows more accumulation of infectious quanta in the room, so the second 50 min. have a higher probability of infection than the first 50 min. | |
54 | ||
55 | How good is the assumption that the air is well mixed within the room? | |
56 | How good this assumption is depends on the specific situation. If a 6ft / 2 m distance is kept, it should apply approximately in many situations. And on average, inhomogeneities will partially cancel out. For example, assume an extreme example of a room where 1/2 of the volume has 0 quanta / m3 and the other 1/2 has twice the average quanta concentration. As long as the number of inhaled quanta is low (< 0.3 or so), the infection risk is linear with the quanta (1- exp(-qi) ~ qi, per https://en.wikipedia.org/wiki/Taylor_series#Exponential_function), and the average number of infections will be the same as it would be in a well-mixed room. At higher concentrations the well-mixed situation is riskier, due to the saturation of the infection probability due to the exponential function. | |
57 | ||
58 | ||
59 | A quanta is defined as an infectious dose of the aerosol pathogen, whose inhalation leads to infection. Quanta are discrete and present at very low concentration. For example a given room may have 3 quanta (analogous to pathogen-loader aerosol particle(s)) floating in it, and a susceptible person may or may not be "lucky" enough to inhale at least one of the quanta, given a certain breathing time in the room.
The exponential form of the probability equation reflects the probability of a susceptible person in the room inhaling at least one quanta, based on a Poisson statistical distribution of the number of discrete quanta inhaled by a susceptible person present in the space, given a certain aerosol quanta concentration in the room and an inhalation time. As a result, if the average inhaled amount is one quanta, then 63% of the susceptibles will be infected. It is part of the Wells-Riley model of aerosol infection, see https://academic.oup.com/aje/article-abstract/107/5/421/58522 | |
60 | Quanta are specific for each disease. They lump together in an empirical parameter the rate of emission of viruses as part of respiratory particles in exhaled breath, the infectivity of the viruses upon emission, the particle size distribution of the emissions, the deposition efficiency and deposition location in the respiratory track of the susceptible person of those particles, and the probability that deposition leads to infection. Trying to model each of those parameters explicitly is daunting. As each parameter by itself is quite uncertain, especially for a new disease like COVID-19, the resulting uncertainty of the fully detailed model would be enormous. We can instead use the concept of quanta, and calibrate the emission rate to known outbreaks of the disease. In this way we can do realistic modeling (as in this tool) even with incomplete information about all those factors. | |
61 | ||
62 | What quanta should I use for singing or shouting? | |
63 | We believe the value of 970 q h-1 is realistic for the Skagit Choir case. It does seem that this was probably a "super-emitter" case, i.e. a person who was emitting an unusually high amount of virus. It is suspected that such "super-emitters" may be partially responsible for super-spreading events (see https://www.sciencemag.org/news/2020/05/why-do-some-covid-19-patients-infect-many-others-whereas-most-don-t-spread-virus-all), in addition to environmental conditions that help the virus transmit at the room-level. Values for loudly speaking / singing recommended by Buonnano range 60-400 q h-1 depending on the level of activity of the person (see "Readme" sheet). So it depends what you are trying to simulate. If you want to see the probability for a worst-case scenario, then use 970 q h-1. For a more typical case, we would recommend 150 q h-1. In any case it is the RELATIVE risk when you change something (ventilation, masking...) that is most meaningful, and that will be much more similar for the two emission rates. | |
64 | ||
65 | What about resuspension of virus-laden particles that have settled on the floor? | |
66 | This is a concern. I.e. large drops or aerosol particles settle to the floor (this is accounted for in the estimator for the aerosols). The people walking in the room, or while vacuum cleaning, put some of those particles back into the air. Ideally we would add that to the model, but it is quite uncertain and complex to do so. (If you have ideas about how to implement a quick estimate, let me know) | |
67 | ||
68 | The air within a room is not always well mixed. Doesn't that lead to over- or under-estimating infection risk? | |
69 | One limitation, really of the box model of mixing and dilution (not of the Wells-Riley infection model) is that the air is assumed to be well mixed in the space. On average, this effect will cancel out: e.g. (to make a simple extreme example) if in a room 1/2 of the air contains all the virus, due to poor mixing, and the other 1/2 contains no virus. Then the people on the first half will have twice the chance of infection, while the people on the other half will have zero chance of infection. So that the average probability of infection will be the same. This holds at low quanta concentrations, relevant for most situations, because the infection model is linear to a very good approximation there. | |
70 | At very high concentrations, then the model is non-linear and such an average will underestimate the risk (but given all the uncertainties in the model, this is a small problem). | |
71 | If you have enough information for a specific situation, you can model one room as several sub-rooms in the estimator. Just one copy of the master sheet per sub-room, each with its particular parameters, and then add the results for the whole room. This will be quite complex in most situations, and in particular airflow patterns in rooms are extremely dependent on the specific room, ventilation pattern, location of occupants etc. but experts and researchers might derive useful information this way. | |
72 | ||
73 | The estimator only considers one space, but what if a person moves through a building, spending time in multiple spaces? | |
74 | Run the estimator for each space, sum the quanta inhaled, and then apply the Wells-Riley infection probability equation (1-exp(-total quanta inhaled)) | |
75 | ||
76 | Are there limitations to the Wells-Riley model formulation? | |
77 | The W-R model can no doubt be made more sophisticated with attention from the scientific community. A possible example is listed below. | |
78 | High exertion activities (HEA) may lead to more efficient infection. Two effects are already accounted for in the model: (a) HEA lead to more respiratory particle exhalation by the infective (which translate to higher quanta emission rates), and (b) also to more virus inhalation by the susceptible due to a higher breathing rate (both effects are already in the model). But a possible third effect is not captured by the model: (c) that the virus in the air is more infective under certain high flow breathing situations. HEA lead to increased breathing velocity and depth of inhalation. Velocity would affect the natural filtration via nose hairs or the upper respiratory tract. Depth of inhalation would determine the amount of quanta inhaled into the recesses of the lungs, versus a shallow breath. A final mechanism is that mouth breathing vs nose breathing may have different risk profiles. This could potentially apply to choirs, and also to singing in a karaoke, or aerobic exercise in a gym. (HT Howard Chong) | |
79 | Conversely, the model does not predict how the severity of the infection may vary with the dose. For COVID-19, there is emerging evidence that the severity of the infection is lower at low doses than at high doses, which is a benefit of wearing masks. See this article which summarizes the science as of mid-July 2020: https://www.latimes.com/california/story/2020-07-21/masks-help-avoid-major-illness-coronavirus | |
80 | The W-R model has been used by a small community for years, while the majority of the infectious diseases field mostly ignored aerosol transmission of diseases. With the intense current focus of the scientific community on this topic, it is very likely that multiple improvements and tweaks to the W-R model will be proposed. However, W-R is the best we have now, and it should capture the first-order effects, given all the uncertainties. | |
81 | ||
82 | Is there a threshold of inhaled quanta below which there is no infection? | |
83 | The Wells-Riley model does not have a threshold in its usual formulation. Simply the probability of infection goes down as the number of quanta inhaled goes down. I am not aware of any evidence of a threshold for COVID-19, so I would not assume that one exists. But if the quanta inhaled is very low, the probability of infection will be very low too. | |
84 | ||
85 | What happens if the infected person leaves after X min, but the susceptible person stays? Or if a 2nd infected person comes in after Y min? | |
86 | This type of model can easily account for those situations. In this case I am choosing to keep things simple, so that they are more understandable. For those with calculus abilities, just follow the derivation of the solution in Miller et al. and you can use equation 3 in there, and stitch together different periods. You can modify the solution for the case of interest there, and then just modify the formula in the spreadsheet. | |
87 | The tool released by Buonnano et al. does include a slightly more complex scenario, so you could try it with that tool. | |
88 | ||
89 | Since the parameters are uncertain, shouldn't the inputs and outputs be represented as probability distributions? | |
90 | Yes. In this model I am choosing to keep things simple so that it is easier to understand. But one could implement a MonteCarlo simulation using the probability distributions of the parameters and the model here. | |
91 | The tool released by Buonnano et al. (based on https://doi.org/10.1016/j.envint.2020.106112) is based on a model which includes this methodology. The first version will not include the MonteCarlo option, but a subsequent version may do so. The tool released by Prasad Kasibhatla does allow performing MonteCarlo simulations, see link below. | |
92 | ||
93 | What level of infection risk is acceptable? | |
94 | First, keep in mind that the uncertainties are high, given that we have limited information about the quanta emissions in particular, and you shouldn't overinterpret the results. If you get 1% for a case, it may really be 0.3% or 4%, but it won't be 0.001% or 100%. | |
95 | Second, which infection risk is tolerable is a question for the people involved, not for me. I.e. we all do activities that involve some risk, and we tolerate it because the risk is low enough compared to the benefit. For example we go places in cars and planes, even though there is a small chance of death or injury by doing those things, because we value the travel more. For example, given the odds of dying in car and airplane travel, we are accepting a risk of 0.00006% and 0.00001% each time we travel respectively (estimated from odds of death from https://www.nsc.org/work-safety/tools-resources/injury-facts/chart, assuming traveling by car 1/2 of the days, by plane 8 times a year, during a 75 yr lifespan). For things like cancer risk, the US EPA uses a chance of 1 in a million (0.0001%) as the limit. Some researchers have suggested that people may be willing tolerate a chance of 1 in 1000 (0.1%) of COVID-19 infection across all their activities (not just one activity which you may simulate with the estimator such as going to class). But you should be the one to determine this for yourself and your situation. | |
96 | ||
97 | Why haven't you included eye protection? | |
98 | We do know that COVID-19 can be transmitted through the eyes. So if virus-laden aerosol particles land on the eyes, infection can result. | |
99 | For this reason we recommend wearing eye protection, such as glasses, goggles, etc. in indoor or crowded outdoor situations. | |
100 | However, there is no information we know of about the relative importance of transmission through inhalation or through the eyes, so it is not possible to quantitatively include the impact of eye protection. The estimator assumes that the inhalation route is dominant. | |
101 | ||
102 | Can I use the estimator to model the time series of infections for the students in my class over an academic year? | |
103 | You would need a more complex model than this one. This is for two reasons: (a) this model only accounts for aerosol transmission, but students may transmit the disease (during school time) through the contact or droplet routes as well, e.g. if distancing is not well followed. (b) most importantly, the students are part of a larger society, they may get COVID-19 outside school, e.g. from a sibling that goes to a different school, their parents, their friends when they interact outside of school or at a party, when they travel out of town etc. So one really needs an epidemiological time series model that approximately accounts for all the interactions in society. This aerosol model addresses a smaller piece, and can perhaps be used to fine-tune some of the parameters that go into epidemiological models. | |
104 | ||
105 | Can I use the estimator to model the transmission of other diseases that have some fraction of aerosol transmission? | |
106 | Yes, the mathematical model is the same. Mainly two parameters change: the quanta emission rate, and the decay rate of the infectious agent. Some quanta emission rates from the literature are below in italics (from https://www.medrxiv.org/content/10.1101/2020.06.15.20132027v2 and references therein). For tuberculosis, the decay rate is ~0. For the other diseases, I would assume the same as for COVID-19 as a first approximation, or search the literature for more accurate rates. | |
107 | Influenza: 15-128 q h-1 | |
108 | Measles: 5580 q h-1 | |
109 | Tuberculosis: 1.25 - 30,480 q h-1 (Decay rate ~ 0) | |
110 | SARS: 28 q h-1 (The decay rate for SARS is very similar than for COVID-19, see: https://www.nejm.org/doi/full/10.1056/nejmc2004973) | |
111 | In reality, much like the COVID-19 quanta emission rate can be quite variable, the same is the case for other diseases. The table below for tuberculosis summarizes several studies, and illustrates the range of variability. Ref: https://www.ingentaconnect.com/content/iuatld/ijtld/2003/00000007/00000011/art00002 | |
112 |  | |
113 | ||
114 | An additional detail is that the particle size distribution containing the infective agents may vary between the different diseases, which in turn will affect the deposition rate (per e.g. https://www.sciencedirect.com/science/article/abs/pii/S1352231002001577). The impact of this uncertainty can be evaluated by varying the deposition rate, see Readme Sheet. | |
115 | ||
116 | FAQs about using CO2 as an indicator of risk | |
117 | This method described in Milton et al. (2003). Since both virus-containing respiratory particles and CO2 are exhaled, high CO2 concentration can be an indicator of potentially high concentration of virus-containing particles. Many researchers have proposed that CO2 sensors be installed with "traffic light" indicators (green / yellow / red) so that occupants can be warned of problems with the ventilation rate, or excessive crowding or duration. | |
118 | The CO2 emission rate is a function of the person's age, gender, and body mass, as well as the level of activity. Find the emission rate relevant to your case in the tables in the Readme page. | |
119 | A tool developed by Dr. Andy Persily of NIST to model CO2 vs. time in indoor spaces can be found here: https://pages.nist.gov/CONTAM-apps/webapps/CO2Tool/#/ It allows comparison with the results of our tool, and exploring the effect of some variables in a graphical way. | |
120 | There are several limitations of this method: (a) the emission of respiratory particles increases mores strongly with talking and singing, while CO2 changes less for those activities (b) masks can filter exhaled respiratory particles but not CO2 (c) the virus loses infectivity while in aerosols, but CO2 is inert and is only lost to ventilation (d) virus-containing particles are deposited to the ground / walls / furniture, and the virus decays in them, while those effect do not happen for CO2 (e) virus-containing particles are only emitted by the infected person, while everyone emits CO2 (f) Cooking or heating with natural gas, propane, wood etc. can emit CO2 which is unrelated to breathing (g) Outdoor CO2 background can decrease due to crop uptake during the growing season in agricultural areas, or increase due to pollution. These changes are generally below +/-50 ppm, and thus are small compared to the range of interest for indoor air quality | |
121 | Some colleagues have recommended to keep indoor CO2 below 600-800 pm to reduce the chance of COVID transmission (per this paper https://onlinelibrary.wiley.com/doi/pdf/10.1111/ina.12639). That sounds like a reasonably low level, although I have not seen a quantitative justification (pls send it my way if you find it). For a more robust result, it is recommended to build a curve of infection risk vs CO2 concentration for your situation of interest. A CO2 sensor can be used to monitor an indoor space. | |
122 | Indoor CO2 sensors with a display are available in the ~$100 range. E.g. https://www.amazon.com/Aranet4-Home-Temperature-Ink-Configuration/dp/B07YY7BH2W and https://www.amazon.com/GZAIR-Temperature-Relative-Mountable-0-5000ppm/dp/B08644N7QD I've reached out to colleagues about recommendations, but that type of sensor is what you would need for an indoor space | |
123 | The global background CO2 concentration increases over time due to fossil fuel burning. The changes are small compared to the changes in indoor levels due to human breath, but for completeness you can look them up here: https://www.esrl.noaa.gov/gmd/ccgg/trends/ | |
124 | ||
125 | FAQs about improvements to this estimator | |
126 | ||
127 | Can you add other outbreaks such as the Guangzhou restaurant or others? | |
128 | Yes. The Guangzhou restaurant has already been analyzed with a similar model by Buonnano et al. (2020b) and can be explained by the model. I will add it here as time allows. For many outbreaks the problem is lack of information on ventilation, which is critical for a quantitative analysis. | |
129 | ||
130 | ||
131 | ||
132 | Are there other models available to try to address this problem? | |
133 | Yes, there are multiple other models. So far all try to do the same thing, estimate room-level transmission (away from "close contact" situations like talking face-to-face at 1-2 m), using a box model for the room, and the Wells-Riley infection model. | |
134 | I am listing here all the models that I know of that are public. There are many more private ones that people are developing, so far all different versions of the same ideas, often customized for a specific situation of interest. If you know of a model that's not listed here, let me know. | |
135 | The model of Buonnano et al. can be downloaded from:https://www.cunybpl.org/resources/airborne-infection-risk-calculator/ The Guangzhou restaurant has already been analyzed with a similar model by Buonnano et al. (2020b) and can be explained by the model. | |
136 | Prof. Prasad Kasibhatla of Duke Univ. has adapted the classroom / campus sheets here to take into account the ranges of uncertainty of the parameters through a MonteCarlo simulation at https://tinyurl.com/yxfd23kr (also a Google Sheet that can be downloaded and run in Excel). His version will be useful for advanced researchers who are familiar with the MonteCarlo technique. If you don't know what that is, stay with my tool. A web version of this tool, specific for classrooms, is posted at http://covid-exposure-modeler-data-devils.cloud.duke.edu/ | |
137 | Alfred Trukenmueller in Germany <alfred.trukenmueller@gmx.de> has developed a similar spreadsheet (in German) based on the Buonnano et al. model. He has made it available at https://www.magentacloud.de/share/e7esxr9ywc | |
138 | M. Evans has submitted paper with a similar model: https://www.medrxiv.org/content/10.1101/2020.05.21.20108894v3 No software is available to our knowledge | |
139 | Prof. Charles Stainer at the Univ. of Iowa has developed a similar tool (developing part of it independently, and adapting the infection model in our tool), into a custom tool for that University. The results are consistent with ours. It is available here: https://www.stanierlab.org/post/covid-19-aerosol-transmission-calculator-customized-to-iowa A news story on their tool is here: https://dailyiowan.com/2020/07/16/university-of-iowa-researchers-use-aerosol-transmission-calculator-assess-classroom-safety/ | |
140 | NIST has also released the FaTIMA model, see next FAQ | |
141 | So far the results of all the models are very similar in the comparisons we have done. Nathan Skinner (Park Street Church, Boston) has compared this model with the Buonnano and Evens models for their case, and found consistent results. If you find any discrepancies let us know. Perfect agreement is not expected due to small differences in the model parameters or structures used. | |
142 | ||
143 | Is your model similar to the FaTIMA model from NIST? | |
144 | FaTIMA is at https://www.nist.gov/services-resources/software/fatima | |
145 | Yes, both tools are trying to address the same problem and using similar physics and experimental results, but do it slightly differently. Both should be useful to those interested | |
146 | FaTIMA currently has more detail on the building and control measures and one can enter those parameters more directly, while in our estimator those are entered as first order rates already. | |
147 | FaTIMA does not include an infection model, however, while our estimator does. So with FATIMA you can estimate relative exposures, but not infection rates. | |
148 | FaTIMA also does not presently include the effect of masks, or of the breathing rate (which varies with activity level) | |
149 | Our estimator has all the equations exposed in the spreadsheet formulas, so it is easier to figure out what's going on. Neither model is that complicated mathematically, but having the code be "open source" may get more people to understand what we are doing, and then potentially incorporate it into other tools etc. Documentation for FaTIMA is at https://doi.org/10.6028/NIST.TN.2095 | |
150 | Due to the format it may be easier for our estimator to expose different cases, classroom, bus, protest, choir... and have them all there as different sheets. This is only about communication, not the model per se. | |
151 | The most important output is to estimate the relative risk of different actions, and that can be done with both tools (except for masks) | |
152 | This specific FAQ was written in 25-Jun-2020. Both tools may evolve in the future. | |
153 | ||
154 | Can I develop my own model or tool, using the information here? | |
155 | This model is distributed under the GNU Public License https://www.gnu.org/licenses/gpl-3.0.en.html | |
156 | You are free to adapt this model in any way that would be useful (as long as you don't charge others for the model itself). That was an important reason to make the tool available in this "open source" way, so that we could demystify aerosol transmission modeling, and so that smart people everywhere could do creative things building on this knowledge. But please make sure that you understand the model well. Importantly, I recommend that you compare ("benchmark") your results of a new tool against those of this tool, but multiple sets of parameters, to gain confidence that the new tool is free of bugs. | |
157 | ||
158 | ||
159 | ||
160 | What do you recommend in terms of masks, face shields etc? | |
161 | Wear the best face mask you can get. N95 / FFP2 are best if you pay attention to fitting it well around your face and closing gaps, but in many countries there is still limited supply, so we shouldn't deplete their availability for health care and other essential workers. But if you already have one, do wear it by all means. Otherwise surgical masks are the next best, followed by cloth masks. Cloth masks can be quite good if fitted well. See this video to understand the fit: https://twitter.com/jljcolorado/status/1280935408398766080 (and don't stand behind someone with a poorly fitted mask). Face shields provide very little protection, see this thread and its references: https://twitter.com/jljcolorado/status/1278691722449481729 | |
162 | In addition, since we do know that COVID-19 can be transmitted through the eyes, wear some eye protection. Ideally some safety glasses that are pretty closed around your eyes, limiting the airflow and thus the potential for aerosols to deposit there (see e.g. https://www.mcmaster.com/safety-glasses/). Prescription safety glasses can be obtained from e.g. https://www.rx-safety.com/shop/master-safety-glasses/prescription-safety-glasses/prescription-safety-glasses-rx-jy7/# (I bought one from them and it is ok). Otherwise regular glasses or sunglasses will help some, but not as much. | |
163 | This precautions are most important indoors away from your home, or outdoors in crowded situations. In less crowded situations outdoors I wear a surgical mask and my regular glasses. | |
164 | ||
165 | I see that ventilation can be used to reduce transmission. What can I do for my specific case? | |
166 | See this article for ideas: https://www.sciencedirect.com/science/article/pii/S0160412020317876 | |
167 | Note that "ventilation" in this context means replacing indoor air with outdoor air. Or potentially filtering indoor air, or subjecting it to germicidal UV light. Moving the air with fans or similar is not "ventilation" but "mixing". It probably hurts by spreading virus-laden particles around faster. It also has a compensating positive effect as the turbulence leads to faster particle deposition to walls and ground. | |
168 | ||
169 | Is a portable HEPA filter unit useful? | |
170 | A portable HEPA filter system is very useful, as it can remove virus particles from the air. These can be used at home or office situations. They do need to be of a size appropriate to the size of the room. If it is a big room, you may need a couple. Units that have been tested and certified by the Assoc of Home Appliance Manufacturers are listed at https://ahamverifide.org Prof. Shelly Miller of CU-Boulder is an expert on this area and has written a blog post about this: https://shellym80304.com/2020/06/15/a-hopefully-helpful-short-report-on-air-cleaners/ You can download her report from that page. The table below is from that report. But there are many more good filters that are not listed on that table. Follow the instructions in Prof. Miller's blog. This one was purchased by a very knowledgeable colleague for her home: https://www.sylvane.com/coway-airmega-300-air-purifier.html You will see for this one that the clean air delivery rate (CADR) is 260, and the units are cubic feet per minute. So divide by the volume of your room, and multiply by 60 min/hour to get the air exchange rate that you are adding to your room by running the air cleaner. | |
171 | See the calculation in the Readme page. | |
172 |  | |
173 | ||
174 | Is reducing the duration of indoor interactions useful? | |
175 | Yes, this is very useful. In principle the number of infectious particles inhaled will increases proportionally to the duration of the event. But it is worse than that: the risk of infection increases more than linearly with the duration of the event. This is because (assuming the air is clean at the start) the infectious particles accumulate in the room, and e.g. the second 30 min. have a higher concentration than the first 30 min. This can be explored with the estimator, change the duration of the event and look at the output vs duration (e.g. in a graph). So we recommend to keep all indoor activities as short as feasible for that activity. | |
176 | ||
177 | Is germicidal UV a good idea? | |
178 | Generally yes, as long as the UV is away from people to avoid serious eye damage, and as long as ozone is not produced. | |
179 | See this webinar from Prof. Shelly Miller about it: https://shellym80304.files.wordpress.com/2020/05/isiaq-guv-2-compiled.pdf | |
180 | New systems using 222 nm light are very promising, as (unlike older systems based on 254 nm light) it seems to be safe for people. See: https://www.nature.com/articles/s41598-020-67211-2 | |
181 | That said, it is being marketed very aggressively by the companies supplying it, and it is not always the most cost-effective solution (purchase, installation, and maintenance are all significant). Improved ventilation and mask wearing should come first. See this paper for an overview of the building-level strategies: https://www.sciencedirect.com/science/article/pii/S0160412020317876 | |
182 | ||
183 | A company is promoting an air cleaning system using ions, plasmas, or OH radicals. Do these systems work? | |
184 | Be very careful with that type of system. They are being promoted very aggressively, but often there is very little detail given about how the system really works. In some cases claims are made that are obviously wrong or suspicious. See this NYT article as an example: https://www.nytimes.com/2020/06/23/us/politics/trump-arizona-church-covid.htm Oxidation systems will turn volatile organic compounds (VOCs) in the air into more oxidized species, NOT into CO2 and water, and the oxidized species and aerosols formed may actually be worse for health than the original VOCs. | |
185 | My group has done extensive research on similar systems, from the point of view of atmospheric chemistry applications, see https://doi.org/10.1039/C9CS00766K. I have not seen a lot of peer-reviewed analyses of the details of these "advanced" cleaning systems. There is one in this paper: https://iopscience.iop.org/article/10.1088/1361-6463/ab1466 | |
186 | ||
187 | ?Tiene recomendaciones en espanol / castellano? | |
188 | Si, leerlas aqui: https://twitter.com/jljcolorado/status/1280516427158560781 | |
189 | ||
190 | ||
191 | ||
192 | How can I learn more about aerosol transmission of COVID-19? | |
193 | I posted a series of 3 threads in Twitter in mid July-2020 with my views at the time. There are many arguments supporting aerosol transmission, and no good arguments against it that I have found (but there are a lot of misunderstandings and errors about aerosols, especially in the medical community). All 3 are linked here: https://twitter.com/jljcolorado/status/1283972530869420035 | |
194 | There are many resources out there. We would recommend starting with the Miller et al. and Buonnano et al. papers (and their references) and Linsey Marr's Twitter feed: https://twitter.com/linseymarr See a profile of Prof. Marr at: https://www.nytimes.com/2020/06/12/well/live/Coronavirus-aerosols-linsey-marr.html | |
195 | Read her tweets from the start of the pandemic starting from now and in reverse chronological order, and you will find links to many many resources, and discussion of many of the important topics | |
196 | ||
197 | Some in the medical community deny that COVID-19 can be transmitted through aerosols. What do you think of this? | |
198 | Aerosol transmission has been controversial, but now Germany (https://www.rki.de/DE/Content/InfAZ/N/Neuartiges_Coronavirus/Steckbrief.html), the UK (https://www.gov.uk/government/publications/review-of-two-metre-social-distancing-guidance), the European CDC (https://www.ecdc.europa.eu/sites/default/files/documents/Ventilation-in-the-context-of-COVID-19.pdf), and the US CDC (describes it without using the name, https://www.cdc.gov/coronavirus/2019-ncov/prevent-getting-sick/prevention.html) have accepted aerosol transmission of COVID-19. WHO has recently shifted its position to allow for the possibility of aerosol transmission. | |
199 | Also REHVA (the European Federation of Heating and Ventilation and Air Conditioning Associations) and ASHRAE (the American Society of Heating, Refrigeration, and Air Conditioning Engineers) have already acknowledged aerosol transmission and recommended measures for their control: https://www.rehva.eu/fileadmin/user_upload/REHVA_COVID-19_guidance_document_ver2_20200403_1.pdf http://ashrae.org/file library/about/position documents/pd_infectiousaerosols_2020.pdf | |
200 | There are 3 ways of transmission: contact / fomite, when a person shakes hands or touches an object that an infected person has touched (and the infected person had virus in their hands from touching their nose, a cough etc.). However this is thought to be unlikely (see this from the US CDC https://www.cdc.gov/coronavirus/2019-ncov/prevent-getting-sick/how-covid-spreads.html ) , in particular because enveloped viruses like SARS-CoV-2 may have trouble surviving on hands though the studies are contradictory (https://pubmed.ncbi.nlm.nih.gov/6282993 https://www.medrxiv.org/content/10.1101/2020.07.01.20144253v1). The second way is droplet transmission, when large ballistic droplets in a cough or sneeze land on the eyes, nostrils, or mouth of another person. And the third is aerosol transmission, when particles smaller than ~50 microns (not 5 um as it is often repeated in error) are inhaled by a health person. The pandemic is likely being driven by asymptomatic or pre-symptomatic spread, and those people don't cough, leaving aerosol transmission as the main likely route. It is also likely being driven by super-spreading events, and those (like the Skagit choir) are very very hard to explain without aerosol transmission. See also the next FAQ. | |
201 | Unfortunately part of the medical community is literally stuck in science from 1910, and is only changing very slowly and with a lot of resistance. Wells in 1934 (https://academic.oup.com/aje/article-abstract/20/3/611/280025) already got it right, but he and others faced extreme resistance to the evidence. For historical / sociological reasons it has been very difficult to change this stance, despite accumulating evidence, including for COVID-19. For example, it is nearly impossible to explain the Skagit Choir case without aerosol transmission. I am part of a group of experts trying to change this, and I am also collaborating with Profs. Linsey Marr and Lydia Bourouiba and two historians on a paper on how things got to be this way historically. But we can't wait for the medical community to change its understanding before we get the pandemic under control. | |
202 | A problem with the WHO committee on disease transmission is that they rely most strongly on evidence from hospitals. That is where a lot of their experts work, and that is where they know the circumstances well. Cases from the community are much more difficult to analyze. They say that if transmission in hospitals is limited even when using surgical masks, therefore it must not go through the air. BUT hospitals have high ventilation, e.g. change the ventilation rate to 12 ACH (typical of hospital) in one of the cases in this model, and transmission goes down dramatically. And everyone is wearing at least surgical masks. And people appear to be more infectious around the onset of disease (when they are in the community) and less when they are very sick in a hospital. And the patients are not talking loudly or singing, they are mostly just breathing, which greatly reduces the quanta emission rate. Therefore it makes a lot of sense that aerosol transmission is limited in hospitals, but it doesn't disprove that it is major in the community. Together with "an anti-aerosol" bias of some critical experts, this partly explains why they are being so slow to accept the risk. | |
203 | ||
204 | WHO does accept that intubation in hospitals creates an aerosol risk, but aerosols are not important otherwise. What do you think? | |
205 | Intubation and similar procedures create huge amounts of aerosols, so transmission can happen even over short times and with high ventilation. It is also easy to detect. As described above in these FAQs, tuberculosis can release 30,000 infectious doses (quanta) per hr during intubation. But 12 doses / hr were enough to cause an outbreak in an office! We think the same is going on with COVID-19: WHO recognizes the obvious intubation source, but ignores that it happens at a much lower level all the time, and with longer times and low ventilation, it does matter. | |
206 | ||
207 | COVID-19 does not have a high reproductive number (R0). Thus can't we rule out that it is transmitted via aerosols? | |
208 | No. This is an argument often made by some in the medical community to argue that COVID-19 is not transmitted by aerosols at all. However the argument is flawed and based on a logic error. The argument is based on the assumption that a disease is either "airborne," and then it will display the high transmission characteristics of measles or chickenpox, or otherwise it is not transmitted by aerosols at all. No intermediate cases are possible. This assumption makes no sense, and there is no basis for it. | |
209 | The reproductive number R0 is not indicative of aerosol transmission. Anthrax or hantavirus (in N. America) are transmitted exclusively through aerosols, but their R0 = 0 for humans (not for other species). I.e. people get it from aerosols produced in other ways, not expired by humans. But after infection, the human respiratory system does not produce any infective aerosols, and person-to-person transmission does not occur. Very high values of R0 (e.g. measles, chickenpox, with well accepted values of 10-15, pers. comm. J. Tang) are indicative of aerosol transmission. Lower values do not rule out less-efficient aerosol transmission.Clearly if R0 can be 15 measles or it can be 0 (hantavirus) for diseases acquired through aerosols, it can be something in between (COVID-19). | |
210 | Different diseases have different fractions and ease of transmission via the aerosol route. For example tuberculosis is only transmitted via aerosols. COVID-19 is transmitted in several ways, including through aerosols. And it is a lot less transmissible than measles or chickenpox through aerosols, but that does not mean that it is not transmissible. We call it "opportunistic airborne" or "aerosol", meaning that it will transmit well through aerosols only under certain conditions: indoors, crowding, low ventilation, long duration (which can be quantified by the estimator), and likely, the presence of a "super-spreader" that emits a high amount of virus particles into the air.There is a lot of evidence to support this, see for example https://www.journalofhospitalinfection.com/article/S0195-6701(20)30245-0/fulltext and https://www.medrxiv.org/content/10.1101/2020.06.15.20132027v1 | |
211 | No. This is an argument often made by some in the medical community to argue that COVID-19 is not transmitted by aerosols at all. However the argument is flawed and based on a logic error. The argument is based on the assumption that a disease is either "airborne," and then it will display the high transmission characteristics of measles or chickenpox, or otherwise it is not transmitted by aerosols at all. No intermediate cases are possible. This assumption makes no sense, and there is no basis for it. | |
212 | This can actually be explored with the estimator. To simulate measles, enter quanta emission rates in the range 5500 q h-1, and you will see that the infection rates are much greater than for typical COVID-19 situations. | |
213 | Tuberculosis is only transmitted through aerosols, but its R0 is difficult to quantify due to latency and other issues. But it can be high depending on the situation. | |
214 | ||
215 | But we are not absolutely certain, so why should we take precautions against aerosol transmission? | |
216 | Because of the precautionary principle: https://en.wikipedia.org/wiki/Precautionary_principle . The cost of doing nothing, if aerosol transmission is happening, is much higher than the cost of doing something, if aerosol transmission ended up being unimportant. Many measures to reduce aerosol transmission, such as reducing indoor crowding, masks etc. also limit other ways of transmission. And remember that absence of (complete) evidence is not evidence of (complete) absence. | |
217 | ||
218 | My question is not here | |
219 | Shoot me an email at <jose.jimenez@colorado.edu> | |
| A | B | C | D | E | F | G | H | |
|---|---|---|---|---|---|---|---|---|
1 | ||||||||
2 | Estimation of COVID-19 aerosol transmission: master spreadsheet, adapt this one to your case - Default values are for Skagit Choir outbreak | |||||||
3 | ||||||||
4 | This is a general spreadsheet applicable to any situation, under the assumptions of this model - See notes specific to this case (if applicable) at the very bottom | |||||||
5 | Important inputs as highlighted in orange - change these for your situation | |||||||
6 | Other, more specialized inputs are highlighted in yellow - change only for more advanced applications | |||||||
7 | Calculations are not highlighted - don't change these unless you are sure you know what you are doing | |||||||
8 | Results are in blue -- these are the numbers of interest for most people | |||||||
9 | ||||||||
10 | Environmental Parameters | |||||||
11 | ||||||||
12 | Value | Value in other units | Source / Comments | |||||
13 | Length of room | 30 | ft | 9.2 | m | Can enter as ft or as m (once entered as m, changing in ft does not work) | ||
14 | Width of room | 60 | ft | = | 18.3 | m | Can enter as ft or as m (once entered as m, changing in ft does not work) | |
15 | 1800 | sq ft | 167 | m2 | Can overwrite the m2 one. If you want to enter sq ft, enter "=B15*0.305^2" in the m2 cell, where B15 is the cell w/ sq ft | |||
16 | Height | 16 | ft | = | 4.8 | m | Can enter as ft or as m (once entered as m, changing in ft does not work) | |
17 | Volume | 810 | m3 | Volume, calculated. (Can also enter directly, then changing dimensions does not work) | ||||
18 | ||||||||
19 | Pressure | 0.95 | atm | Used only for CO2 calculation | ||||
20 | Temperature | 20 | C | Use web converter if needed for F --> C. Used for CO2 calculation, eventually for survival rate of virus | ||||
21 | Relative Humidity | 50 | % | Not yet used, but may eventually be used for survival rate of virus | ||||
22 | Background CO2 Outdoors | 415 | ppm | See readme | ||||
23 | ||||||||
24 | Duration of event | 150 | min | 2.5 | h | Value for your situation of interest | ||
25 | ||||||||
26 | Number of repetitions of event | 1 | times | For e.g. multiple class meetings, multiple commutes in public transportation etc. | ||||
27 | ||||||||
28 | Ventilation w/ outside air | 0.7 | h-1 | Value in h-1: Readme: Same as "air changes per hour". Value in L/s/per to compare to guidelines (e.g. ASHRAE 62.1) | ||||
29 | Decay rate of the virus | 0.62 | h-1 | See Readme, can estimate for a given T, RH, UV from DHS estimator | ||||
30 | Deposition to surfaces | 0.3 | h-1 | Buonnano et al. (2020), Miller et al. (2020). Could vary 0.24-1.5 h-1, depending on particle size range | ||||
31 | Additional control measures | 0 | h-1 | E.g. filtering of recirc. air, HEPA air cleaner, UV disinfection, etc. See FAQs, Readme for calc for portable HEPA filter | ||||
32 | Total first order loss rate | 1.62 | h-1 | Sum of all the first-order rates | ||||
33 | ||||||||
34 | Ventilation rate per person | 2.6 | L/s/person | This is the value of ventilation that really matters for disease transmission. Includes additional control measures | ||||
35 | ||||||||
36 | Parameters related to people and activity in the room | |||||||
37 | ||||||||
38 | Total N people present | 61 | Value for your situation of interest | |||||
39 | Infective people | 1 | person | Keep this at one unless you really want to study a different cases - see conditional and absolute results | ||||
40 | Fraction of population immune | 0% | From vaccination or disease (seroprevalence reports), will depend on each location and time, see Readme | |||||
41 | Susceptible people | 60 | people | Value for your situation of interest | ||||
42 | ||||||||
43 | Density (area / person) in room | 30 | sq ft / person | |||||
44 | Density (people / area) in room | 0.36 | persons / m2 | |||||
45 | Density (volume / person) in room | 13.3 | m3 / person | |||||
46 | ||||||||
47 | Breathing rate (susceptibles) | 1.56 | m3 / h | See Readme sheet - varies a lot with activity level | ||||
48 | Relative breathing rate factor | 5.42 | Ratio between the actual and base breathing rates | |||||
49 | CO2 emission rate (1 person) | 0.0091 | L/s (@ 273 K and 1 atm) | From tables in Readme page. This does not affect infection calculation, only use of CO2 as indicator, could ignore | ||||
50 | CO2 emission rate (all persons) | 0.6271 | L/s (@ at actual P & T of room) | Previous, multiplied by number of people, and applying ideal gas law to convert to ambient P & T | ||||
51 | ||||||||
52 | Basic quanta exhalation rate | 18.6 | infectious doses (quanta) h-1 | See Readme sheet | ||||
53 | Q. enhancement due to variants | 1.0 | Dimensionless | 1 for the original variant, 2 for Delta, 2.5 for Omicron BA.1, 3.3 for Omicron BA.2. See Readme file. | ||||
54 | Q enhancement due to vocal. & act. | 52.2 | Dimensionless (ratio to breathing) | Relative increase in emission rate due to vocalization and physical activity (compared to breathing) | ||||
55 | Quanta exhalation rate (infected) | 970.0 | infectious doses (quanta) h-1 | This is a result. Change the previous row if you want to experiment with the quanta emission rate | ||||
56 | ||||||||
57 | Exhalation mask efficiency | 0% | 0 if infective person is not wearing a mask. See Readme sheet | |||||
58 | Fraction of people w/ masks | 0% | Value for your situation. It is applied to everybody for both emission & inhalation. Modify formulas manually if needed | |||||
59 | Inhalation mask efficiency | 0% | See Readme sheet | |||||
60 | ||||||||
61 | Parameters related to the COVID-19 disease | |||||||
62 | ||||||||
63 | Probability of being infective | 0.011% | Very important parameter, specific for each region and time period. For ABSOLUTE results (prob. given prevalence of disease in the population). See Readme sheet | |||||
64 | ||||||||
65 | Hospitalization rate | 20% | From news reports. Varies strongly with age and risk factors | |||||
66 | Death rate | 4% | From news reports. Varies strongly with age and risk factors (1% typical - Higher for older / at risk people) | |||||
67 | ||||||||
68 | CONDITIONAL result for ONE EVENT: we assume the number of infected people above, and get the results under that assumption | |||||||
69 | More appropriate to simulate known outbreaks (e.g. choir, restaurant etc.), and an worst-case scenario for regular events (if one is unlucky enough to have infective people in attendance of a given event) | |||||||
70 | ||||||||
71 | Net emission rate | 969.99 | infectious doses (quanta) h-1 | Includes the number of infective people present | ||||
72 | Avg Quanta Concentration | 0.56 | infectious doses (quanta) m-3 | Analytical solution of the box model. Equation (4) in Miller et al. (2020) | ||||
73 | Quanta inhaled per person | 2.18 | infectious doses (quanta) | |||||
74 | ||||||||
75 | Conditional Results for A GIVEN PERSON & ONE EVENT (assuming number of infected above, typically 1) | |||||||
76 | Probability of infection (1 person) | 88.7% | Applying Wells-Riley infection model to the amount of infectious doses inhaled. Equation (1) in Miller et al. (2020) | |||||
77 | Prob. of hospitalization (1 person) | 17.7% | ||||||
78 | Prob. of death (1 person) | 3.5% | ||||||
79 | Ratio to risk of car travel death | 59157 | times larger risk | See FAQs for rough estimate of death traveling by car on a given day | ||||
80 | ||||||||
81 | Conditional Results for ALL ATTENDEES & ONE EVENT (assuming number of infected above, typically 1) | |||||||
82 | Number of COVID cases arising | 53.24 | Number of people. Multiplies probability of one person, times the number of susceptible people present | |||||
83 | N of hospitalizations arising | 10.65 | Number of people | |||||
84 | N of deaths arising | 2.13 | Number of people | |||||
85 | ||||||||
86 | Airborne Infection Risk Parameters (From Peng et al., 2022) | |||||||
87 | Infection Risk Parameter (H) | 24.46 | h2 person / m3 | Indicator of risk in terms of OUTBREAK SIZE. Low risk: H<0.05; Med: H<0.5; High: H>0.5; From Peng et al. (2022) | ||||
88 | Relative Inf. risk Parameter (Hr) | 0.408 | h2 / m3 | Indicator of risk in terms of ATTACK RATE. Low risk: Hr< 0.001; Med< 0.01; High>0.01 From Peng et al. (2022) | ||||
89 | ||||||||
90 | Results for CO2 as an indicator of risk (not needed for infection estimation, can ignore for simplicity) | |||||||
91 | Avg CO2 mixing ratio | 2517 | ppm (including 400 ppm background) | Analytical solution of the box model. Equation (4) in Miller et al. (2020). See FAQ page for differences w/ quanta calc | ||||
92 | Avg CO2 concentration | 3.65 | g m-3 (excluding 400 ppm background) | Conversion from Atmos. Chem. Cheat Sheet, plus ideal gas law | ||||
93 | Exhaled CO2 re-inhaled per person | 14.25 | grams (excluding 400 ppm background) | This parameter is the most analogous to risk. See FAQ page for limitations | ||||
94 | Exhaled CO2 re-inhaled per person | 5254.52 | ppm * h (maybe easier units, excludes 400 ppm background) | This parameter is the most analogous to risk. See FAQ page for limitations | ||||
95 | Exhaled CO2 re-inhaled per person | 0.5255 | %CO2 * h (same as above, different unit, for use next) | |||||
96 | Ratio of prob of infection to Ex_CO2 | 1.689 | % chance of infection for 1 person per %CO2 * h inhaled | |||||
97 | CO2 to inhale 1 hr for 1% infect. | 474 | ppm | This is another metric of risk | ||||
98 | ||||||||
99 | ABSOLUTE result for ONE EVENT: we use the prevalence of the disease in the community to estimate how many infected people may be present in our event, and calculate results based on that | |||||||
100 | More appropriate for general risk estimation, e.g. in a college classroom, indoor gathering etc., where often infective people will not be present | |||||||
101 | ||||||||
102 | N of infective people present | 0.007 | It has to be interpreted statistically. This would be the average over e.g. 100 repetitions of the event in a given location | |||||
103 | ||||||||
104 | Absolute results for A GIVEN PERSON & ONE EVENT (using disease prevalence in community) | |||||||
105 | Probability of infection (1 person) | 0.58% | ||||||
106 | Prob. of hospitalization (1 person) | 0.12% | ||||||
107 | Prob. of death (1 person) | 0.02% | ||||||
108 | Ratio to risk of car travel death | 384 | times larger risk | See FAQs for rough estimate of death traveling by car on a given day | ||||
109 | ||||||||
110 | Absolute results for ALL ATTENDEES & ONE EVENT (using disease prevalence in community) | |||||||
111 | Number of COVID cases arising | 0.35 | Number of people | |||||
112 | N of hospitalizations arising | 0.07 | Number of people | |||||
113 | N of deaths arising | 0.01 | Number of people | |||||
114 | ||||||||
115 | CO2 to inhale 1 hr for 1% infect. | 9549 | ppm | This is another metric of risk | ||||
116 | ||||||||
117 | ABSOLUTE result for events that are REPEATED MULTIPLE TIMES (e.g. many class meetings during a semester, or a daily commute on public transportation) - Ignore for a single event | |||||||
118 | ||||||||
119 | Absolute results for A GIVEN PERSON & MULTIPLE EVENTS (using disease prevalence in community) | |||||||
120 | Probability of infection (1 person) | 0.58% | ||||||
121 | Prob. of hospitalization (1 person) | 0.12% | ||||||
122 | Prob. of death (1 person) | 0.02% | ||||||
123 | Ratio to risk of car travel death | 384 | times larger risk (than traveling same N of days) | See FAQs for rough estimate of death traveling by car on a given day | ||||
124 | ||||||||
125 | Absolute results for ALL ATTENDEES & MULTIPLE EVENTS (using disease prevalence in community) | |||||||
126 | Number of COVID cases arising | 0.35 | Number of people | |||||
127 | N of hospitalizations arising | 0.07 | Number of people | |||||
128 | N of deaths arising | 0.01 | Number of people | |||||
129 | ||||||||
130 | Specific notes for this case | |||||||
131 | Probability of death is set higher because of the higher age of choir members (75% of those ill were >= 65 yr old). Suggest changing to 1% for general applications | |||||||
132 | Probability of being infective calculated from prevalence of the disease in the county at the time (7 cases * 2 to account for undetected cases / 129000 population of county), see Miller et al. 2020 |
| A | B | C | D | E | F | G | H | I | J | |
|---|---|---|---|---|---|---|---|---|---|---|
1 | ||||||||||
2 | Table for infection risk of different activities | |||||||||
3 | Based on Peng et al. (2022). See paper for details. | |||||||||
4 | Quantifying the original qualitative table published by Jones et al., BMJ (2020) | |||||||||
5 | Shorcut to this sheet: http://tinyurl.com/covid-tables | |||||||||
6 | ||||||||||
7 | Absolute quanta emission factor (breathing) | Ventilation rate | ||||||||
8 | Silent & sedentary | 18.6 | q/h | Outdoor and well ventilated | 300 | ACH | ||||
9 | Indoor and well ventilated | 6 | ACH | |||||||
10 | Quanta emission enhancement by variants | Poorly ventilated | 1 | ACH | ||||||
11 | See note below (*) | 3.3 | ||||||||
12 | Face coverings | |||||||||
13 | Relative quanta emission factor | Exhalation filtration efficiency | 50% | |||||||
14 | Silent | 1 | Inhalation filtration efficiency | 30% | ||||||
15 | Speaking | 5 | ||||||||
16 | Shouting, singing | 30 | Contact time | |||||||
17 | Heavy exercise | 7 | Short | 1 | h | |||||
18 | Long | 10 | h | |||||||
19 | Base breathing rate | |||||||||
20 | Sedentary | 0.288 | m3/h | Effective volume | ||||||
21 | Indoor | 300 | m3 | |||||||
22 | Relative breathing rate factor | Outdoor | 300 | m3 | ||||||
23 | Silent | 1 | ||||||||
24 | Speaking | 1 | Calculation of Outdoor Equivalent Vent. Rate | |||||||
25 | Shouting, singing | 1 | Height | 2 | m | |||||
26 | Heavy exercise | 10 | Linear dimension | 12 | m | |||||
27 | Wind speed | 1 | m/s | |||||||
28 | Low occupancy | 10 | persons | 294 | ACH | Use above | ||||
29 | High occupancy | 35 | persons | |||||||
30 | ||||||||||
31 | (*) Multiplier accounting for transmissibility of a variant relative to the wild-type variant | |||||||||
32 | (1 for wild type; ~1.5 for Alpha; ~2 for Delta; ~2.5 and ~3.3 as our first estimates (highly uncertain) for Omicron BA.1 and BA.2, respectively) | |||||||||
33 | Note that the variant transmissibility factor only impacts Table 3. See Peng et al. (2022) to understand Tables 1 & 2 | |||||||||
34 | ||||||||||
35 | Table version 1: based on values of risk parameter H compared to literature outbreaks | |||||||||
36 | ||||||||||
37 | Table reporting values of infection risk parameter (in h2 person/m3) | |||||||||
38 | Type and level of group activity | Low occupancy | High occupancy | |||||||
39 | Outdoor and well ventilated | Indoor and well ventilated | Poorly ventilated | Outdoor and well ventilated | Indoor and well ventilated | Poorly ventilated | ||||
40 | ||||||||||
41 | Wear face coverings, contact for short time | |||||||||
42 | Silent | 3.88E-05 | 1.62E-03 | 4.29E-03 | 1.36E-04 | 5.67E-03 | 1.50E-02 | |||
43 | Speaking | 1.94E-04 | 8.11E-03 | 2.15E-02 | 6.78E-04 | 2.84E-02 | 7.51E-02 | |||
44 | Shouting, singing | 1.16E-03 | 4.86E-02 | 1.29E-01 | 4.07E-03 | 1.70E-01 | 4.51E-01 | |||
45 | Heavy exercise | 2.71E-03 | 1.13E-01 | 3.00E-01 | 9.50E-03 | 3.97E-01 | 1.05E+00 | |||
46 | Wear face coverings, contact for prolonged time | |||||||||
47 | Silent | 3.89E-04 | 1.91E-02 | 1.05E-01 | 1.36E-03 | 6.69E-02 | 3.68E-01 | |||
48 | Speaking | 1.94E-03 | 9.56E-02 | 5.25E-01 | 6.80E-03 | 3.35E-01 | 1.84E+00 | |||
49 | Shouting, singing | 1.17E-02 | 5.74E-01 | 3.15E+00 | 4.08E-02 | 2.01E+00 | 1.10E+01 | |||
50 | Heavy exercise | 2.72E-02 | 1.34E+00 | 7.35E+00 | 9.52E-02 | 4.68E+00 | 2.57E+01 | |||
51 | No face coverings, contact for short time | |||||||||
52 | Silent | 1.11E-04 | 4.63E-03 | 1.23E-02 | 3.88E-04 | 1.62E-02 | 4.29E-02 | |||
53 | Speaking | 5.54E-04 | 2.32E-02 | 6.13E-02 | 1.94E-03 | 8.11E-02 | 2.15E-01 | |||
54 | Shouting, singing | 3.32E-03 | 1.39E-01 | 3.68E-01 | 1.16E-02 | 4.86E-01 | 1.29E+00 | |||
55 | Heavy exercise | 7.75E-03 | 3.24E-01 | 8.58E-01 | 2.71E-02 | 1.13E+00 | 3.00E+00 | |||
56 | No face coverings, contact for prolonged time | |||||||||
57 | Silent | 1.11E-03 | 5.46E-02 | 3.00E-01 | 3.89E-03 | 1.91E-01 | 1.05E+00 | |||
58 | Speaking | 5.55E-03 | 2.73E-01 | 1.50E+00 | 1.94E-02 | 9.56E-01 | 5.25E+00 | |||
59 | Shouting, singing | 3.33E-02 | 1.64E+00 | 9.00E+00 | 1.17E-01 | 5.74E+00 | 3.15E+01 | |||
60 | Heavy exercise | 7.78E-02 | 3.82E+00 | 2.10E+01 | 2.72E-01 | 1.34E+01 | 7.35E+01 | |||
61 | Note: background color is based on initial Wuhan variant. Risk increases for Delta and Omicron variants (see Table 3) | |||||||||
62 | ||||||||||
63 | Table version 2: maximum time till risk of outbreak | |||||||||
64 | ||||||||||
65 | Table reporting contact times (in h) corresponding to an infection risk parameter value of 0.05 | |||||||||
66 | Type and level of group activity | Low occupancy | High occupancy | |||||||
67 | Outdoor and well ventilated | Indoor and well ventilated | Poorly ventilated | Outdoor and well ventilated | Indoor and well ventilated | Poorly ventilated | ||||
68 | ||||||||||
69 | Wear face coverings | |||||||||
70 | Silent | 1,290.01 | 30.84 | 11.65 | 368.58 | 8.81 | 3.33 | |||
71 | Speaking | 258.00 | 6.17 | 2.33 | 73.72 | 1.76 | 0.67 | |||
72 | Shouting, singing | 43.00 | 1.03 | 0.39 | 12.29 | 0.29 | 0.11 | |||
73 | Heavy exercise | 18.43 | 0.44 | 0.17 | 5.27 | 0.13 | 0.05 | |||
74 | No face coverings | |||||||||
75 | Silent | 451.51 | 10.79 | 4.08 | 129.00 | 3.08 | 1.16 | |||
76 | Speaking | 90.30 | 2.16 | 0.82 | 25.80 | 0.62 | 0.23 | |||
77 | Shouting, singing | 15.05 | 0.36 | 0.14 | 4.30 | 0.10 | 0.04 | |||
78 | Heavy exercise | 6.45 | 0.15 | 0.06 | 1.84 | 0.04 | 0.02 | |||
79 | Note: background color is based on initial Wuhan variant. Risk increases for Delta and Omicron variants (see Table 3) | |||||||||
80 | ||||||||||
81 | Table version 3: estimated attack rates (% of people present infected) - Depends on disease prevalence | |||||||||
82 | ||||||||||
83 | Table reporting predicted attack rates | |||||||||
84 | Fraction of infectious people in local population | 0.10% | ||||||||
85 | Type and level of group activity | Low occupancy | High occupancy | |||||||
86 | Outdoor and well ventilated | Indoor and well ventilated | Poorly ventilated | Outdoor and well ventilated | Indoor and well ventilated | Poorly ventilated | ||||
87 | ||||||||||
88 | Wear face coverings, contact for short time | |||||||||
89 | Silent | 0.00% | 0.00% | 0.01% | 0.00% | 0.01% | 0.03% | |||
90 | Speaking | 0.00% | 0.01% | 0.03% | 0.00% | 0.05% | 0.13% | |||
91 | Shouting, singing | 0.00% | 0.07% | 0.18% | 0.01% | 0.28% | 0.69% | |||
92 | Heavy exercise | 0.00% | 0.16% | 0.37% | 0.02% | 0.62% | 1.39% | |||
93 | Wear face coverings, contact for prolonged time | |||||||||
94 | Silent | 0.00% | 0.03% | 0.15% | 0.00% | 0.11% | 0.57% | |||
95 | Speaking | 0.00% | 0.14% | 0.54% | 0.01% | 0.53% | 2.04% | |||
96 | Shouting, singing | 0.02% | 0.57% | 0.89% | 0.07% | 2.14% | 3.33% | |||
97 | Heavy exercise | 0.04% | 0.81% | 0.90% | 0.16% | 3.04% | 3.34% | |||
98 | No face coverings, contact for short time | |||||||||
99 | Silent | 0.00% | 0.01% | 0.02% | 0.00% | 0.03% | 0.07% | |||
100 | Speaking | 0.00% | 0.04% | 0.09% | 0.00% | 0.14% | 0.35% | |||
101 | Shouting, singing | 0.01% | 0.20% | 0.43% | 0.02% | 0.74% | 1.61% | |||
102 | Heavy exercise | 0.01% | 0.39% | 0.70% | 0.05% | 1.47% | 2.62% | |||
103 | No face coverings, contact for prolonged time | |||||||||
104 | Silent | 0.00% | 0.08% | 0.37% | 0.01% | 0.31% | 1.39% | |||
105 | Speaking | 0.01% | 0.34% | 0.83% | 0.03% | 1.29% | 3.11% | |||
106 | Shouting, singing | 0.05% | 0.85% | 0.90% | 0.19% | 3.16% | 3.34% | |||
107 | Heavy exercise | 0.12% | 0.90% | 0.90% | 0.44% | 3.34% | 3.34% | |||
| A | B | C | D | E | F | G | H | |
|---|---|---|---|---|---|---|---|---|
1 | ||||||||
2 | Estimation of COVID-19 aerosol transmission: master spreadsheet, adapt this one to your case - Default values are for Skagit Choir outbreak | |||||||
3 | ||||||||
4 | This is a general spreadsheet applicable to any situation, under the assumptions of this model - See notes specific to this case (if applicable) at the very bottom | |||||||
5 | Important inputs as highlighted in orange - change these for your situation | |||||||
6 | Other, more specialized inputs are highlighted in yellow - change only for more advanced applications | |||||||
7 | Calculations are not highlighted - don't change these unless you are sure you know what you are doing | |||||||
8 | Results are in blue -- these are the numbers of interest for most people | |||||||
9 | ||||||||
10 | Environmental Parameters | |||||||
11 | ||||||||
12 | Value | Value in other units | Source / Comments | |||||
13 | Length of room | 25 | ft | 7.6 | m | Can enter as ft or as m (once entered as m, changing in ft does not work) | ||
14 | Width of room | 20 | ft | = | 6.1 | m | Can enter as ft or as m (once entered as m, changing in ft does not work) | |
15 | 500 | sq ft | 47 | m2 | Can overwrite the m2 one. If you want to enter sq ft, enter "=B15*0.305^2" in the m2 cell, where B15 is the cell w/ sq ft | |||
16 | Height | 10 | ft | = | 3.1 | m | Can enter as ft or as m (once entered as m, changing in ft does not work) | |
17 | Volume | 142 | m3 | Volume, calculated. (Can also enter directly, then changing dimensions does not work) | ||||
18 | ||||||||
19 | Pressure | 0.95 | atm | Used only for CO2 calculation | ||||
20 | Temperature | 20 | C | Use web converter if needed for F --> C. Used for CO2 calculation, eventually for survival rate of virus | ||||
21 | Relative Humidity | 50 | % | Not yet used, but may eventually be used for survival rate of virus | ||||
22 | Background CO2 Outdoors | 415 | ppm | See readme | ||||
23 | ||||||||
24 | Duration of event | 50 | min | 0.8 | h | Value for your situation of interest | ||
25 | ||||||||
26 | Number of repetitions of event | 180 | times | For e.g. multiple class meetings, multiple commutes in public transportation etc. | ||||
27 | ||||||||
28 | Ventilation w/ outside air | 3 | h-1 | Value in h-1: Readme: Same as "air changes per hour". Value in L/s/per to compare to guidelines (e.g. ASHRAE 62.1) | ||||
29 | Decay rate of the virus | 0.62 | h-1 | See Readme, can estimate for a given T, RH, UV from DHS estimator | ||||
30 | Deposition to surfaces | 0.3 | h-1 | Buonnano et al. (2020), Miller et al. (2020). Could vary 0.24-1.5 h-1, depending on particle size range | ||||
31 | Additional control measures | 0 | h-1 | E.g. filtering of recirc. air, HEPA air cleaner, UV disinfection, etc. See FAQs, Readme for calc for portable HEPA filter | ||||
32 | Total first order loss rate | 3.92 | h-1 | Sum of all the first-order rates | ||||
33 | ||||||||
34 | Ventilation rate per person | 11.8 | L/s/person | This is the value of ventilation that really matters for disease transmission. Includes additional control measures | ||||
35 | ||||||||
36 | Parameters related to people and activity in the room | |||||||
37 | ||||||||
38 | Total N people present | 10 | Value for your situation of interest | |||||
39 | Infective people | 1 | person | Keep this at one unless you really want to study a different cases - see conditional and absolute results | ||||
40 | Fraction of population immune | 0% | From vaccination or disease (seroprevalence reports), will depend on each location and time, see Readme | |||||
41 | Susceptible people | 9 | people | Value for your situation of interest | ||||
42 | ||||||||
43 | Density (area / person) in room | 50 | sq ft / person | |||||
44 | Density (people / area) in room | 0.21 | persons / m2 | |||||
45 | Density (volume / person) in room | 14.2 | m3 / person | |||||
46 | ||||||||
47 | Breathing rate (susceptibles) | 0.52 | m3 / h | See Readme sheet - varies a lot with activity level | ||||
48 | Relative breathing rate factor | 1.79 | Ratio between the actual and base breathing rates | |||||
49 | CO2 emission rate (1 person) | 0.005 | L/s (@ 273 K and 1 atm) | From tables in Readme page. This does not affect infection calculation, only use of CO2 as indicator, could ignore | ||||
50 | CO2 emission rate (all persons) | 0.0565 | L/s (@ at actual P & T of room) | Previous, multiplied by number of people, and applying ideal gas law to convert to ambient P & T | ||||
51 | ||||||||
52 | Basic quanta exhalation rate | 18.6 | infectious doses (quanta) h-1 | See Readme sheet | ||||
53 | Q. enhancement due to variants | 2.5 | Dimensionless | 1 for the original variant, 2 for Delta, 2.5 for Omicron BA.1, 3.3 for Omicron BA.2. See Readme file. | ||||
54 | Q enhancement due to vocal. & act. | 1.3 | Dimensionless (ratio to breathing) | Relative increase in emission rate due to vocalization and physical activity (compared to breathing) | ||||
55 | Quanta exhalation rate (infected) | 60.5 | infectious doses (quanta) h-1 | This is a result. Change the previous row if you want to experiment with the quanta emission rate | ||||
56 | ||||||||
57 | Exhalation mask efficiency | 50% | 0 if infective person is not wearing a mask. See Readme sheet | |||||
58 | Fraction of people w/ masks | 100% | Value for your situation. It is applied to everybody for both emission & inhalation. Modify formulas manually if needed | |||||
59 | Inhalation mask efficiency | 30% | See Readme sheet | |||||
60 | ||||||||
61 | Parameters related to the COVID-19 disease | |||||||
62 | ||||||||
63 | Probability of being infective | 0.20% | Very important parameter, specific for each region and time period. For ABSOLUTE results (prob. given prevalence of disease in the population). See Readme sheet | |||||
64 | ||||||||
65 | Hospitalization rate | 10% | From news reports. Varies strongly with age and risk factors | |||||
66 | Death rate | 1% | From news reports. Varies strongly with age and risk factors (1% typical - Higher for older / at risk people) | |||||
67 | ||||||||
68 | CONDITIONAL result for ONE EVENT: we assume the number of infected people above, and get the results under that assumption | |||||||
69 | More appropriate to simulate known outbreaks (e.g. choir, restaurant etc.), and an worst-case scenario for regular events (if one is unlucky enough to have infective people in attendance of a given event) | |||||||
70 | ||||||||
71 | Net emission rate | 30.23 | infectious doses (quanta) h-1 | Includes the number of infective people present | ||||
72 | Avg Quanta Concentration | 0.04 | infectious doses (quanta) m-3 | Analytical solution of the box model. Equation (4) in Miller et al. (2020) | ||||
73 | Quanta inhaled per person | 0.01 | infectious doses (quanta) | |||||
74 | ||||||||
75 | Conditional Results for A GIVEN PERSON & ONE EVENT (assuming number of infected above, typically 1) | |||||||
76 | Probability of infection (1 person) | 1.15% | Applying Wells-Riley infection model to the amount of infectious doses inhaled. Equation (1) in Miller et al. (2020) | |||||
77 | Prob. of hospitalization (1 person) | 0.1% | ||||||
78 | Prob. of death (1 person) | 0.011% | ||||||
79 | Ratio to risk of car travel death | 191 | times larger risk | See FAQs for rough estimate of death traveling by car on a given day | ||||
80 | ||||||||
81 | Conditional Results for ALL ATTENDEES & ONE EVENT (assuming number of infected above, typically 1) | |||||||
82 | Number of COVID cases arising | 0.10 | Number of people. Multiplies probability of one person, times the number of susceptible people present | |||||
83 | N of hospitalizations arising | 0.01 | Number of people | |||||
84 | N of deaths arising | 0.00 | Number of people | |||||
85 | ||||||||
86 | Airborne Infection Risk Parameters (From Peng et al., 2022) | |||||||
87 | Infection Risk Parameter (H) | 0.01 | h2 person / m3 | Indicator of risk in terms of OUTBREAK SIZE. Low risk: H<0.05; Med: H<0.5; High: H>0.5; From Peng et al. (2022) | ||||
88 | Relative Inf. risk Parameter (Hr) | 0.001 | h2 / m3 | Indicator of risk in terms of ATTACK RATE. Low risk: Hr< 0.001; Med< 0.01; High>0.01 From Peng et al. (2022) | ||||
89 | ||||||||
90 | Results for CO2 as an indicator of risk (not needed for infection estimation, can ignore for simplicity) | |||||||
91 | Avg CO2 mixing ratio | 717 | ppm (including 400 ppm background) | Analytical solution of the box model. Equation (4) in Miller et al. (2020). See FAQ page for differences w/ quanta calc | ||||
92 | Avg CO2 concentration | 0.53 | g m-3 (excluding 400 ppm background) | Conversion from Atmos. Chem. Cheat Sheet, plus ideal gas law | ||||
93 | Exhaled CO2 re-inhaled per person | 0.23 | grams (excluding 400 ppm background) | This parameter is the most analogous to risk. See FAQ page for limitations | ||||
94 | Exhaled CO2 re-inhaled per person | 251.97 | ppm * h (maybe easier units, excludes 400 ppm background) | This parameter is the most analogous to risk. See FAQ page for limitations | ||||
95 | Exhaled CO2 re-inhaled per person | 0.0252 | %CO2 * h (same as above, different unit, for use next) | |||||
96 | Ratio of prob of infection to Ex_CO2 | 0.455 | % chance of infection for 1 person per %CO2 * h inhaled | |||||
97 | CO2 to inhale 1 hr for 1% infect. | 635 | ppm | This is another metric of risk | ||||
98 | ||||||||
99 | ABSOLUTE result for ONE EVENT: we use the prevalence of the disease in the community to estimate how many infected people may be present in our event, and calculate results based on that | |||||||
100 | More appropriate for general risk estimation, e.g. in a college classroom, indoor gathering etc., where often infective people will not be present | |||||||
101 | ||||||||
102 | N of infective people present | 0.020 | It has to be interpreted statistically. This would be the average over e.g. 100 repetitions of the event in a given location | |||||
103 | ||||||||
104 | Absolute results for A GIVEN PERSON & ONE EVENT (using disease prevalence in community) | |||||||
105 | Probability of infection (1 person) | 0.02% | 0.0002065542937 | |||||
106 | Prob. of hospitalization (1 person) | 0.00% | ||||||
107 | Prob. of death (1 person) | 0.00% | ||||||
108 | Ratio to risk of car travel death | 3 | times larger risk | See FAQs for rough estimate of death traveling by car on a given day | ||||
109 | ||||||||
110 | Absolute results for ALL ATTENDEES & ONE EVENT (using disease prevalence in community) | |||||||
111 | Number of COVID cases arising | 0.00 | Number of people | |||||
112 | N of hospitalizations arising | 0.00 | Number of people | |||||
113 | N of deaths arising | 0.00 | Number of people | |||||
114 | ||||||||
115 | CO2 to inhale 1 hr for 1% infect. | 12614 | ppm | This is another metric of risk | ||||
116 | ||||||||
117 | ABSOLUTE result for events that are REPEATED MULTIPLE TIMES (e.g. many class meetings during a semester, or a daily commute on public transportation) - Ignore for a single event | |||||||
118 | ||||||||
119 | Absolute results for A GIVEN PERSON & MULTIPLE EVENTS (using disease prevalence in community) | |||||||
120 | Probability of infection (1 person) | 3.65% | ||||||
121 | Prob. of hospitalization (1 person) | 0.37% | ||||||
122 | Prob. of death (1 person) | 0.04% | ||||||
123 | Ratio to risk of car travel death | 3 | times larger risk (than traveling same N of days) | See FAQs for rough estimate of death traveling by car on a given day | ||||
124 | ||||||||
125 | Absolute results for ALL ATTENDEES & MULTIPLE EVENTS (using disease prevalence in community) | |||||||
126 | Number of COVID cases arising | 0.33 | Number of people | |||||
127 | N of hospitalizations arising | 0.03 | Number of people | |||||
128 | N of deaths arising | 0.00 | Number of people | |||||
129 | ||||||||
130 | Specific notes for this case | |||||||
131 | Breathing rate | |||||||
132 | Using 1/2 of sedentary and light activity, 16-21 yrs old as default. BR only matters for susceptible. To study transmission from students to teacher, need to increase this value accordingly. | |||||||
133 | To study transmission to young children, BR also needs to be adjusted according to Readme table | |||||||
134 | Quanta emission rate | |||||||
135 | Current value is for a teacher talking a lot | |||||||
136 | For teenagers, use values from readme, according to activity | |||||||
137 | Small children are thought to be less contagious, and also breathe less air, so perhaps reduce the quanta emission rate by x5 |
| A | B | C | D | E | F | G | H | |
|---|---|---|---|---|---|---|---|---|
1 | ||||||||
2 | Estimation of COVID-19 aerosol transmission: case of a subway car (specific to a given city) | |||||||
3 | ||||||||
4 | This is a general spreadsheet applicable to any situation, under the assumptions of this model - See notes specific to this case (if applicable) at the very bottom | |||||||
5 | Important inputs as highlighted in orange - change these for your situation | |||||||
6 | Other, more specialized inputs are highlighted in yellow - change only for more advanced applications | |||||||
7 | Calculations are not highlighted - don't change these unless you are sure you know what you are doing | |||||||
8 | Results are in blue -- these are the numbers of interest for most people | |||||||
9 | ||||||||
10 | Environmental Parameters | |||||||
11 | ||||||||
12 | Value | Value in other units | Source / Comments | |||||
13 | Length of room | 44 | ft | 13.4 | m | Can enter as ft or as m (once entered as m, changing in ft does not work) | ||
14 | Width of room | 10 | ft | = | 3.1 | m | Can enter as ft or as m (once entered as m, changing in ft does not work) | |
15 | 440 | sq ft | 41 | m2 | Can overwrite the m2 one. If you want to enter sq ft, enter "=B15*0.305^2" in the m2 cell, where B15 is the cell w/ sq ft | |||
16 | Height | 12 | ft | = | 3.7 | m | Can enter as ft or as m (once entered as m, changing in ft does not work) | |
17 | Volume | 150 | m3 | Volume, calculated. (Can also enter directly, then changing dimensions does not work) | ||||
18 | ||||||||
19 | Pressure | 0.95 | atm | Used only for CO2 calculation | ||||
20 | Temperature | 20 | C | Use web converter if needed for F --> C. Used for CO2 calculation, eventually for survival rate of virus | ||||
21 | Relative Humidity | 50 | % | Not yet used, but may eventually be used for survival rate of virus | ||||
22 | Background CO2 Outdoors | 415 | ppm | See readme | ||||
23 | ||||||||
24 | Duration of event | 20 | min | 0.3 | h | Value for your situation of interest | ||
25 | ||||||||
26 | Number of repetitions of event | 60 | times | For e.g. multiple class meetings, multiple commutes in public transportation etc. | ||||
27 | ||||||||
28 | Ventilation w/ outside air | 5.7 | h-1 | Value in h-1: Readme: Same as "air changes per hour". Value in L/s/per to compare to guidelines (e.g. ASHRAE 62.1) | ||||
29 | Decay rate of the virus | 0.62 | h-1 | See Readme, can estimate for a given T, RH, UV from DHS estimator | ||||
30 | Deposition to surfaces | 0.3 | h-1 | Buonnano et al. (2020), Miller et al. (2020). Could vary 0.24-1.5 h-1, depending on particle size range | ||||
31 | Additional control measures | 3.6 | h-1 | E.g. filtering of recirc. air, HEPA air cleaner, UV disinfection, etc. See FAQs, Readme for calc for portable HEPA filter | ||||
32 | Total first order loss rate | 10.22 | h-1 | Sum of all the first-order rates | ||||
33 | ||||||||
34 | Ventilation rate per person | 11.1 | L/s/person | This is the value of ventilation that really matters for disease transmission. Includes additional control measures | ||||
35 | ||||||||
36 | Parameters related to people and activity in the room | |||||||
37 | ||||||||
38 | Total N people present | 35 | Value for your situation of interest | |||||
39 | Infective people | 1 | person | Keep this at one unless you really want to study a different cases - see conditional and absolute results | ||||
40 | Fraction of population immune | 15% | From vaccination or disease (seroprevalence reports), will depend on each location and time, see Readme | |||||
41 | Susceptible people | 28.9 | people | Value for your situation of interest | ||||
42 | ||||||||
43 | Density (area / person) in room | 13 | sq ft / person | |||||
44 | Density (people / area) in room | 0.86 | persons / m2 | |||||
45 | Density (volume / person) in room | 4.3 | m3 / person | |||||
46 | ||||||||
47 | Breathing rate (susceptibles) | 0.42 | m3 / h | See Readme sheet - varies a lot with activity level | ||||
48 | Relative breathing rate factor | 1.46 | Ratio between the actual and base breathing rates | |||||
49 | CO2 emission rate (1 person) | 0.007 | L/s (@ 273 K and 1 atm) | From tables in Readme page. This does not affect infection calculation, only use of CO2 as indicator, could ignore | ||||
50 | CO2 emission rate (all persons) | 0.2768 | L/s (@ at actual P & T of room) | Previous, multiplied by number of people, and applying ideal gas law to convert to ambient P & T | ||||
51 | ||||||||
52 | Basic quanta exhalation rate | 18.6 | infectious doses (quanta) h-1 | See Readme sheet | ||||
53 | Q. enhancement due to variants | 2.5 | Dimensionless | 1 for the original variant, 2 for Delta, 2.5 for Omicron BA.1, 3.3 for Omicron BA.2. See Readme file. | ||||
54 | Q enhancement due to vocal. & act. | 1.0 | Dimensionless (ratio to breathing) | Relative increase in emission rate due to vocalization and physical activity (compared to breathing) | ||||
55 | Quanta exhalation rate (infected) | 46.5 | infectious doses (quanta) h-1 | This is a result. Change the previous row if you want to experiment with the quanta emission rate | ||||
56 | ||||||||
57 | Exhalation mask efficiency | 50% | 0 if infective person is not wearing a mask. See Readme sheet | |||||
58 | Fraction of people w/ masks | 100% | Value for your situation. It is applied to everybody for both emission & inhalation. Modify formulas manually if needed | |||||
59 | Inhalation mask efficiency | 30% | See Readme sheet | |||||
60 | ||||||||
61 | Parameters related to the COVID-19 disease | |||||||
62 | ||||||||
63 | Probability of being infective | 0.10% | Very important parameter, specific for each region and time period. For ABSOLUTE results (prob. given prevalence of disease in the population). See Readme sheet | |||||
64 | ||||||||
65 | Hospitalization rate | 10% | From news reports. Varies strongly with age and risk factors | |||||
66 | Death rate | 1% | From news reports. Varies strongly with age and risk factors (1% typical - Higher for older / at risk people) | |||||
67 | ||||||||
68 | CONDITIONAL result for ONE EVENT: we assume the number of infected people above, and get the results under that assumption | |||||||
69 | More appropriate to simulate known outbreaks (e.g. choir, restaurant etc.), and an worst-case scenario for regular events (if one is unlucky enough to have infective people in attendance of a given event) | |||||||
70 | ||||||||
71 | Net emission rate | 23.25 | infectious doses (quanta) h-1 | Includes the number of infective people present | ||||
72 | Avg Quanta Concentration | 0.01 | infectious doses (quanta) m-3 | Analytical solution of the box model. Equation (4) in Miller et al. (2020) | ||||
73 | Quanta inhaled per person | 0.00 | infectious doses (quanta) | |||||
74 | ||||||||
75 | Conditional Results for A GIVEN PERSON & ONE EVENT (assuming number of infected above, typically 1) | |||||||
76 | Probability of infection (1 person) | 0.11% | Applying Wells-Riley infection model to the amount of infectious doses inhaled. Equation (1) in Miller et al. (2020) | |||||
77 | Prob. of hospitalization (1 person) | 0.01% | ||||||
78 | Prob. of death (1 person) | 0.00% | ||||||
79 | Ratio to risk of car travel death | 18 | times larger risk | See FAQs for rough estimate of death traveling by car on a given day | ||||
80 | ||||||||
81 | Conditional Results for ALL ATTENDEES & ONE EVENT (assuming number of infected above, typically 1) | |||||||
82 | Number of COVID cases arising | 0.031 | Number of people. Multiplies probability of one person, times the number of susceptible people present | |||||
83 | N of hospitalizations arising | 0.003 | Number of people | |||||
84 | N of deaths arising | 0.000 | Number of people | |||||
85 | ||||||||
86 | Airborne Infection Risk Parameters (From Peng et al., 2022) | |||||||
87 | Infection Risk Parameter (H) | 0.002 | h2 person / m3 | Indicator of risk in terms of OUTBREAK SIZE. Low risk: H<0.05; Med: H<0.5; High: H>0.5; From Peng et al. (2022) | ||||
88 | Relative Inf. risk Parameter (Hr) | 0.000 | h2 / m3 | Indicator of risk in terms of ATTACK RATE. Low risk: Hr< 0.001; Med< 0.01; High>0.01 From Peng et al. (2022) | ||||
89 | ||||||||
90 | Results for CO2 as an indicator of risk (not needed for infection estimation, can ignore for simplicity) | |||||||
91 | Avg CO2 mixing ratio | 1045 | ppm (including 400 ppm background) | Analytical solution of the box model. Equation (4) in Miller et al. (2020). See FAQ page for differences w/ quanta calc | ||||
92 | Avg CO2 concentration | 1.12 | g m-3 (excluding 400 ppm background) | Conversion from Atmos. Chem. Cheat Sheet, plus ideal gas law | ||||
93 | Exhaled CO2 re-inhaled per person | 0.16 | grams (excluding 400 ppm background) | This parameter is the most analogous to risk. See FAQ page for limitations | ||||
94 | Exhaled CO2 re-inhaled per person | 214.86 | ppm * h (maybe easier units, excludes 400 ppm background) | This parameter is the most analogous to risk. See FAQ page for limitations | ||||
95 | Exhaled CO2 re-inhaled per person | 0.0215 | %CO2 * h (same as above, different unit, for use next) | |||||
96 | Ratio of prob of infection to Ex_CO2 | 0.050 | % chance of infection for 1 person per %CO2 * h inhaled | |||||
97 | CO2 to inhale 1 hr for 1% infect. | 2385 | ppm | This is another metric of risk | ||||
98 | ||||||||
99 | ABSOLUTE result for ONE EVENT: we use the prevalence of the disease in the community to estimate how many infected people may be present in our event, and calculate results based on that | |||||||
100 | More appropriate for general risk estimation, e.g. in a college classroom, indoor gathering etc., where often infective people will not be present | |||||||
101 | ||||||||
102 | N of infective people present | 0.030 | It has to be interpreted statistically. This would be the average over e.g. 100 repetitions of the event in a given location | |||||
103 | ||||||||
104 | Absolute results for A GIVEN PERSON & ONE EVENT (using disease prevalence in community) | |||||||
105 | Probability of infection (1 person) | 0.00% | ||||||
106 | Prob. of hospitalization (1 person) | 0.0004% | ||||||
107 | Prob. of death (1 person) | 0.0000% | ||||||
108 | Ratio to risk of car travel death | 0.6 | times larger risk | See FAQs for rough estimate of death traveling by car on a given day | ||||
109 | ||||||||
110 | Absolute results for ALL ATTENDEES & ONE EVENT (using disease prevalence in community) | |||||||
111 | Number of COVID cases arising | 0.0010 | Number of people | |||||
112 | N of hospitalizations arising | 0.0001 | Number of people | |||||
113 | N of deaths arising | 0.0000 | Number of people | |||||
114 | ||||||||
115 | CO2 to inhale 1 hr for 1% infect. | 58358 | ppm | This is another metric of risk | ||||
116 | ||||||||
117 | ABSOLUTE result for events that are REPEATED MULTIPLE TIMES (e.g. many class meetings during a semester, or a daily commute on public transportation) - Ignore for a single event | |||||||
118 | ||||||||
119 | Absolute results for A GIVEN PERSON & MULTIPLE EVENTS (using disease prevalence in community) | |||||||
120 | Probability of infection (1 person) | 0.22% | ||||||
121 | Prob. of hospitalization (1 person) | 0.02% | ||||||
122 | Prob. of death (1 person) | 0.00% | ||||||
123 | Ratio to risk of car travel death | 1 | times larger risk (than traveling same N of days) | See FAQs for rough estimate of death traveling by car on a given day | ||||
124 | ||||||||
125 | Absolute results for ALL ATTENDEES & MULTIPLE EVENTS (using disease prevalence in community) | |||||||
126 | Number of COVID cases arising | 0.06 | Number of people | |||||
127 | N of hospitalizations arising | 0.01 | Number of people | |||||
128 | N of deaths arising | 0.00 | Number of people | |||||
129 | ||||||||
130 | Technical appendix: ventilation calculations for this case | |||||||
131 | ||||||||
132 | Volume | 150 | m3 | |||||
133 | ||||||||
134 | probability of being infected | 0.30% | ||||||
135 | passengers on car | 35 | people | typical value | ||||
136 | Breathing rate | 0.8 | m3 / h | Estimated from Miller et al. (2020), for someone occasionally talking | ||||
137 | ||||||||
138 | Duration of subway ride | 20 | min | 0.33 | h | Typical value | ||
139 | ||||||||
140 | volumetric recirc air | 900 | cfm | 1521 | m3/h | from info provided by subway operator | ||
141 | 424.80 | L/s | ||||||
142 | filter efficiency | 35% | assumption | |||||
143 | Volumetric recirc air particle free | 148.7 | L/s | 4.25 | L/s/P | |||
144 | ventilation w/ filtered recirc air | 3.6 | h-1 | |||||
145 | ||||||||
146 | volumetric rate outside air | 500 | cfm | 845 | m3/h | from info provided by subway operator | ||
147 | = | 236 | L/s | 6.74 | L/s/P | |||
148 | Ventilation w/ outside air | 5.6 | h-1 | Same as "air changes per hour" | ||||
149 | ||||||||
150 | total volumetric rate | 384.7 | L/s | 11.0 | L/s/person |
| A | B | C | D | E | F | G | H | |
|---|---|---|---|---|---|---|---|---|
1 | ||||||||
2 | Estimation of COVID-19 aerosol transmission: Case of supermarket worker | |||||||
3 | ||||||||
4 | This is a general spreadsheet applicable to any situation, under the assumptions of this model - See notes specific to this case (if applicable) at the very bottom | |||||||
5 | Important inputs as highlighted in orange - change these for your situation | |||||||
6 | Other, more specialized inputs are highlighted in yellow - change only for more advanced applications | |||||||
7 | Calculations are not highlighted - don't change these unless you are sure you know what you are doing | |||||||
8 | Results are in blue -- these are the numbers of interest for most people | |||||||
9 | ||||||||
10 | Environmental Parameters | |||||||
11 | ||||||||
12 | Value | Value in other units | Source / Comments | |||||
13 | Length of room | 80 | ft | 24.4 | m | Can enter as ft or as m (once entered as m, changing in ft does not work) | ||
14 | Width of room | 50 | ft | = | 15.3 | m | Can enter as ft or as m (once entered as m, changing in ft does not work) | |
15 | 4000 | sq ft | 372 | m2 | Can overwrite the m2 one. If you want to enter sq ft, enter "=B15*0.305^2" in the m2 cell, where B15 is the cell w/ sq ft | |||
16 | Height | 18 | ft | = | 5.5 | m | Can enter as ft or as m (once entered as m, changing in ft does not work) | |
17 | Volume | 2043 | m3 | Volume, calculated. (Can also enter directly, then changing dimensions does not work) | ||||
18 | ||||||||
19 | Pressure | 0.95 | atm | Used only for CO2 calculation | ||||
20 | Temperature | 20 | C | Use web converter if needed for F --> C. Used for CO2 calculation, eventually for survival rate of virus | ||||
21 | Relative Humidity | 50 | % | Not yet used, but may eventually be used for survival rate of virus | ||||
22 | Background CO2 Outdoors | 415 | ppm | See readme | ||||
23 | ||||||||
24 | Duration of event | 480 | min | 8.0 | h | Value for your situation of interest | ||
25 | ||||||||
26 | Number of repetitions of event | 21 | times | For e.g. multiple class meetings, multiple commutes in public transportation etc. | ||||
27 | ||||||||
28 | Ventilation w/ outside air | 3 | h-1 | Value in h-1: Readme: Same as "air changes per hour". Value in L/s/per to compare to guidelines (e.g. ASHRAE 62.1) | ||||
29 | Decay rate of the virus | 0.62 | h-1 | See Readme, can estimate for a given T, RH, UV from DHS estimator | ||||
30 | Deposition to surfaces | 0.3 | h-1 | Buonnano et al. (2020), Miller et al. (2020). Could vary 0.24-1.5 h-1, depending on particle size range | ||||
31 | Additional control measures | 0 | h-1 | E.g. filtering of recirc. air, HEPA air cleaner, UV disinfection, etc. See FAQs, Readme for calc for portable HEPA filter | ||||
32 | Total first order loss rate | 3.92 | h-1 | Sum of all the first-order rates | ||||
33 | ||||||||
34 | Ventilation rate per person | 22.7 | L/s/person | This is the value of ventilation that really matters for disease transmission. Includes additional control measures | ||||
35 | ||||||||
36 | Parameters related to people and activity in the room | |||||||
37 | ||||||||
38 | Total N people present | 75 | Value for your situation of interest | |||||
39 | Infective people | 1 | person | Keep this at one unless you really want to study a different cases - see conditional and absolute results | ||||
40 | Fraction of population immune | 6% | From vaccination or disease (seroprevalence reports), will depend on each location and time, see Readme | |||||
41 | Susceptible people | 69.56 | people | Value for your situation of interest | ||||
42 | ||||||||
43 | Density (area / person) in room | 53 | sq ft / person | |||||
44 | Density (people / area) in room | 0.20 | persons / m2 | |||||
45 | Density (volume / person) in room | 27.2 | m3 / person | |||||
46 | ||||||||
47 | Breathing rate (susceptibles) | 0.72 | m3 / h | See Readme sheet - varies a lot with activity level | ||||
48 | Relative breathing rate factor | 2.50 | Ratio between the actual and base breathing rates | |||||
49 | CO2 emission rate (1 person) | 0.00675 | L/s (@ 273 K and 1 atm) | From tables in Readme page. This does not affect infection calculation, only use of CO2 as indicator, could ignore | ||||
50 | CO2 emission rate (all persons) | 0.5719 | L/s (@ at actual P & T of room) | Previous, multiplied by number of people, and applying ideal gas law to convert to ambient P & T | ||||
51 | ||||||||
52 | Basic quanta exhalation rate | 18.6 | infectious doses (quanta) h-1 | See Readme sheet | ||||
53 | Q. enhancement due to variants | 2.5 | Dimensionless | 1 for the original variant, 2 for Delta, 2.5 for Omicron BA.1, 3.3 for Omicron BA.2. See Readme file. | ||||
54 | Q enhancement due to vocal. & act. | 5.0 | Dimensionless (ratio to breathing) | Relative increase in emission rate due to vocalization and physical activity (compared to breathing) | ||||
55 | Quanta exhalation rate (infected) | 232.5 | infectious doses (quanta) h-1 | This is a result. Change the previous row if you want to experiment with the quanta emission rate | ||||
56 | ||||||||
57 | Exhalation mask efficiency | 50% | 0 if infective person is not wearing a mask. See Readme sheet | |||||
58 | Fraction of people w/ masks | 100% | Value for your situation. It is applied to everybody for both emission & inhalation. Modify formulas manually if needed | |||||
59 | Inhalation mask efficiency | 30% | See Readme sheet | |||||
60 | ||||||||
61 | Parameters related to the COVID-19 disease | |||||||
62 | ||||||||
63 | Probability of being infective | 0.10% | Very important parameter, specific for each region and time period. For ABSOLUTE results (prob. given prevalence of disease in the population). See Readme sheet | |||||
64 | ||||||||
65 | Hospitalization rate | 10% | From news reports. Varies strongly with age and risk factors | |||||
66 | Death rate | 1% | From news reports. Varies strongly with age and risk factors (1% typical - Higher for older / at risk people) | |||||
67 | ||||||||
68 | CONDITIONAL result for ONE EVENT: we assume the number of infected people above, and get the results under that assumption | |||||||
69 | More appropriate to simulate known outbreaks (e.g. choir, restaurant etc.), and an worst-case scenario for regular events (if one is unlucky enough to have infective people in attendance of a given event) | |||||||
70 | ||||||||
71 | Net emission rate | 116.25 | infectious doses (quanta) h-1 | Includes the number of infective people present | ||||
72 | Avg Quanta Concentration | 0.01 | infectious doses (quanta) m-3 | Analytical solution of the box model. Equation (4) in Miller et al. (2020) | ||||
73 | Quanta inhaled per person | 0.06 | infectious doses (quanta) | |||||
74 | ||||||||
75 | Conditional Results for A GIVEN PERSON & ONE EVENT (assuming number of infected above, typically 1) | |||||||
76 | Probability of infection (1 person) | 5.5% | Applying Wells-Riley infection model to the amount of infectious doses inhaled. Equation (1) in Miller et al. (2020) | |||||
77 | Prob. of hospitalization (1 person) | 0.6% | ||||||
78 | Prob. of death (1 person) | 0.1% | ||||||
79 | Ratio to risk of car travel death | 918 | times larger risk | See FAQs for rough estimate of death traveling by car on a given day | ||||
80 | ||||||||
81 | Conditional Results for ALL ATTENDEES & ONE EVENT (assuming number of infected above, typically 1) | |||||||
82 | Number of COVID cases arising | 3.83 | Number of people. Multiplies probability of one person, times the number of susceptible people present | |||||
83 | N of hospitalizations arising | 0.38 | Number of people | |||||
84 | N of deaths arising | 0.04 | Number of people | |||||
85 | ||||||||
86 | Airborne Infection Risk Parameters (From Peng et al., 2022) | |||||||
87 | Infection Risk Parameter (H) | 0.29 | h2 person / m3 | Indicator of risk in terms of OUTBREAK SIZE. Low risk: H<0.05; Med: H<0.5; High: H>0.5; From Peng et al. (2022) | ||||
88 | Relative Inf. risk Parameter (Hr) | 0.004 | h2 / m3 | Indicator of risk in terms of ATTACK RATE. Low risk: Hr< 0.001; Med< 0.01; High>0.01 From Peng et al. (2022) | ||||
89 | ||||||||
90 | Results for CO2 as an indicator of risk (not needed for infection estimation, can ignore for simplicity) | |||||||
91 | Avg CO2 mixing ratio | 722 | ppm (including 400 ppm background) | Analytical solution of the box model. Equation (4) in Miller et al. (2020). See FAQ page for differences w/ quanta calc | ||||
92 | Avg CO2 concentration | 0.56 | g m-3 (excluding 400 ppm background) | Conversion from Atmos. Chem. Cheat Sheet, plus ideal gas law | ||||
93 | Exhaled CO2 re-inhaled per person | 3.22 | grams (excluding 400 ppm background) | This parameter is the most analogous to risk. See FAQ page for limitations | ||||
94 | Exhaled CO2 re-inhaled per person | 2575.64 | ppm * h (maybe easier units, excludes 400 ppm background) | This parameter is the most analogous to risk. See FAQ page for limitations | ||||
95 | Exhaled CO2 re-inhaled per person | 0.2576 | %CO2 * h (same as above, different unit, for use next) | |||||
96 | Ratio of prob of infection to Ex_CO2 | 0.214 | % chance of infection for 1 person per %CO2 * h inhaled | |||||
97 | CO2 to inhale 1 hr for 1% infect. | 861 | ppm | This is another metric of risk | ||||
98 | ||||||||
99 | ABSOLUTE result for ONE EVENT: we use the prevalence of the disease in the community to estimate how many infected people may be present in our event, and calculate results based on that | |||||||
100 | More appropriate for general risk estimation, e.g. in a college classroom, indoor gathering etc., where often infective people will not be present | |||||||
101 | ||||||||
102 | N of infective people present | 0.071 | It has to be interpreted statistically. This would be the average over e.g. 100 repetitions of the event in a given location | |||||
103 | ||||||||
104 | Absolute results for A GIVEN PERSON & ONE EVENT (using disease prevalence in community) | |||||||
105 | Probability of infection (1 person) | 0.41% | ||||||
106 | Prob. of hospitalization (1 person) | 0.04% | ||||||
107 | Prob. of death (1 person) | 0.00% | ||||||
108 | Ratio to risk of car travel death | 68 | times larger risk | See FAQs for rough estimate of death traveling by car on a given day | ||||
109 | ||||||||
110 | Absolute results for ALL ATTENDEES & ONE EVENT (using disease prevalence in community) | |||||||
111 | Number of COVID cases arising | 0.28 | Number of people | |||||
112 | N of hospitalizations arising | 0.03 | Number of people | |||||
113 | N of deaths arising | 0.00 | Number of people | |||||
114 | ||||||||
115 | CO2 to inhale 1 hr for 1% infect. | 6451 | ppm | This is another metric of risk | ||||
116 | ||||||||
117 | ABSOLUTE result for events that are REPEATED MULTIPLE TIMES (e.g. many class meetings during a semester, or a daily commute on public transportation) - Ignore for a single event | |||||||
118 | ||||||||
119 | Absolute results for A GIVEN PERSON & MULTIPLE EVENTS (using disease prevalence in community) | |||||||
120 | Probability of infection (1 person) | 8.21% | ||||||
121 | Prob. of hospitalization (1 person) | 0.82% | ||||||
122 | Prob. of death (1 person) | 0.08% | ||||||
123 | Ratio to risk of car travel death | 65 | times larger risk (than traveling same N of days) | See FAQs for rough estimate of death traveling by car on a given day | ||||
124 | ||||||||
125 | Absolute results for ALL ATTENDEES & MULTIPLE EVENTS (using disease prevalence in community) | |||||||
126 | Number of COVID cases arising | 5.70 | Number of people | |||||
127 | N of hospitalizations arising | 0.57 | Number of people | |||||
128 | N of deaths arising | 0.06 | Number of people | |||||
129 | ||||||||
130 | Specific notes for this case | |||||||
131 | Based on a specific supermarket in Boulder, Colorado. | |||||||
132 | Horizontal dimensions estimated from Google Maps (using scale), height using pictures from Google Street View (using people present for scale) | |||||||
133 | Ventilation rate estimated from ASHRAE standard in Readme page | |||||||
134 | Occupancy typical daily average, based on my visits to the space pre-pandemic (may be lower now. | |||||||
135 | Other parameters estimated per Readme for this situation | |||||||
136 | This is for a supermarket worker. For a customer, change the time spent in the story to e.g. 1 hr, 4 times a week to simulate 1 month |
| A | B | C | D | E | F | G | H | |
|---|---|---|---|---|---|---|---|---|
1 | ||||||||
2 | Estimation of COVID-19 aerosol transmission: Case for Soccer Match (ONLY through air beyond close proximity, so will underestimate a lot) | |||||||
3 | ||||||||
4 | This is a general spreadsheet applicable to any situation, under the assumptions of this model - See notes specific to this case (if applicable) at the very bottom | |||||||
5 | Important inputs as highlighted in orange - change these for your situation | |||||||
6 | Other, more specialized inputs are highlighted in yellow - change only for more advanced applications | |||||||
7 | Calculations are not highlighted - don't change these unless you are sure you know what you are doing | |||||||
8 | Results are in blue -- these are the numbers of interest for most people | |||||||
9 | ||||||||
10 | Environmental Parameters | |||||||
11 | ||||||||
12 | Value | Value in other units | Source / Comments | |||||
13 | Length of room | 600 | ft | 183.0 | m | Can enter as ft or as m (once entered as m, changing in ft does not work) | ||
14 | Width of room | 300 | ft | = | 91.5 | m | Can enter as ft or as m (once entered as m, changing in ft does not work) | |
15 | 180000 | sq ft | 16745 | m2 | Can overwrite the m2 one. If you want to enter sq ft, enter "=B15*0.305^2" in the m2 cell, where B15 is the cell w/ sq ft | |||
16 | Height | 50 | ft | = | 15.3 | m | Can enter as ft or as m (once entered as m, changing in ft does not work) | |
17 | Volume | 255354 | m3 | Volume, calculated. (Can also enter directly, then changing dimensions does not work) | ||||
18 | ||||||||
19 | Pressure | 0.95 | atm | Used only for CO2 calculation | ||||
20 | Temperature | 20 | C | Use web converter if needed for F --> C. Used for CO2 calculation, eventually for survival rate of virus | ||||
21 | Relative Humidity | 50 | % | Not yet used, but may eventually be used for survival rate of virus | ||||
22 | Background CO2 Outdoors | 415 | ppm | See readme | ||||
23 | ||||||||
24 | Duration of event | 90 | min | 1.5 | h | Value for your situation of interest | ||
25 | ||||||||
26 | Number of repetitions of event | 1 | times | For e.g. multiple class meetings, multiple commutes in public transportation etc. | ||||
27 | ||||||||
28 | Ventilation w/ outside air | 40 | h-1 | Value in h-1: Readme: Same as "air changes per hour". Value in L/s/per to compare to guidelines (e.g. ASHRAE 62.1) | ||||
29 | Decay rate of the virus | 0.62 | h-1 | See Readme, can estimate for a given T, RH, UV from DHS estimator | ||||
30 | Deposition to surfaces | 0.3 | h-1 | Buonnano et al. (2020), Miller et al. (2020). Could vary 0.24-1.5 h-1, depending on particle size range | ||||
31 | Additional control measures | 0 | h-1 | E.g. filtering of recirc. air, HEPA air cleaner, UV disinfection, etc. See FAQs, Readme for calc for portable HEPA filter | ||||
32 | Total first order loss rate | 40.92 | h-1 | Sum of all the first-order rates | ||||
33 | ||||||||
34 | Ventilation rate per person | 91.5 | L/s/person | This is the value of ventilation that really matters for disease transmission. Includes additional control measures | ||||
35 | ||||||||
36 | Parameters related to people and activity in the room | |||||||
37 | ||||||||
38 | Total N people present | 31000 | Value for your situation of interest | |||||
39 | Infective people | 1 | person | Keep this at one unless you really want to study a different cases - see conditional and absolute results | ||||
40 | Fraction of population immune | 0% | From vaccination or disease (seroprevalence reports), will depend on each location and time, see Readme | |||||
41 | Susceptible people | 30999 | people | Value for your situation of interest | ||||
42 | ||||||||
43 | Density (area / person) in room | 6 | sq ft / person | |||||
44 | Density (people / area) in room | 1.85 | persons / m2 | |||||
45 | Density (volume / person) in room | 8.2 | m3 / person | |||||
46 | ||||||||
47 | Breathing rate (susceptibles) | 0.72 | m3 / h | See Readme sheet - varies a lot with activity level | ||||
48 | Relative breathing rate factor | 2.50 | Ratio between the actual and base breathing rates | |||||
49 | CO2 emission rate (1 person) | 0.0061 | L/s (@ 273 K and 1 atm) | From tables in Readme page. This does not affect infection calculation, only use of CO2 as indicator, could ignore | ||||
50 | CO2 emission rate (all persons) | 213.6272 | L/s (@ at actual P & T of room) | Previous, multiplied by number of people, and applying ideal gas law to convert to ambient P & T | ||||
51 | ||||||||
52 | Basic quanta exhalation rate | 18.6 | infectious doses (quanta) h-1 | See Readme sheet | ||||
53 | Q. enhancement due to variants | 2.5 | Dimensionless | 1 for the original variant, 2 for Delta, 2.5 for Omicron BA.1, 3.3 for Omicron BA.2. See Readme file. | ||||
54 | Q enhancement due to vocal. & act. | 25.0 | Dimensionless (ratio to breathing) | Relative increase in emission rate due to vocalization and physical activity (compared to breathing) | ||||
55 | Quanta exhalation rate (infected) | 1162.5 | infectious doses (quanta) h-1 | This is a result. Change the previous row if you want to experiment with the quanta emission rate | ||||
56 | ||||||||
57 | Exhalation mask efficiency | 0% | 0 if infective person is not wearing a mask. See Readme sheet | |||||
58 | Fraction of people w/ masks | 0% | Value for your situation. It is applied to everybody for both emission & inhalation. Modify formulas manually if needed | |||||
59 | Inhalation mask efficiency | 0% | See Readme sheet | |||||
60 | ||||||||
61 | Parameters related to the COVID-19 disease | |||||||
62 | ||||||||
63 | Probability of being infective | 0.100% | Very important parameter, specific for each region and time period. For ABSOLUTE results (prob. given prevalence of disease in the population). See Readme sheet | |||||
64 | ||||||||
65 | Hospitalization rate | 10% | From news reports. Varies strongly with age and risk factors | |||||
66 | Death rate | 1% | From news reports. Varies strongly with age and risk factors (1% typical - Higher for older / at risk people) | |||||
67 | ||||||||
68 | CONDITIONAL result for ONE EVENT: we assume the number of infected people above, and get the results under that assumption | |||||||
69 | More appropriate to simulate known outbreaks (e.g. choir, restaurant etc.), and an worst-case scenario for regular events (if one is unlucky enough to have infective people in attendance of a given event) | |||||||
70 | ||||||||
71 | Net emission rate | 1162.5 | infectious doses (quanta) h-1 | Includes the number of infective people present | ||||
72 | Avg Quanta Concentration | 0.00 | infectious doses (quanta) m-3 | Analytical solution of the box model. Equation (4) in Miller et al. (2020) | ||||
73 | Quanta inhaled per person | 0.00 | infectious doses (quanta) | |||||
74 | ||||||||
75 | Conditional Results for A GIVEN PERSON & ONE EVENT (assuming number of infected above, typically 1) | |||||||
76 | Probability of infection (1 person) | 0.012% | Applying Wells-Riley infection model to the amount of infectious doses inhaled. Equation (1) in Miller et al. (2020) | |||||
77 | Prob. of hospitalization (1 person) | 0.0% | ||||||
78 | Prob. of death (1 person) | 0.0% | ||||||
79 | Ratio to risk of car travel death | 2 | times larger risk | See FAQs for rough estimate of death traveling by car on a given day | ||||
80 | ||||||||
81 | Conditional Results for ALL ATTENDEES & ONE EVENT (assuming number of infected above, typically 1) | |||||||
82 | Number of COVID cases arising | 3.66 | Number of people. Multiplies probability of one person, times the number of susceptible people present | |||||
83 | N of hospitalizations arising | 0.37 | Number of people | |||||
84 | N of deaths arising | 0.04 | Number of people | |||||
85 | ||||||||
86 | Airborne Infection Risk Parameters (From Peng et al., 2022) | |||||||
87 | Infection Risk Parameter (H) | 0.27 | h2 person / m3 | Indicator of risk in terms of OUTBREAK SIZE. Low risk: H<0.05; Med: H<0.5; High: H>0.5; From Peng et al. (2022) | ||||
88 | Relative Inf. risk Parameter (Hr) | 0.000 | h2 / m3 | Indicator of risk in terms of ATTACK RATE. Low risk: Hr< 0.001; Med< 0.01; High>0.01 From Peng et al. (2022) | ||||
89 | ||||||||
90 | Results for CO2 as an indicator of risk (not needed for infection estimation, can ignore for simplicity) | |||||||
91 | Avg CO2 mixing ratio | 474 | ppm (including 400 ppm background) | Analytical solution of the box model. Equation (4) in Miller et al. (2020). See FAQ page for differences w/ quanta calc | ||||
92 | Avg CO2 concentration | 0.13 | g m-3 (excluding 400 ppm background) | Conversion from Atmos. Chem. Cheat Sheet, plus ideal gas law | ||||
93 | Exhaled CO2 re-inhaled per person | 0.14 | grams (excluding 400 ppm background) | This parameter is the most analogous to risk. See FAQ page for limitations | ||||
94 | Exhaled CO2 re-inhaled per person | 111.06 | ppm * h (maybe easier units, excludes 400 ppm background) | This parameter is the most analogous to risk. See FAQ page for limitations | ||||
95 | Exhaled CO2 re-inhaled per person | 0.0111 | %CO2 * h (same as above, different unit, for use next) | |||||
96 | Ratio of prob of infection to Ex_CO2 | 0.0106 | % chance of infection for 1 person per %CO2 * h inhaled | |||||
97 | CO2 to inhale 1 hr for 1% infect. | 7908 | ppm | This is another metric of risk | ||||
98 | ||||||||
99 | ABSOLUTE result for ONE EVENT: we use the prevalence of the disease in the community to estimate how many infected people may be present in our event, and calculate results based on that | |||||||
100 | More appropriate for general risk estimation, e.g. in a college classroom, indoor gathering etc., where often infective people will not be present | |||||||
101 | ||||||||
102 | N of infective people present | 31.000 | It has to be interpreted statistically. This would be the average over e.g. 100 repetitions of the event in a given location | |||||
103 | ||||||||
104 | Absolute results for A GIVEN PERSON & ONE EVENT (using disease prevalence in community) | |||||||
105 | Probability of infection (1 person) | 0.37% | ||||||
106 | Prob. of hospitalization (1 person) | 0.04% | ||||||
107 | Prob. of death (1 person) | 0.00% | ||||||
108 | Ratio to risk of car travel death | 61 | times larger risk | See FAQs for rough estimate of death traveling by car on a given day | ||||
109 | ||||||||
110 | Absolute results for ALL ATTENDEES & ONE EVENT (using disease prevalence in community) | |||||||
111 | Number of COVID cases arising | 113.25 | Number of people | |||||
112 | N of hospitalizations arising | 11.33 | Number of people | |||||
113 | N of deaths arising | 1.13 | Number of people | |||||
114 | ||||||||
115 | CO2 to inhale 1 hr for 1% infect. | 657 | ppm | This is another metric of risk | ||||
116 | ||||||||
117 | ABSOLUTE result for events that are REPEATED MULTIPLE TIMES (e.g. many class meetings during a semester, or a daily commute on public transportation) - Ignore for a single event | |||||||
118 | ||||||||
119 | Absolute results for A GIVEN PERSON & MULTIPLE EVENTS (using disease prevalence in community) | |||||||
120 | Probability of infection (1 person) | 0.37% | ||||||
121 | Prob. of hospitalization (1 person) | 0.04% | ||||||
122 | Prob. of death (1 person) | 0.00% | ||||||
123 | Ratio to risk of car travel death | 61 | times larger risk (than traveling same N of days) | See FAQs for rough estimate of death traveling by car on a given day | ||||
124 | ||||||||
125 | Absolute results for ALL ATTENDEES & MULTIPLE EVENTS (using disease prevalence in community) | |||||||
126 | Number of COVID cases arising | 113.25 | Number of people | |||||
127 | N of hospitalizations arising | 11.33 | Number of people | |||||
128 | N of deaths arising | 1.13 | Number of people | |||||
129 | ||||||||
130 | Specific notes for this case | |||||||
131 | This is a case for a soccer stadium, as discussed in this tweet: https://twitter.com/jljcolorado/status/1289254898131820550 | |||||||
132 | And based on this paper: https://www.sciencedirect.com/science/article/pii/S1352231013004494 | |||||||
133 | Note that for the infection risk, the calculator only estimates the infection risk through the air beyond close proximity. Since social distance would not be maintained in such an event, this will be a large underestimate |
| A | B | C | D | E | F | G | H | |
|---|---|---|---|---|---|---|---|---|
1 | ||||||||
2 | Estimation of COVID-19 aerosol transmission in a university classroom | |||||||
3 | ||||||||
4 | Input Parameters | |||||||
5 | Value | Value in other units | Source | |||||
6 | Surface area | 500 | sq ft | = | 46.5 | m2 | Typical value | |
7 | Height | 10 | ft | = | 3.1 | m | Typical value | |
8 | Volume | 142 | m3 | |||||
9 | ||||||||
10 | Faculty / instructors | 1 | person | Typical value - Assumed constant | ||||
11 | Surface area per student | 65 | sq ft | = | 6.0 | m2 | CU-Boulder: 60-120 sq ft / person. UNC = 36 sq ft / person. See Readme | |
12 | Students | 7 | people | You can change this number directly, then the previous input of area per student is not used | ||||
13 | Breathing rate (instructor) | 1.1 | m3/h | Estimated from Miller et al. (2020), for someone talking a lot | ||||
14 | Breathing rate (students) | 0.8 | m3 / h | Estimated from Miller et al. (2020), for someone occasionally talking | ||||
15 | ||||||||
16 | Duration of class period | 50 | min | 0.83 | h | Typical value | ||
17 | ||||||||
18 | Ventilation w/ outside air | 3 | h-1 | 15 | L/s/per | First value is the same as "air changes per hour". Second is used in most guidelines now | ||
19 | Decay rate of the virus | 0.32 | h-1 | Average of literature values (0 and 0.62), Miller et al. (2020) | ||||
20 | Deposition to surfaces | 0.3 | h-1 | Buonnano et al. (2020), Miller et al. (2020). Could vary 0.24-1.5 h-1, depending on particle size range | ||||
21 | Additional control measures | 0 | h-1 | E.g. UV disinfection, personal HEPA air cleaner, etc. | ||||
22 | Total first order loss rate | 3.62 | h-1 | |||||
23 | ||||||||
24 | CONDITIONAL RESULT: Case in which instructor is infected, students are susceptible | |||||||
25 | ||||||||
26 | Quanta emission rate (instructor) | 135 | q h-1 | Estimated from Miller (2020) and Buonnano et al. (2020a, 2020b). See Readme sheet | ||||
27 | Mask efficiency for emission | 50% | See readme sheet | |||||
28 | Net emission rate | 67.5 | q h-1 | |||||
29 | ||||||||
30 | Avg Quanta Concentration | 0.09 | q m-3 | Equation (4) in Miller et al. (2020) | ||||
31 | ||||||||
32 | Mask efficiency for intake | 30% | See readme sheet | |||||
33 | Quanta inhaled per student | 0.04 | quanta | |||||
34 | Probability of infection (1 student) | 4% | Equation (1) in Miller et al. (2020). This assumes instructor was infected. See "Campus" sheet for more general case | |||||
35 | Number of COVID cases arising | 0.29 | ||||||
36 | ||||||||
37 | CONDITIONAL RESULT: Case in which student is infected, other students and instructor are susceptible | |||||||
38 | ||||||||
39 | Quanta emission rate (student) | 16 | h-1 | Estimated from Miller (2020) and Buonnano et al. (2020a, 2020b). See Readme sheet | ||||
40 | Mask efficiency for emission | 50% | See readme sheet / Assume potentially different masks types for students and instructor | |||||
41 | Net emission rate | 8 | q h-1 | |||||
42 | ||||||||
43 | Avg Quanta Concentration | 0.01 | q m-3 | Equation (4) in Miller et al. (2020) | ||||
44 | ||||||||
45 | Mask efficiency for intake | 30% | See readme sheet | |||||
46 | Quanta inhaled per person | 0.007 | quanta | Using instructor breathing rate | ||||
47 | Probability of infection (1 person) | 0.7% | Equation (1) in Miller et al. (2020). This assumes 1 student was infected. See "Campus" sheet for more general case | |||||
48 | Number of COVID cases arising | 0.048 | This is for one lecture only, of the length specified above. For a whole semester, see "Campus" sheet |
| A | B | C | D | E | F | G | H | |
|---|---|---|---|---|---|---|---|---|
1 | ||||||||
2 | Estimation of COVID-19 aerosol transmission outdoors (Skagit Choir Repeat) during daytime, relatively crowded conditions (1.3 persons / m2) - S | |||||||
3 | ||||||||
4 | Input Parameters | |||||||
5 | Value | Value in other units | Source | |||||
6 | Surface area | 1800 | sq ft | = | 167.4 | m2 | Just assuming a value, similar to choir outbreak case | |
7 | Height | 16 | ft | = | 4.8 | m | Assuming that air within this height can get mixed to respiratory height | |
8 | Volume | 810 | m3 | |||||
9 | ||||||||
10 | Infected people | 1 | person | Just assuming a value, similar to choir outbreak case | ||||
11 | Susceptible people | 60 | people | Just assuming a value, similar to choir outbreak case | ||||
12 | Breathing rate (index case) | 1.1 | m3 / h | Estimated from Miller et al. (2020), for someone singing | ||||
13 | Breathing rate (susceptible) | 1.1 | m3 / h | Estimated from Miller et al. (2020), for someone singing | ||||
14 | ||||||||
15 | Duration of event | 150 | min | 2.50 | h | Just assuming a value, similar to choir outbreak case | ||
16 | ||||||||
17 | Wind speed | 5 | km/ h | 1.4 | m/s | 1/2 of low end of average daytime US wind speed per https://sciencing.com/average-daily-wind-speed-24011.html | ||
18 | ||||||||
19 | Ventilation w/ outside air | 386 | h-1 | Same as "air changes per hour", calculated approximately from the wind speed | ||||
20 | Decay rate of the virus | 9.3 | h-1 | Estimated (UV index 5, default T & RH) from https://www.dhs.gov/science-and-technology/sars-airborne-calculator | ||||
21 | Deposition to surfaces | 0.3 | h-1 | Buonnano et al. (2020), Miller et al. (2020). Could vary 0.24-1.5 h-1, depending on particle size range | ||||
22 | Additional control measures | 0 | h-1 | E.g. UV disinfection, personal HEPA air cleaner, etc. | ||||
23 | Total first order loss rate | 396 | h-1 | |||||
24 | ||||||||
25 | CONDITIONAL RESULT: Case with one person infected, everyone else is susceptible | |||||||
26 | ||||||||
27 | Quanta emission rate (infected) | 970 | q h-1 | Just assuming a value, similar to choir outbreak case. This should be an upper limit for COVID-19. See Readme | ||||
28 | Mass efficiency for emission | 0% | No masks were worn, for comparison with choir outbreak | |||||
29 | Net emission rate | 970 | q h-1 | Includes the number of infected people above | ||||
30 | ||||||||
31 | Avg Quanta Concentration | 0.00 | q m-3 | Equation (4) in Miller et al. (2020) | ||||
32 | ||||||||
33 | Quanta inhaled per person | 0.0083 | quanta | |||||
34 | Probability of infection (1 person) | 0.8% | Equation (1) in Miller et al. (2020) | |||||
35 | Number of COVID cases arising | 0.5 |
| A | B | C | D | E | F | G | |
|---|---|---|---|---|---|---|---|
1 | |||||||
2 | Estimation of COVID-19 aerosol transmission in a university campus | ||||||
3 | |||||||
4 | Input Parameters | ||||||
5 | Comments | ||||||
6 | Probability of a student being infected | 0.30% | See readme sheet | ||||
7 | Probability of an instructor being infected | 0.30% | See readme sheet | ||||
8 | |||||||
9 | Student population of campus | 33000 | people | Estimated for large Western US university | |||
10 | Instructors w/ in-person teaching | 2000 | people | Estimated for large Western US university, including TAs | |||
11 | Indoor classroom periods per student | 2 | per day | Estimated for large Western US university. Duration set in "Classroom" sheet | |||
12 | Indoor classroom periods per instructor | 1 | per day | Estimated for large Western US university. Duration set in "Classroom" sheet | |||
13 | Duration of semester | 13 | weeks | 65 | days | ||
14 | Total class hours for student per semester | 108 | h / semester | ||||
15 | Total class hours for instructor per semester | 54 | h / semester | ||||
16 | |||||||
17 | Probability of hospitalization for students | 5% | Estimated from news reports, varies with time and location | ||||
18 | Probability of hospitalization for faculty | 20% | Estimated from news reports, varies with time and location | ||||
19 | Probability of death for students | 0.05% | Estimated from news reports, varies with time and location | ||||
20 | Probability of death for faculty | 0.50% | Estimated from news reports, varies with time and location | ||||
21 | |||||||
22 | ABSOLUTE Results: infections, hospitalizations, and deaths | ||||||
23 | |||||||
24 | Student cases | 1144 | cases | ||||
25 | Instructor cases | 3 | cases | ||||
26 | |||||||
27 | Student hospitalizations | 57 | hospitalizations | ||||
28 | Instructor hospitalizations | 0.5 | hospitalizations | ||||
29 | |||||||
30 | Student deaths | 0.57 | deaths | ||||
31 | Instructor deaths | 0.01 | deaths |
| A | B | C | D | E | F | G | H | |
|---|---|---|---|---|---|---|---|---|
1 | ||||||||
2 | Estimation of COVID-19 aerosol transmission in an urban bus | |||||||
3 | ||||||||
4 | Input Parameters | |||||||
5 | Value | Value in other units | Source | |||||
6 | Surface area | 307 | sq ft | = | 28.6 | m2 | Provided by bus operator | |
7 | Height | 7.9 | ft | = | 2.4 | m | Provided by bus operator | |
8 | Volume | 69 | m3 | |||||
9 | ||||||||
10 | Passengers | 40 | people | Capacity is 50 people, provided by bus operator. Assuming 80% full for this estimation | ||||
11 | Breathing rate | 0.8 | m3 / h | Estimated from Miller et al. (2020), for someone occasionally talking | ||||
12 | ||||||||
13 | Duration of trip | 45 | min | 0.75 | h | Typical value. People may come in and out for urban buses, that mixes people and will increase transmission more | ||
14 | ||||||||
15 | Ventilation w/ outside air | 3 | h-1 | 1.4 | L/s/per | First value is the same as "air changes per hour". Second is used in most guidelines now | ||
16 | Decay rate of the virus | 0.32 | h-1 | Average of literature values (0 and 0.62), Miller et al. (2020) | ||||
17 | Deposition to surfaces | 0.3 | h-1 | Buonnano et al. (2020), Miller et al. (2020). Could vary 0.24-1.5 h-1, depending on particle size range | ||||
18 | Additional control measures | 0 | h-1 | E.g. UV disinfection, personal HEPA air cleaner, etc. | ||||
19 | Total first order loss rate | 3.62 | h-1 | |||||
20 | ||||||||
21 | Fraction of population infected | 0.30% | See readme sheet | |||||
22 | Number of passengers infected | 0.12 | people | |||||
23 | ||||||||
24 | ABSOLUTE RESULTS: probability of infection, taking into account the prevalence of the disease in the population | |||||||
25 | ||||||||
26 | Quanta emission rate | 10 | q h-1 | Estimated from Miller (2020) and Buonnano et al. (2020a, 2020b). See Readme sheet | ||||
27 | Mask efficiency for emission | 50% | See readme sheet | |||||
28 | Net emission rate | 5 | q h-1 | |||||
29 | ||||||||
30 | Avg Quanta Conc. (1 infected) | 0.01 | q m-3 | Equation (4) in Miller et al. (2020) | ||||
31 | Avg Quanta Conc. (w/ prob of inf.) | 0.002 | ||||||
32 | ||||||||
33 | Mask efficiency for intake | 30% | See readme sheet | |||||
34 | Quanta inhaled per person | 0.00 | quanta | |||||
35 | Probability of infection (1 person) | 0.1% | Equation (1) in Miller et al. (2020) | |||||
36 | Number of COVID cases arising | 0.03 |
| A | B | C | D | E | F | G | H | |
|---|---|---|---|---|---|---|---|---|
1 | ||||||||
2 | Estimation of COVID-19 aerosol transmission outdoors during daytime, demonstration (5 people / m2) | |||||||
3 | ||||||||
4 | Input Parameters | |||||||
5 | Value | Value in other units | Source | |||||
6 | Surface area | 1800 | sq ft | = | 167 | m2 | Just assuming a value, similar to choir outbreak case | |
7 | Height | 15 | ft | = | 5 | m | Assuming that air within this height can get mixed to respiratory height | |
8 | Volume | 766 | m3 | |||||
9 | ||||||||
10 | Prob. of demonstrator infected | 0.30% | See readme sheet | |||||
11 | ||||||||
12 | Number of infected people | 2.5 | person | Just assuming a value, similar to choir outbreak case | ||||
13 | Susceptible people | 837 | people | Assume 5 people per m2, per http://www.gkstill.com/Support/crowd-density/CrowdDensity-1.html | ||||
14 | Breathing rate (index case) | 0.8 | m3 / h | Estimated from Miller et al. (2020), for someone occasionally talking | ||||
15 | Breathing rate (susceptible) | 0.8 | m3 / h | Estimated from Miller et al. (2020), for someone occasionally talking | ||||
16 | ||||||||
17 | Duration of event | 150 | min | 2.50 | h | Typical value for a demonstration. Also similar to choir outbreak case | ||
18 | ||||||||
19 | Wind speed | 5 | km/ h | 1.4 | m/s | 1/2 of low end of average daytime US wind speed per https://sciencing.com/average-daily-wind-speed-24011.html | ||
20 | ||||||||
21 | Ventilation w/ outside air | 386 | h-1 | Same as "air changes per hour", calculated approximately from the wind speed | ||||
22 | Decay rate of the virus | 9.3 | h-1 | Estimated (UV index 5, default T & RH) from https://www.dhs.gov/science-and-technology/sars-airborne-calculator | ||||
23 | Deposition to surfaces | 0.3 | h-1 | Buonnano et al. (2020), Miller et al. (2020). Could vary 0.24-1.5 h-1, depending on particle size range | ||||
24 | Additional control measures | 0 | h-1 | E.g. UV disinfection, personal HEPA air cleaner, etc. | ||||
25 | Total first order loss rate | 396 | h-1 | |||||
26 | ||||||||
27 | ABSOLUTE RESULTS: probability of infection, taking into account the prevalence of the disease in the population | |||||||
28 | ||||||||
29 | Quanta emission rate (infected) | 100 | q h-1 | People talking loudly, see readme sheet | ||||
30 | Mass efficiency for emission | 40% | Assume 80% mask wearing | |||||
31 | Net emission rate | 151 | q h-1 | Includes the number of infected people above | ||||
32 | ||||||||
33 | Avg Quanta Concentration | 0.00 | q m-3 | Equation (4) in Miller et al. (2020) | ||||
34 | ||||||||
35 | Quanta inhaled per person | 0.00 | quanta | |||||
36 | Probability of infection (1 person) | 0.10% | Equation (1) in Miller et al. (2020) | |||||
37 | Number of COVID cases arising | 0.8 |
| A | B | C | D | E | F | G | H | |
|---|---|---|---|---|---|---|---|---|
1 | ||||||||
2 | Estimation of COVID-19 aerosol transmission in a political rally | |||||||
3 | ||||||||
4 | Input Parameters | |||||||
5 | Value | Value in other units | Source | |||||
6 | Surface area | 146595 | sq ft | = | 13637.0 | m2 | https://en.wikipedia.org/wiki/BOK_Center and estimated from Google maps | |
7 | Height | 120 | ft | = | 36.6 | m | https://en.wikipedia.org/wiki/BOK_Center | |
8 | Volume | 499114 | m3 | |||||
9 | ||||||||
10 | Attendees | 19199 | people | https://en.wikipedia.org/wiki/BOK_Center | ||||
11 | Breathing rate | 0.9 | m3/h | Estimated from Miller et al. (2020), for someone talking, shouting, cheering part of the time | ||||
12 | ||||||||
13 | Duration of Event | 120 | min | 2.00 | h | Typical value, includings some waiting time before event, and time to enter and exit | ||
14 | ||||||||
15 | Area of player field | 19550 | sq ft | = | 1818.6 | m2 | https://en.wikipedia.org/wiki/Ice_hockey_rink#Dimensions with buffer at the back | |
16 | Rest of building area | 127045 | = | 11818.4 | m2 | |||
17 | ||||||||
18 | Ventilation for player field | 2137 | L/s | 7692 | m3 h-1 | 10 L/s/person + 0.9 L/s/m2, per ASHRAE 62.1-2013 | ||
19 | Ventilation for rest of building | 83593 | L/s | 300934 | m3 h-1 | 3.8 L/s/person + 0.3 L/s/m2, per ASHRAE 62.1-2013 | ||
20 | ||||||||
21 | ||||||||
22 | Ventilation w/ outside air | 0.62 | h-1 | #REF! | L/s/per | First value is the same as "air changes per hour". Second is used in most guidelines now | ||
23 | Decay rate of the virus | 0.32 | h-1 | Average of literature values (0 and 0.62), Miller et al. (2020) | ||||
24 | Deposition to surfaces | 0.3 | h-1 | Buonnano et al. (2020), Miller et al. (2020). Could vary 0.24-1.5 h-1, depending on particle size range | ||||
25 | Additional control measures | 0 | h-1 | E.g. UV disinfection, personal HEPA air cleaner, etc. | ||||
26 | Total first order loss rate | 1.24 | h-1 | |||||
27 | ||||||||
28 | Case in which instructor is infected, students are susceptible | |||||||
29 | ||||||||
30 | Quanta emission rate per person | 50 | q h-1 | Estimated from Miller (2020) and Buonnano et al. (2020a, 2020b). See Readme sheet, shouting, cheering, talking | ||||
31 | Mask efficiency for emission | 15% | See readme sheet; Assuming 1/3 of people wearing masks | |||||
32 | Net emission rate per person | 43 | q h-1 | |||||
33 | Fraction of infected people in OK | 0.10% | ||||||
34 | Total emission rate | 816 | ||||||
35 | ||||||||
36 | Avg Quanta Concentration | 0.001 | q m-3 | Equation (4) in Miller et al. (2020) | ||||
37 | ||||||||
38 | Mask efficiency for intake | 15% | See readme sheet | |||||
39 | Quanta inhaled per person | 0.001 | quanta | |||||
40 | Probability of infection (1 student) | 0% | Equation (1) in Miller et al. (2020) | |||||
41 | Number of COVID cases arising | 24 |