
Understanding Powermeter Metrics
Part 1: Basic Stryd Metrics
by Steve Palladino
coach and consultant, Palladino Power Project
July 25, 2018
One of the great features of running with a powermeter, such as Stryd, is the abundant metrics to which users are given access. On the one hand, when well understood, these metrics can shed light on improving running performances. On the other hand, when not well understood, these metrics can be confusing, frustrating, and/or lead to “paralysis by analysis”. This article is offered as a means to greater understanding of powermeter metrics - in particular, the basic Stryd metrics.
Thus, this article will cover the metrics that Stryd currently offers on their training platform, Stryd Powercenter:
- Power
- Form Power
- Pace, Distance, Time
- Elevation
- Cadence
- Ground contact time
- Vertical Oscillation
- Leg Spring Stiffness
Power
Let’s start here. After all, having the ability to collect and act on power data should be the primary reason for owning a powermeter. Power is a measure of work done over time - of effort. Power, reported in Watts, is the closest measure of what is going on metabolically to produce movement.
Real-time Power
On your watch, power is displayed in a manner that you are generally able to configure - 3s rolling average, 10s rolling average, 30s rolling average, and lap power. Each runner may have their own preference, but my suggestion is to use lap power (manual lap - turn off autolap). Alternatively, with Suunto watches, AppBuilder for Garmin watches, and Powerdashboard for Stryd plus on higher end Garmin watches, you can even configure the watch screen to show both 3s rolling average, and lap power concurrently. Further, there are apps like PowerRace, Powerdashboard for Stryd plus, and Powerdashboard for Stryd plus, for 10 zones that will support your watch providing you with alerts if you drift outside of your selected power target range.
Whether you use these alerts, or simply operate from a glance at your watch to check power, power allows the user to more properly “pace” training efforts and races. In this regard, power works handily with your onboard supercomputer, aka RPE (rating of perceived exertion). Over time, power and RPE work together to provide the user with optimal “pacing” feedback. After all, “power calibrates RPE, RPE modulates power” (Charles Howe).
In contrast, pace (in traditional terms of distance-time relationship) can be confounded by hilly terrain, while power typically is not. Heart rate is confounded by multiple factors other than effort (caffeine, dehydration, sleep deprivation, heat, etc), while power typically is not. Further, HR lags change in effort, while power does not. Power trumps these methodologies in terms of proper “pacing”.
That said, the Stryd algorithm does not currently detect wind. This apparent Achilles heel of using Stryd to “pace” is mitigated by that fact a) that winds have to be rather strong to significantly impact reported power and b) many running routes have relatively symmetric exposure to headwinds and tailwinds. In heavy headwinds, the runner might resort to RPE, or simply lower target power (Stryd under-reports power in strong headwinds) by a handful of Watts. Conversely, in strong tailwinds, the runner might raise target power (Stryd over-reports power in strong tailwinds) by a handful of Watts.
Further, power can be impacted by environmental conditions such as heat or altitude. However, with either heat or altitude, power targets can be adjusted by fairly predictable rates of degradation of power in humans when exposed to these environmental conditions. In this way, the value of using power for “pacing” can be retained.
Power targets for training
For training, a runner or coach can define training target ranges based on a) training zones (Table 1), b) knowledge of the runners personal power-duration curve (Figure 1), c) known race power, or d) test results over specific key durations (although, to be frank, c) and d) are really just b) by a different name).
Table 1. Example of training zones - Palladino Power Project Run Training Zones
Zone 1 | Easy Running | |||
1A | Post Interval Recovery | Easy recovery between intervals and cool-down | 50-65% of FTP / CP | |
1B | EZ Warm-Up | Easy warm-up component before intervals or racing | 65-75% of FTP / CP | |
1C | EZ Aerobic Running | Easy Aerobic Runs | 75-80% of FTP / CP | |
Zone 2 | Endurance / Long Run | Typically, average power for long runs / overdistance (or sustained runs with higher intensity mixed in) Otherwise a grey zone for more standard lengthen aerobic runs. | 81 to 87% of FTP / CP | |
Zone 3 | Threshold Stimulus | |||
3A | Extensive Threshold Stimulus | Sweet spot running. Tempo runs. Generally, sustained effort runs executed at the lower percentages of FTP, or, long (>=15 minute) intervals at the higher percentages of FTP within this zone. | 88-94% of FTP / CP | |
3B | Intensive Threshold Stimulus | Threshold work. Longer intervals and occasionally, sustained effort running. | 95-101% of FTP / CP | |
Zone 4 | Supra Threshold | Suprathreshold work. Generally intervals. | 102-105% of FTP / CP | |
Zone 5 | Maximal Aerobic Power Stimulus | Max aerobic work. Typically intervals (or occasional ‘time’ trials). | 106%-116% of FTP / CP | |
Zone 6 | Anaerobic Power Stimulus | Anaerobic work. Short intervals or short time trials | 117-150% of FTP / CP | |
Zone 7 | Sprint / Maximal Power | Maximal Power. Sprints. | >150% of FTP / CP |
Figure 1a. Example of an individual’s power duration curve.
X-axis = duration (logarithmic scaling), y-axis = maximal sustainable power.
Note that maximal sustainable power for any given duration forms a typical power-duration curve, in which high power occupies the far left (short duration), then tends to flatten in the 5 minute to nearly one hour portion of the graph, then tapers off to lower power on the far right (long duration beyond an hour).

Figure 1b. Example of an individual’s power duration curve - with Zone demarcations.

Largely because races from 5K to marathon are executed at Functional Threshold Power (FTP) +/- 10%, training zones and most training training prescriptions can be reliably anchored to the individual’s FTP (or critical power - CP).
Generally, when prescribing a training target for sustained or interval training, a target range of 5W is specific enough for training stimulus purposes, yet broad enough to allow flexibility for the runner to stay within the target range. For most individuals, a range of 5W is about 2% of FTP/CP or less.
Training targets must be associated with a duration in order for the prescription to provide an appropriate training stimulus. Generally, the higher the power prescription, the shorter the duration prescription. Carried over the breadth of the power-duration curve or range of training zones, lower power is generally associated with continuous running, while higher power is often prescribed in inversely proportional interval durations. A continuous tempo run of 90-92% of FTP might be held for an hour. Tempo involving power at 94-96% of FTP might be prescribed as 2x 20 minutes (3 minute recoveries). Power at 98-100% of FTP might be prescribed as 4x 8 minutes or 3x 10 minutes (3 minute recoveries). Power at 100-102% of FTP might be prescribed as 6x 5 minutes (3 minute recoveries). Power of 104-106% of FTP might be prescribed as 6x 3 minutes (3-4 minute recoveries). Etcetera.
I should emphasize that simple time in zones parsing offered by various apps do not equate with "stimulus provided". A 10s foray into zone 4 is placed in the zone 4 bucket, but is far from providing an adequate stimulus towards FTP development or FTP fatigue resistance. Use “time in zones” charts for general feel of Training Load Distribution, realizing that they cannot perfectly reflect the training stimulus provided.
Power targets for racing
A runner’s power duration curve also plays a key role in the various powers that are possible at various race distances. Calculators and webinars are available to assist the runner in determining appropriate power targets for upcoming races.
Functional Threshold Power or Critical Power
Understanding the concepts of Functional Threshold Power (FTP) and Critical Power (CP) is important for the power user. I refer the reader to the article Running Functional Threshold Power - A Primer for a more detailed coverage of the topic.
FTP is the highest power that a runner can maintain in a quasi-steady state without fatiguing, where the duration may range from 30-70 minutes, depending on the individual. The primary error of assumption regarding FTP is that FTP is equivalent to average power over a maximal 60 minute effort. FTP was never defined this way, or certainly not intended to be defined this way.
Another common error is the assumption that CP = FTP. Both metrics reflect very similar physiologic states, and the terms are often used interchangeably. Nevertheless, for various reasons, it is not unusual that calculated CP does not equal estimated FTP. This is not to say that the two are not often close in value. Hill states that “exhaustion occurs after about 30 to 60 minutes of exercise at CP”.
Because running training zones and training prescriptions are often anchored to FTP/CP, it is important for the power user to not only understand the concepts, but know how and when to estimate FTP/CP.
Reading a power file
Power outdoors, over ground is rather stochastic. (Figure 2) On a treadmill, it is less so. (Figure 3)
Figure 2. The stochastic nature of power when running outdoors, over ground.
An 8.3 mile run. Elevation changes in grey. Power on the y-axis, time on the x-axis. Power recording in yellow. Note how variable, or stochastic, power can be. Pace in blue.
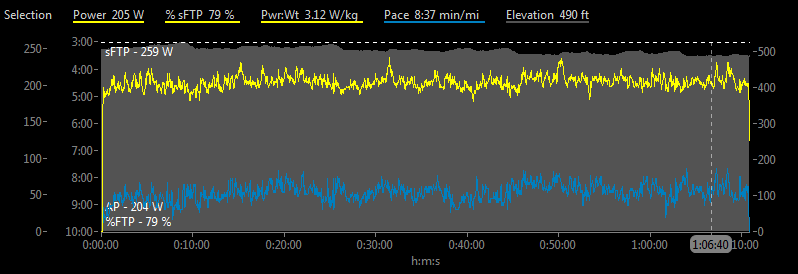
Figure 3. Treadmill running is less stochastic.
An 8.3 mile run. Power on the y-axis, time on the x-axis. Power recording in yellow. Note that power is less variable, or stochastic, than with over-ground running seen in Figure 2. Pace in blue.
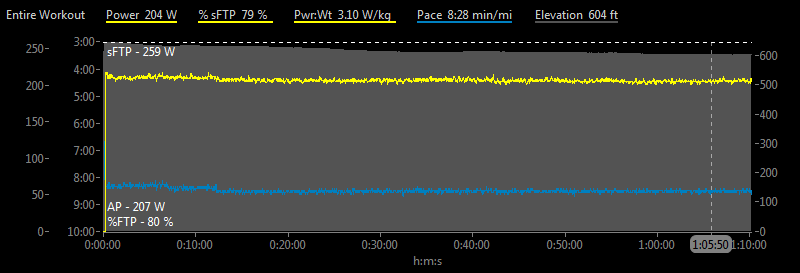
Because power is stochastic, it is often helpful to analyze a power file from the perspective of averages. In a way, this is similar to setting a watch to display 10s rolling average power, 30s rolling average power, or even lap power. Thus, when comparing Figure 2 and Figure 3, one can see average power (AP) in the lower left. The average power of these two runs is only 3W apart. They look different, but the training stimulus is very similar - the run in Figure 2 was executed at 79% of FTP and the run in Figure 3 was executed at 80% of FTP - both at the top of Zone 1c.
The same approach, analyzing averages, also applies to interval training. Figure 4 shows interval training - 4x 8:30 intervals prescribed at 98-100% of FTP, with 3 minute recoveries. But what did the runner actually execute? The answer lies in looking at the averages of each interval segment (or laps, if manually started and stopped on the watch file*). When each interval average was obtained, it was revealed that the runner averaged, respectively, 98%, 99%, 99%, and 98% of FTP - a very good interval session falling entirely within target range.
*(For interval training, I recommend that you turn autolap off, and use manual laps)
Figure 4. Interval training.
Depicted is a 10 mile run in which the runner did 4x ~50m accelerations during the warm-up phase. The runner then ran 4x 8:30 intervals with 3 minute recoveries.
Power on the y-axis, time on the x-axis. Power recording in yellow. Pace in blue.
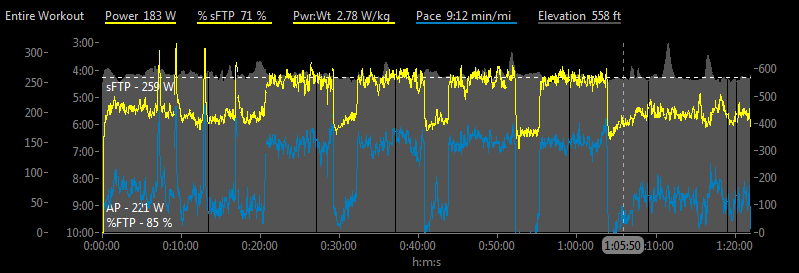
Analyzing a power file can also reveal fatigue - especially in races. (Figure 5) A decline of power is a late stage indicator of fatigue. In some cases, changes in the power tracing may be too subtle to demonstrate obvious fatigue. In these latter cases, looking at the average power for the second half of a race relative to the first half of a race can be a more objective indicator of fatigue.
Figure 5. Fatigue depicted in half marathon power file.
Note that power diminished after the 1:16 mark in the half marathon. A decline of power is a late stage indicator of fatigue.
Power on the y-axis, time on the x-axis. Power recording in yellow. Pace in blue.

Caution: Comparing Power Figures
It is important to understand that when comparing two runners, a raw power value, as Stryd reports, is a relative number. It is often misleading to compare a raw power value without some normalization or perspective.
First, it is important to normalize power to weight (W/kg) when making comparisons. A 300W for a runner weighing 65kg is not the same as 300W for a runner weighing 80kg. The former is 4.62 W/kg, while the latter is 3.75 W/kg. Comparing raw Watts is useless.
Second, it is important to compare power at same (or very similar) durations. Sustainable power for 10 minutes is not comparable to sustainable power for 40 minutes. Compare apples to apples. Thus, compare W/kg at 20 minutes, or W/kg at 5 minutes, or even W/kg at CP/FTP.
For example:

Caution: runners are not equally effective in converting power to speed
Runners differ in how effective they convert power to speed - called Running Effectiveness. Running Effectiveness is not a basic Stryd metric, so it will not be detailed here. Nevertheless, it is worthwhile knowing a few things about this important metric:
- Running Effectiveness (RE) is the ratio of speed to power: RE = speed in m/s divided by power in W/kg.
- The higher one’s RE, the more effective one is at converting power to speed.
- How fast someone runs a race is a product of both, average power in W/kg, and RE. Two 75kg runners execute a marathon at 300W or 4.00 W/kg. Runner 1 executes the marathon with a RE of 0.97 and runner 2 executes the same race in 1.00. Runner 1 runs 3:01:15, and runner 2 runs 2:55:49.
- To run faster for any given given distance, you have to a) improve your W/kg, or b) improve your Running Effectiveness (how effective you convert power to speed), or c) both.
That said, improving your W/kg over a given duration is far easier to do than improving your Running Effectiveness.
Improving Running Effectiveness is possible, but typically will be a gradual, slow process, and not of a great magnitude - an improvement of 1% for similar conditions and duration is awesome, and seeing a runner improve Running Effectiveness (over similar conditions and duration) by 2% in a one to two year period would be uncommon.
On the other hand, I have seen multiple runners improve their W/kg over a given duration by 3 - 13% over a few months.
Fortunately, I have not yet seen Running Effectiveness regress in any runner that is training reasonably consistently.
Therefore, you stand a much better chance of improving your speed by a greater magnitude by improving your W/kg for a given duration, than you do by improving your "efficiency" in terms of speed to power ratio (Running Effectiveness).
It has been said, focus on improving your W/kg, and speed will follow. Very true.
Your Stryd weight setting and power
Stryd natively computes power in W/kg and then calculates raw power based on your input weight. On consecutive runs, you could run the same course, at the same intensity, and simply by increasing your weight setting in the second run, see a higher average power than for the first run with a lower weight setting. Did your power really change? Nope. In these two runs, if you calculated W/kg using the respective weight settings, the W/kg would be the same.
If you never changed weight in the Stryd app and pod, your W/kg (Stryd raw power / Stryd weight) will always remain correct. ….regardless of your true weight!
If you do change weight in Stryd, you then have to adjust 1) target powers 2) training zones and 3) existing CP value by weight scaling -> (new Stryd weight / old Stryd weight)*power. I have routinely performed these scaling adjustments for athletes that I coach when weight change is > about 2kg.
However, I am changing my opinion, and now feel that it is best to set the Stryd at your most common weight, and leave it there.....period. In this case, your power values remain comparable over time, and will always remain correct in terms of W/kg (Stryd raw power / Stryd weight). Also in this case, you need only to change target powers and training zones when CP/FTP actually changes.
Form Power
External power (the power the Stryd reports) can be broken down and even analyzed by its various components. Andrew Coggan, PhD was the first to present a methodology for analysis of power components from in-the-field athlete power data generated by Stryd running powermeter.
Dr Coggan originally presented the graphic in Figure 6, wherein he depicts his adaptation of a graphic developed by Hoogkamer, Taboga, and Kram, which depicts the various metabolic costs of running and their corresponding power components.
Figure 6. Metabolic costs of running and their corresponding power components.
(from Andrew coggan, PhD, adapted from Hoogkamer, Taboga, and Kram)
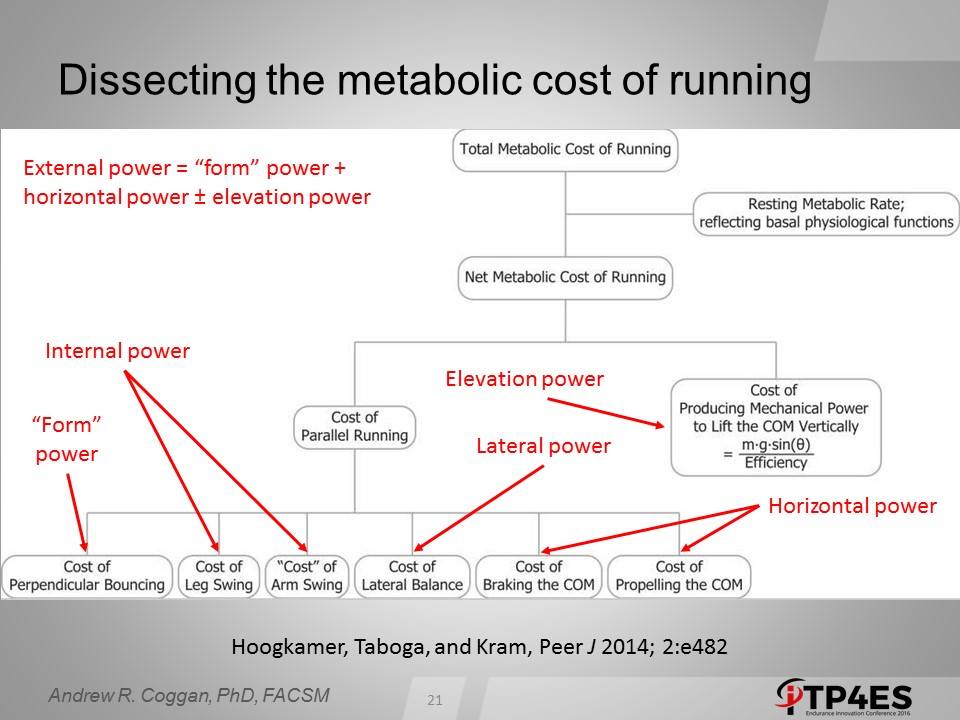
Stryd power is representative of External Power - the power / metabolic cost of moving the center of mass. In contrast, Internal Power is the power / metabolic cost of moving the upper and lower extremities relative to the center of mass (leg swing and arm swing). External Power (aka Stryd Power) + Internal Power = Total Power.
Since Stryd reports the External Power component of total power, let’s focus a bit more on that. External Power (Stryd Power) can be further broken into components of Horizontal Power, Oscillatory Power, and Elevation Power. Stryd’s Form Power is their own computation of the Oscillatory Power component.
Form Power is the component of power / metabolic cost of oscillating the center of mass up and down vertically (vertical bouncing) as the runner moves forward. The greater amount of External Power (Stryd Power) directed to generating vertical oscillation, the greater amount of Form Power.
In contrast, Horizontal Power is the component of power / metabolic cost of moving the center of mass forward horizontally, or longitudinally along the line of progression. Within limits, the greater the percentage of External Power (Stryd Power) devoted to Horizontal Power, the more effective the External Power is at moving the center of mass forward.
Elevation Power is the component of power / metabolic cost of elevating the center of mass vertically up a hill or incline. On flat terrain, Elevation Power is nil. Therefore, on flat terrain, External Power (Stryd Power) has two primary components: Horizontal Power and Form Power.
In other words, on flat terrain,
External Power (Stryd Power) = Horizontal Power + Form Power
Powercenter reports only raw Form Power. You can easily calculate Horizontal Power though.
Horizontal Power = External Power (Stryd Power) - Form Power
Horizontal Power correlates positively with speed. Form Power correlates negatively with speed. Therefore, in my mind, improving Horizontal Power is an important component of improving speed. Others may look at it from the opposite perspective and say that minimizing Form Power is desirable. On flat terrain, these perspectives are essentially saying the same thing.
In general, Form Power that is relatively lower is better. In other words, it is essential to interpret raw Form Power relative to Stryd Power (External Power). Thus, the metric Form Power Ratio (Form Power / Stryd Power) is superior over raw Form Power for analytic purposes. One should also interpret Horizontal Power in the same way - relative to Stryd Power. Horizontal Power Ratio is (Stryd Power - Form Power) / (Stryd Power). Interpreting Form Power as a raw value can be misleading and should generally be avoided - see example in Table 2.
Table 2. Example of potential for raw form power interpretation error.
If Stryd power goes up, Form Power does tend to follow….to some degree. Like this: a runner that is running at 280W with a form power of 71W increases effort and then runs 310W with a form power of 74W. Form power went up – that’s not good, right? In this case, incorrect. Earlier, the runner had a Form Power Ratio (FPR) of 25% and a Horizontal Hower Ratio (HPR) of 75%. Later, the runner had a FPR of 24% and HPR of 76%. When the runner ran with greater intensity, HPR and FPR improved (HPR increased and FPR decreased) – even though raw form power had increased. This is rather typical - even though raw Form Power may be seen to increase with increased intensity, the relative amount of power devoted to bouncing the center of mass up and down vertically as the center of mass moves forward (Form Power Ratio) actually declines (and HPR increases). |
It is best to interpret Form Power as a percentage of Stryd power, called Form Power Ratio (FPR):
FPR = Form Power / Stryd power
FPR Sensitivity to Relative Intensity
When interpreting Form Power using Form Power Ratio (FPR), a lower percentage is better - see Table 3. However, FPR is sensitive to intensity - FPR decreases as you run at higher intensity / faster. Therefore, when interpreting FPR, it is best to compare across similar intensities and terrain. Note that Table 3 percentages are to be applied to running on relatively flat terrain and an intensity near FTP.
Comparison Across Runners
Comparing raw Form Power across runners is useless. However, comparing Form Power as a relative metric, Form Power Ratio (FPR), allows comparison across runners - with the caveat that the comparisons are made at similar intensities, whether across similar race distances, or similar maximal power-duration relationship, or similar percentage of FTP.
FPR and Fatigue
FPR tends to rise with fatigue. On the other hand, interpreting raw Form Power in a fatiguing scenario can be corrupted by what might be happening with Stryd power - one might see raw Form Power increase or decrease. With FPR, interpretation is clear - FPR increases in a fatiguing scenario. In fact, increasing FPR may be an earlier indicator of fatigue than is declining Stryd Power.
Table 3. Interpreting Form Power using Form Power Ratio (FPR) - controlling for intensity and terrain
FPR @ FTP on relatively flat terrain >25% is below average 23-25% is near average <23% is good <20% is likely the realm of elite world class runners |
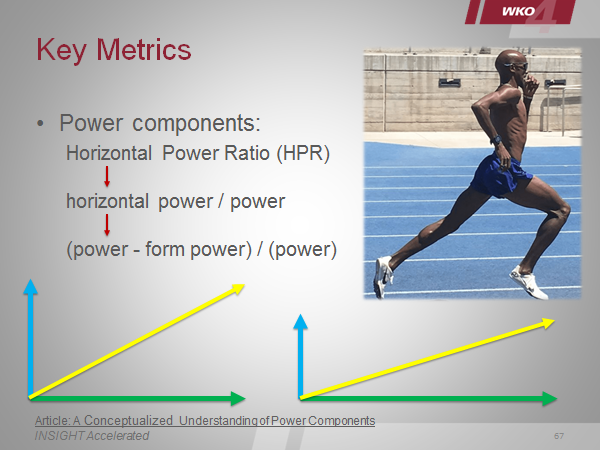
Of course, if I had my ‘druthers, I’d follow HPR instead of FPR. (Figure 7) On flat terrain, HPR is the reciprocal of FPR. A greater HPR is correlated with higher speed. After all, more speed is what we are after.
HPR = (Stryd power - Form Power) / Stryd power
Figure 7. A conceptual, vectorized depiction of Horizontal Power Ratio.
The greater the horizontal vector of external power, the greater relative power devoted to moving the center of mass forward horizontally, and the greater proportion of external power devoted to producing longitudinal speed. HPR reflects the horizontal vector of external power.
Pace, Distance, Time
Stryd Powercenter also reports pace, distance and time. These are well known metrics, and I will not spend much time discussing them. However, the are few points to make:
- As mention just above, speed (and pace) is a product of both, power and Running Effectiveness. Many runners new to power miss this point and become confused on the relationship between power and speed (and pace) - the specific relationship is not the same across runners, since Running Effectiveness varies across runners.
- While Stryd is typically accurate in reporting distance run (and thus pace), it is nevertheless, worthwhile checking calibration on a 400m track. On your watch, turn autocalibration off. Turn off distance from GPS. Start with calibration set to 100. Check calibration at the track, comparing actual distance vs reported distance. Change calibration factor accordingly. Arriving at an accurate distance recording assures that pace, speed, and Running Effectiveness are reasonably accurate.
- Also as mentioned earlier, for pacing, power is superior to pace on terrain that is rolling/hilly.
Elevation
I also will not spend much time in discussing elevation. Stryd’s elevation data is generated from a barometric altimeter (assuming that it is not overridden by GPS-determined elevation). Dramatic barometric changes during a run may impact the accuracy of Stryd-reported elevation.
Many metrics are sensitive to varying degrees to grade, so interpretation of many metrics should include an understanding of their relationship to grade. For example, at isopower, pace on an uphill grade will be slower than on the flat, and Running Effectiveness will be lower.
Further, knowledge of elevation relative to sea level will allow interpretation of power, since power typically progressively declines with elevation above sea level - particularly when venturing over approximately 3000 feet (900m).
Cadence
Technically, cadence would be the number of times the same foot (for example, right foot) contacts the ground over a one minute period. In this case, an average cadence might typically be in the vicinity of 90/minute. In contrast, stride rate is the number of times both feet contact the ground over a one minute period. In this latter case, an average stride rate might typically be in the vicinity of 180/minute (steps per minute). Nevertheless, the terms cadence and stride rate are often used interchangeably. Stryd reports “Cadence” as what is stride rate - the number of times each foot (both, right and left) contacts the ground over a one minute period. For purposes of presentation, I will use the term cadence as the same as stride rate.
Comparison Across Runners
It is often cited that ideal cadence should be 180 strides per minute. While most runners will typically have a cadence that is not far off of 180, ideal cadence is quite unique to each runner. Runners tend to gravitate to their most efficient cadence at a given speed. In cases where cadence is manipulated, for whatever reason, the result is not uncommonly lower efficiency - at least in the short term.
Tracking Cadence
Cadence can be tracked just like power - in some cases, real-time, as well as in post-hoc analysis, either as a tracing of cadence, or as average for cadence over the entire run or segments of the run (or laps).
Cadence Sensitivity to Speed / Relative Intensity
Cadence is sensitive to intensity or speed. Faster running, even for a given runner, is typically associated with higher cadence. Therefore, it is best to compare your cadence across similar intensities and over similar terrain - for example, cadence @ FTP on the flat, or cadence at ~90% FTP on relatively flat terrain, etc.
Cadence Relationship with Height
Cadence tends to be lower in taller individuals, and higher in shorter individuals - or, more specific than height, leg length. This adds one additional element to inter-individual variability in cadence that should be considered when comparing across individuals, or when comparing someone to a purported standard like 180 strides per minute.
Cadence and Fatigue
Cadence typically declines with fatigue.
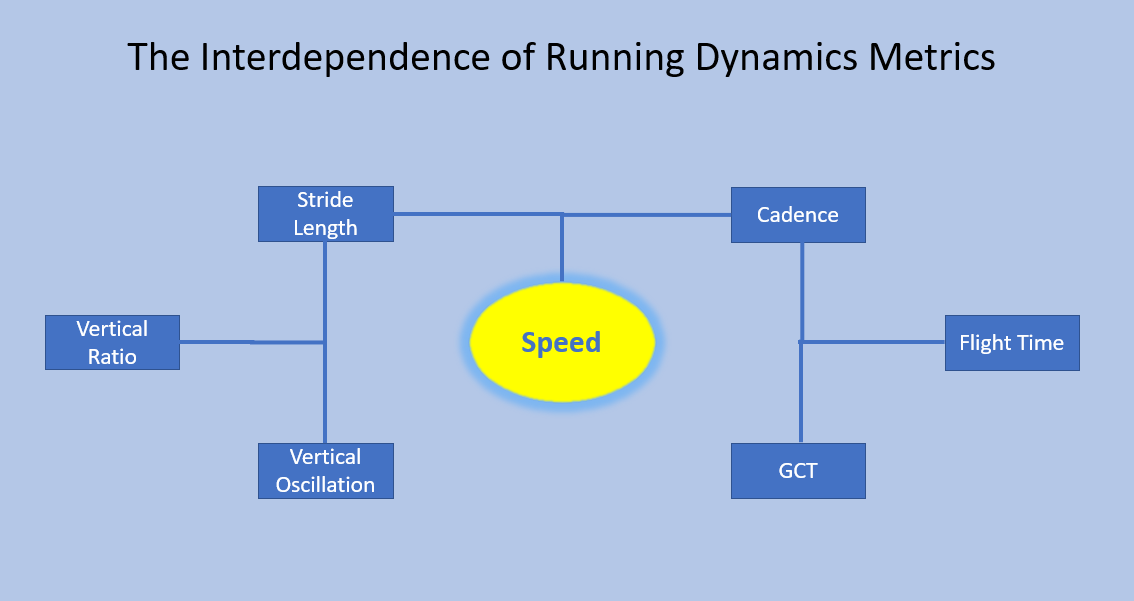
Interdependence
Cadence appears to be interdependent with other metrics. For example, at the same speed, higher cadence is associated with shorter stride length, and lower vertical oscillation - and vice versa. This relationship may account for higher injury risk with the combination of low cadence, longer stride length, and higher vertical oscillation.
Manipulating Cadence
I tend not to manipulate cadence in most cases - except for two. One case would be when a runner’s cadence is approaching 170 strides per minute at typical running speed. Here, before intervening, one must be careful to interpret cadence in light of the runner’s relative intensity, and their height (taller runners may have lower cadences). An intervention in this scenario may be prompted by injury history, among other factors.
A second case where I tend to intervene on the cadence side of metrics, is in attempting to correct fatigue patterns. Cadence tends to decline as fatigue sets in. In some runners, this is quite evident. And further, these runners may try to access speed by lengthening stride, rather than quickening cadence. It is for these fatigue coping mechanisms that I intervene and try to que the runner on quickening cadence.
Ground Contact Time (GCT)
Ground contact time (measured in milliseconds or ms), is the duration that the foot is on the ground. I have seen GCT as low as 145 ms and as high as >280 ms. Elites are typically < 200ms at marathon power or higher.
Regardless of the runner’s baseline GCT, GCT will be become shorter as the runner increases speed. It may be however, when speed is controlled across runners, that a lower GCT may be associated with a lower metabolic cost of running that speed.
Tracking GCT
Real-time tracking of GCT is not typically available. Instead, GCT is tracked in post-hoc analysis, either as a tracing of GCT, or as average for GCT over the entire run or segments of the run (or laps).
GCT Sensitivity to Speed / Relative Intensity
GCT is sensitive to intensity or speed. It is best to compare your GCT across similar intensities and over similar terrain - for example, GCT @ FTP on the flat, or GCT in a 5k race, etc.
GCT and Fatigue
GCT typically lengthens with progressing fatigue.
Interdependence
GCT may interact with leg spring stiffness. Higher leg spring stiffness may be associated with lower GCT.
Manipulating GCT
It may be that drills and plyometrics may assist in lowering GCT.
Vertical Oscillation (VertOsc)
Vertical oscillation is the measure of the up and down excursion of the body (ideally estimating the vertical oscillation of the center of mass) as the runner moves forward. The low point would occur sometime after landing, but before propulsion, while the high point would likely occur in the middle of the flight phase.
The magnitude of vertical oscillation may vary by runner height, form, and speed. I typically see values of 5cm to 9cm.
However, like most running metrics, context is important. In the case of vertical oscillation, this is best done by looking at vertical oscillation as a ratio to stride length. Vertical ratio (vertical oscillation in meters divided stride length in meters) is not provided by Powercenter, but is a good way of putting vertical oscillation in perspective. A vertical ratio of 5% of less is quite good. Like Form Power Ratio and Hortizontal Power Ratio, vertical ratio provides a glimpse of the vectorization of movement. A lower value for vertical ratio means more motion is directed horizontally, rather than being wasted vertically. Like Form Power Ratio and its reciprocal, Horizontal Power Ratio, horizontal ratio is the reciprocal of vertical ratio. Also like Horizontal Power Ratio, I prefer to follow horizontal ratio, as greater values in both measure mean more effective horizontal moment.
Comparison Across Runners
Rather than use raw vertical oscillation, it is better to use vertical ratio (or horizontal ratio) at similar intensity when comparing across runners.
Tracking Vertical Oscillation
Real-time tracking of vertical oscillation is not typically available. Instead, vertical oscillation is tracked in post-hoc analysis, either as a tracing of vertical oscillation, or as average for vertical oscillation over the entire run or segments of the run (or laps).
Vertical Oscillation Sensitivity to Speed / Relative Intensity
Vertical oscillation is somewhat sensitive to intensity or speed. Raw vertical oscillation may increase with speed, but you likely find that as speed increases, vertical ratio actually declines. It is best to compare your vertical oscillation (or vertical ratio) across similar intensities and over similar terrain..
Vertical Oscillation and Fatigue
Vertical oscillation typically increases with progressing fatigue. In a fatiguing scenario, you would also likely see vertical ratio increase.
Interdependence
As mention with cadence, vertical oscillation appears to be interdependent with other metrics. For example, at same speed, higher cadence is associated with shorter stride length, and lower vertical oscillation - and vice versa. This relationship may account for higher injury risk with the combination of low cadence, longer stride length, and higher vertical oscillation.
Manipulating Vertical Oscillation
Because of the interdepence of cadence and vertical oscillation, when trying to manipulate these metrics in runners, I’ll often use the ques of both, using quick steps and running in a room with a very low ceiling - don't bump your head.
Leg Spring Stiffness (LSS)
Leg spring stiffness may be related to physical properties of tendons (such as the Achilles tendon), ligaments and fascia structures (such as the plantar fascia), and myofascial elements. It has been proposed that on loading, during contact through midstance phase of running, these structures store elastic energy. Following midstance, through propulsion, these structures provide some elastic recoil. Hence, these structures may account for some or all of the “spring” effect captured by the metric LSS. The relationship of elastic recoil to LSS, in turn, is likely explanatory of observations that LSS correlates positively with Running Economy.
To compare LSS across runners, it is important to normalize the value to weight, hence LSS/kg. Powercenter does not report LSS/kg - only raw LSS values. However, it is easy to normalize the value using Stryd weight. LSS/kg = LSS divided by Stryd weight in kg. Based on data that I have evaluated, LSS/kg stratification may fit as follows (Table 4).
Stryd LSS reporting is specific to pod positioning, midsole stack and cushioning, and surfaces.
Table 4. Interpretation / stratification of LSS/kg.
95th percentile | 0.173 |
Above average | 0.158 |
Average | 0.143 |
Below average | 0.128 |
5th percentile | 0.113 |
Comparison Across Runners
Rather than use raw leg spring stiffness, it is better to use LSS/kg at similar intensity when comparing across runners.
Tracking Leg Spring Stiffness
Real-time tracking of leg spring stiffness is not typically available. Instead, leg spring stiffness is tracked in post-hoc analysis, either as a tracing of leg spring stiffness, or as average for leg spring stiffness over the entire run or segments of the run (or laps).
Leg Spring Stiffness Sensitivity to Speed / Relative Intensity
Leg spring stiffness is somewhat sensitive to intensity or speed. It is best to compare your leg spring stiffness across similar intensities and over similar terrain..
Leg Spring Stiffness and Fatigue
Leg spring stiffness may decrease with progressing fatigue.
Interdependence
GCT may interact with leg spring stiffness. Higher leg spring stiffness may be associated with lower GCT.
Manipulating Leg Spring Stiffness
Leg spring stiffness may be improved with plyometrics, skipping drills / jump rope, weight training, and hill running. In assessing LSS over time, comparing apples to apples is important: a) compare LSS/kg if Stryd weight setting has changed, b) since Stryd LSS reporting is specific to pod positioning, midsole stack and cushioning, and surfaces, try to compare like to like, c) consider comparing at similar relative intensity and fatigue state..
Summary
Stryd powercenter metrics are presented here to allow users to gain a deeper understanding of each metric. In turn, that understanding might be better used to interpret the metrics and facilitate improving running performance.
It is important to understand that metrics must be interpreted contextually. Table 5 demonstrates the response of the various Stryd metrics to running more intensely. Further, the metrics may be sensitive to fatigue - see Table 6. Many of the metrics are interdependent, meaning change one, and there is a likely cascade of changes manifest in other metrics. (Figure 8) Normalizing metrics where applicable (LSS/kg, Form Power Ratio & Horizontal Power Ratio, Vertical Ratio & Horizontal Ratio) allows for more clarity in interpretation, and for comparison across runners.
In the end, understanding these metrics can facilitate improved running, and reduce the frustration and paralysis by analysis that poorly understood metrics can produce. This presentation is a start. There is more to learn, but understanding the metrics to the level presented here is a stepping stone.
Table 5. Response of basic Stryd metrics to running more intensely (running faster, at high effort)
Power | increases |
Pace | faster |
Cadence | increases |
Ground Contact Time | decreases |
Vertical Oscillation | may increase or decrease (vertical ratio decreases) |
Leg Spring Stiffness | typically increases |
Form Power | decreases relatively (Form Power Ratio decreases) |
Table 6. Response of basic Stryd metrics to fatigue
Power | decreases |
Pace | slows |
Cadence | decreases |
Ground Contact Time | increases |
Vertical Oscillation | typically increases (vertical ratio increases) |
Leg Spring Stiffness | typically decreases |
Form Power | Increases relatively (Form Power Ratio increases) |
Figure 8. Interdependence of Stryd metrics.
Additional Reading
Dr. Coggan's 'WKO4: New Metrics for Running With Power'
Stryd Podcast: Episode 3: Understanding Powermeter Metrics (with Evan Schwartz)
More on Leg Spring Stiffness:
Leg Spring Stiffness - Response to Plyometrics in Distance Runners?
Leg Spring Stiffness and Hills
Leg Spring Stiffness and Running Surface
Leg Spring Stiffness and Static Stretching in Distance Runners