Sound of Rainbow - Final Documentation
Barry Wang, Jannie Zhou
Abstract
This is the documentation for the final project of a DIY music visualization speaker project for the course Working With Elections in Spring 2020. It includes the complete process from design thinking, preliminary experiments, researches, prototyping, and debugging process all the way to the completion and reflection of the project.
Keywords
Speaker, Audio Visualization, VU Meter, Amplifier.
Introduction
When we think about the concept of electrons, we tend to think more about how it looks, what are the scientific properties they have. Seldom did we start from the relationship between electrons and sounds. This is a starting point of this project as we will discover how we could reveal the relationship between them, and carry out an actual project reflecting their relationship.
Ideas
We researched in this field and found three major ideas that intrigued us:
- DIY Theremin
- DIY Music Keyboard w/ 555 Timer
- LED VU (Volume Unit) Meter
We combined these ideas and formed our own design: a speaker with a VU meter for both daily use and an aesthetic representation of the relationship between electrons and audio. The design thinking and decisions will be introduced in detail in the parts below.
Maxwell Equations & Design Thinking
The starting point of this project is a speaker, which is one of the most common applications of electromagnetic theory. The principle behind the speaker is that there is a coil attached to the diaphragm of the speaker. And there is a magnet placed just near the coil. When there is current flowing through the coil, according to the fact that flowing current can generate a magnetic field, the magnetic field of the coil and that of the magnet will attract or repel each other. This force will thus generate minute vibration on the diaphragm, which then generates the sound that we can hear. This process can be quantified by one Maxwell equation:

In this case, the change of the current will cause changes of and . In a very short time period, with a fixed length coil, this change will cause the change of the magnetic field intensity (H field), which then causes the applied force between the coil and the magnet to change.


However, all these processes are happening in an invisible way. And this is the issue that we would like to focus on in our project. We would like to build a model that can visualize this process. We took a deep look at this whole process and discovered that, when the sound is generated, the loudness is related to the strength of the current that is flowing through the coil. So we came up with the idea of creating a VU meter that is composed of LEDs to partially represent this magnificent electromagnetic phenomenon.
Design an Experiment
Our initial idea of interest lies within the music area. For the speaker part, we have the signal of the audio already, so we decided to do something with it. Then we designed the circuit for the music visualization part, integrating multiple LEDs, capacitors, a certain type of chip and transistors, to achieve the effect of illuminating the LED in response to the volume of the audio signal.
As an observer, in this experiment, we could feel the music in a different way. Not only do we hear it, but also we could "see" the music with the performance of our LEDs. Imagine if you are going to describe to a blind person of music, what approaches will you choose? Imagine if the music is not only about the hearing, but also something you could see, you could touch and feel? Our project aims to express music in multiple ways, deploying Maxwell's equation. And in this experiment, we only want to test how people understand music and change their perception of music.
In another way around, from the observer's point of view, we could see the LEDs going on and off. But if it's not played with the music, how would you understand that? How could people's perception of only the visuals be altered accompanied by sounds?
Overall, we just want to pose the question of connected senses, connecting hearing with seeing, touching, or feeling. How will you transcend the boundary of a particular sense, what would be the result? These are all the things we are trying to gain a better understanding of through this project.
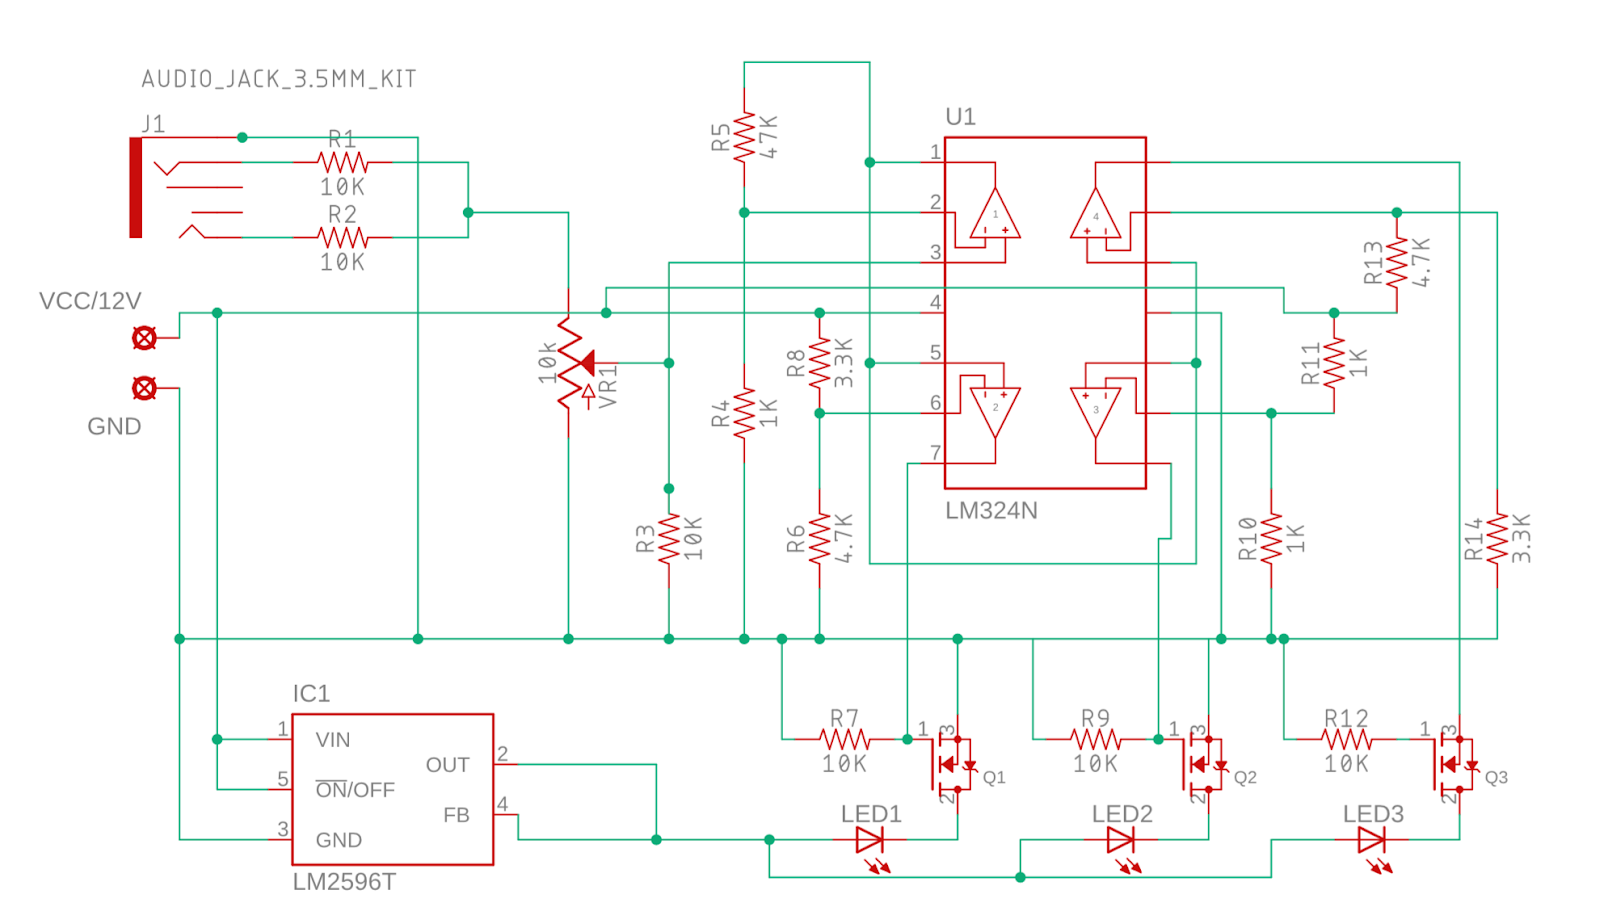
To start off, we drew some inspiration and also gained tremendous support from the artist GreatScott on YouTube. On that basis, we set up a test circuit as you can see in Figure 1. We developed the minimum test case for the circuit to make sure it works as we expected. At the minimum, everything maintains the same principle as the complete diagram that we would be following. The components included are:
- 2 x LM324 Amplifiers
- 1 x Voltage Regulator
- 7 x IRFD220 N-Channel MOSFETs
- 7 x LEDs (One for each row)
- 1 x 4Ω8W Speaker
- 1 x 3.5mm Audio Jack
- Resistors
Figure 1. The test circuit we built in EAGLE.
Purpose of Experiments
To avoid unexpected situations in the production of the
final project, these testing and experiments are necessary because troubleshooting under the actual project takes more time and might even lead to other potential risks. The experiments we’ve conducted mainly contain two parts, one is fabrication-wise experiments and circuit-wise experiments. For the fabrication-wise experiments, since we want our final project to be aesthetically pleasing, we need to make sure that the outcome has a proper appearance. This requires us to place every single component in a position where it doesn't generate the sense of violation. As you can observe from the evidence part below, we tried to draft on the perfboard with different combinations and solutions to select the best one.
We build up this minimum test circuit to verify our design of the circuit and try to find out some errors or issues. We find out that our selection of the resistors that are used to filter the signal is too big for phones as audio sources. These 10K Ω resistors are applied for an input source of peak voltage at around 1.5V. Jannie and I measured our audio sources and discovered the peak output voltage is around 0.3V. Even though the volume on the phone is already at its maximum, it was still not enough to power all the LEDs. Let alone if we want to reduce power consumption on the phone.
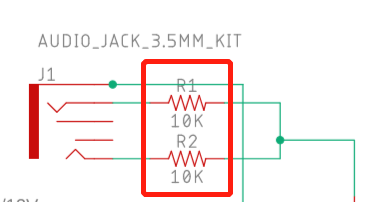
Figure 2. The two resistors shrink the input signal range.
To sort that out, we removed these two 10KΩ resistors. With the new value, we bring them into the LM324 op-amp circuit to calculate whether it is correct to make the whole circuit work. As we mentioned above, we want to reduce the power consumption on mobile devices by reducing the volume to around 50%. That lowers the voltage of the audio signal to around 0.15V. Since the LED array we are using has 7 lines, we want to control our amplified signal voltage around 7V.
In the LM324, we applied a non-inverting op-amp to the audio signal. With our current resistors setup, the total gain of the audio signal is 48, as you can see from figure 3 below. We multiply 48 by 0.15V, which gives us 7.2V, just over the voltage we need.
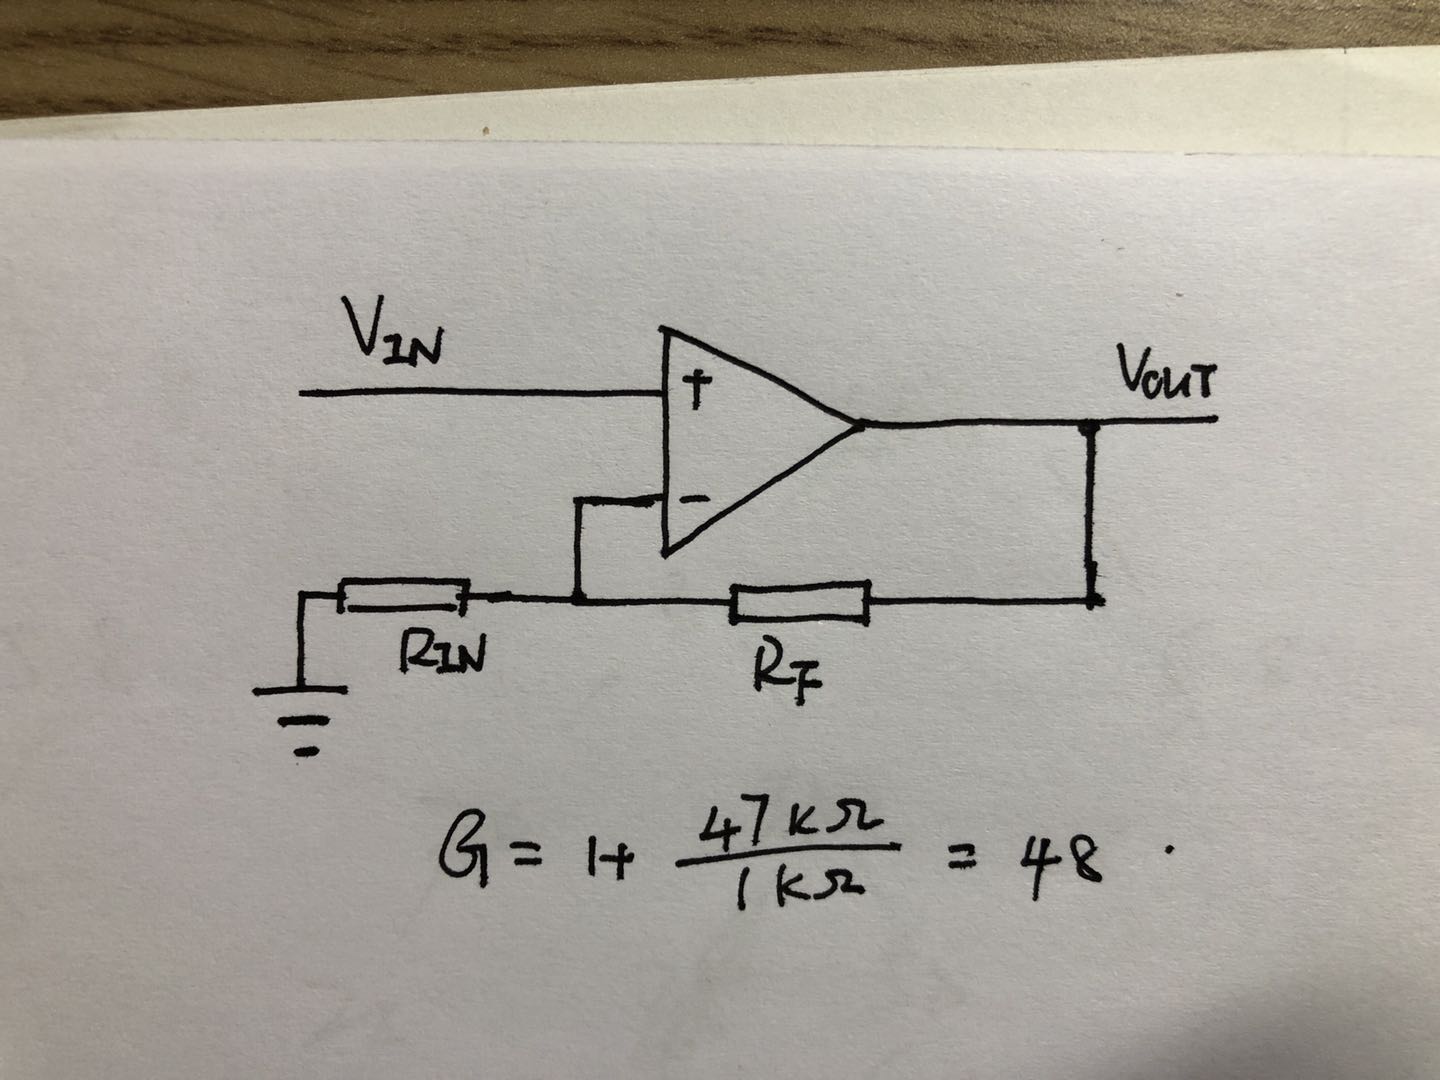
Figure 3. The amplification of audio signals.
Evidence
When we received the materials, we measured the size of all the components and the pins that one component would take up to decide what size of perfboards we'll need.
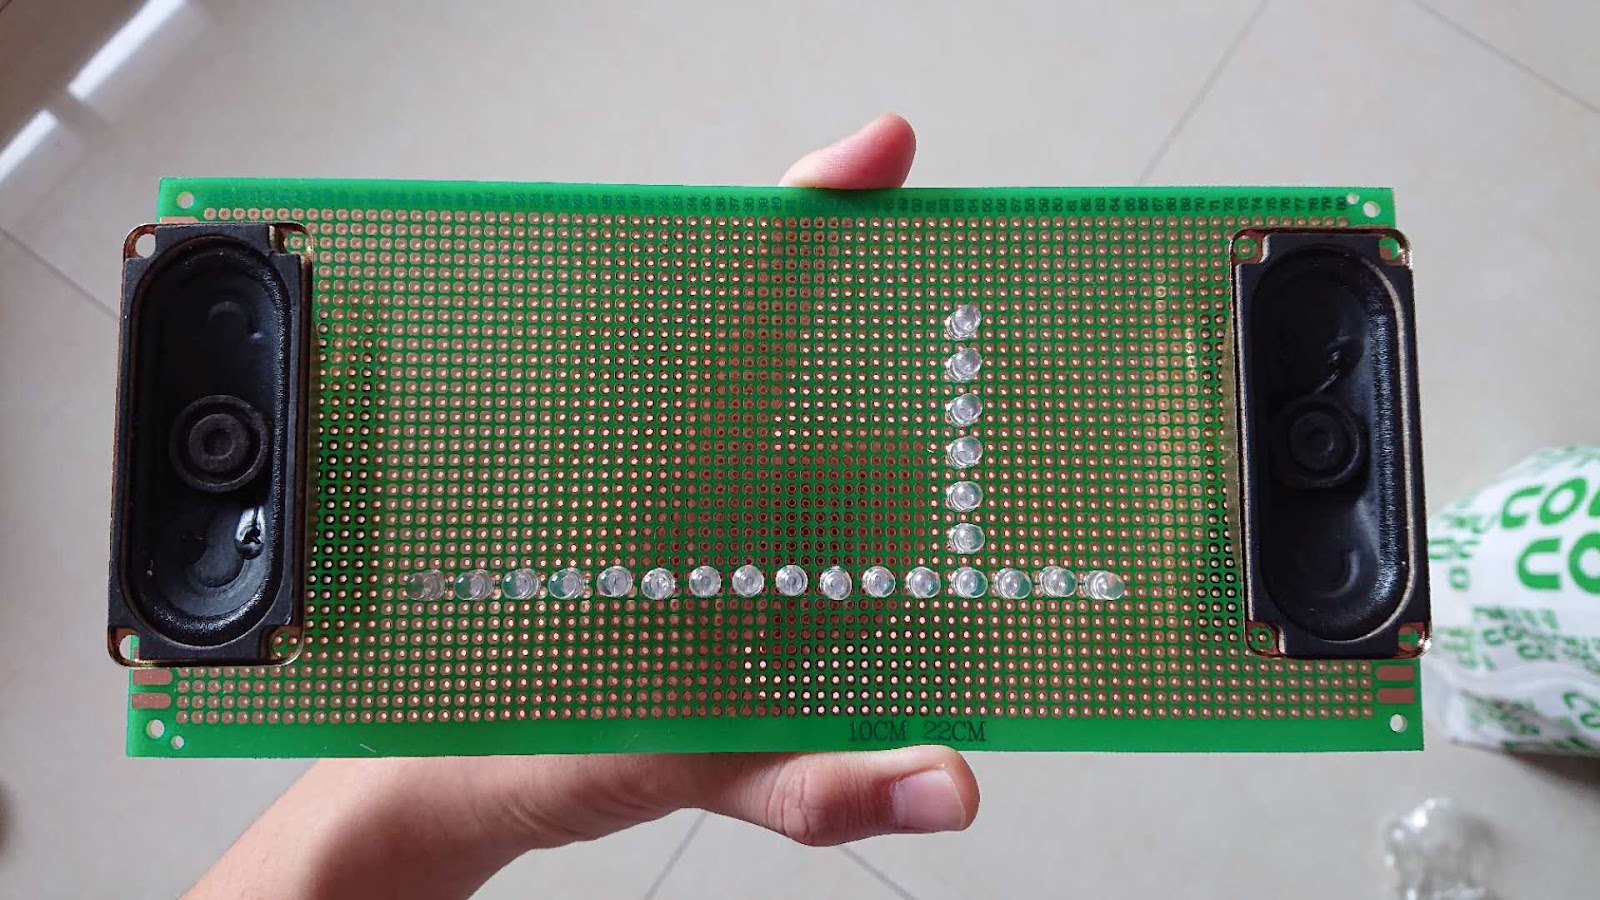
Figure 4. After measuring these components, we put them on the perfboard to finalize our design.
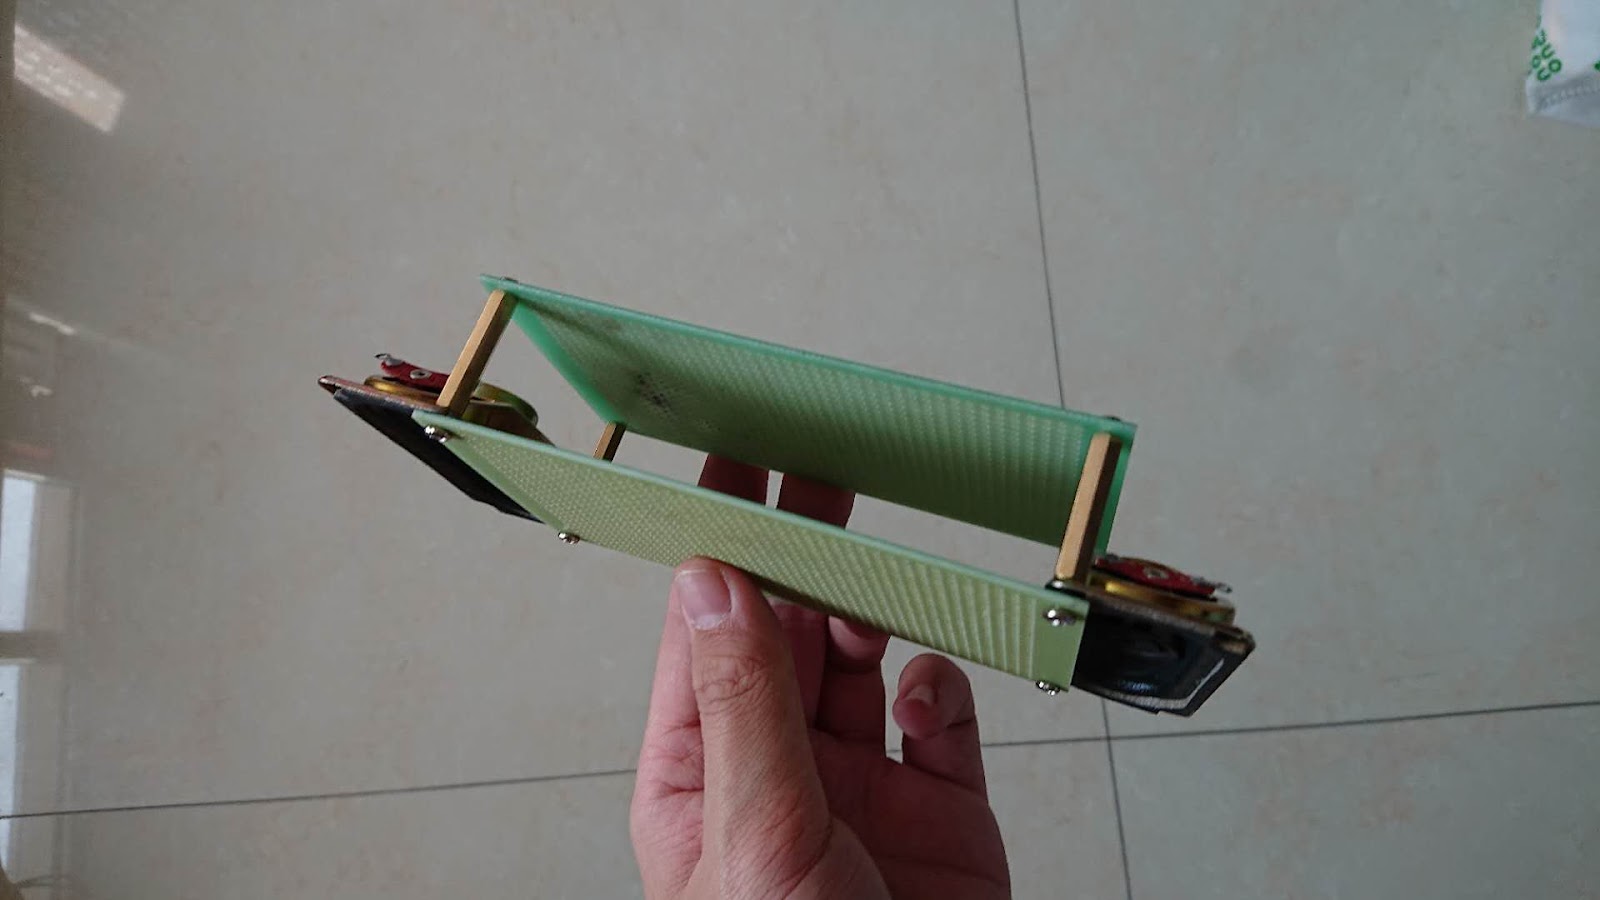
Figure 5. We use four bolts to connect the board of LEDs and the components.
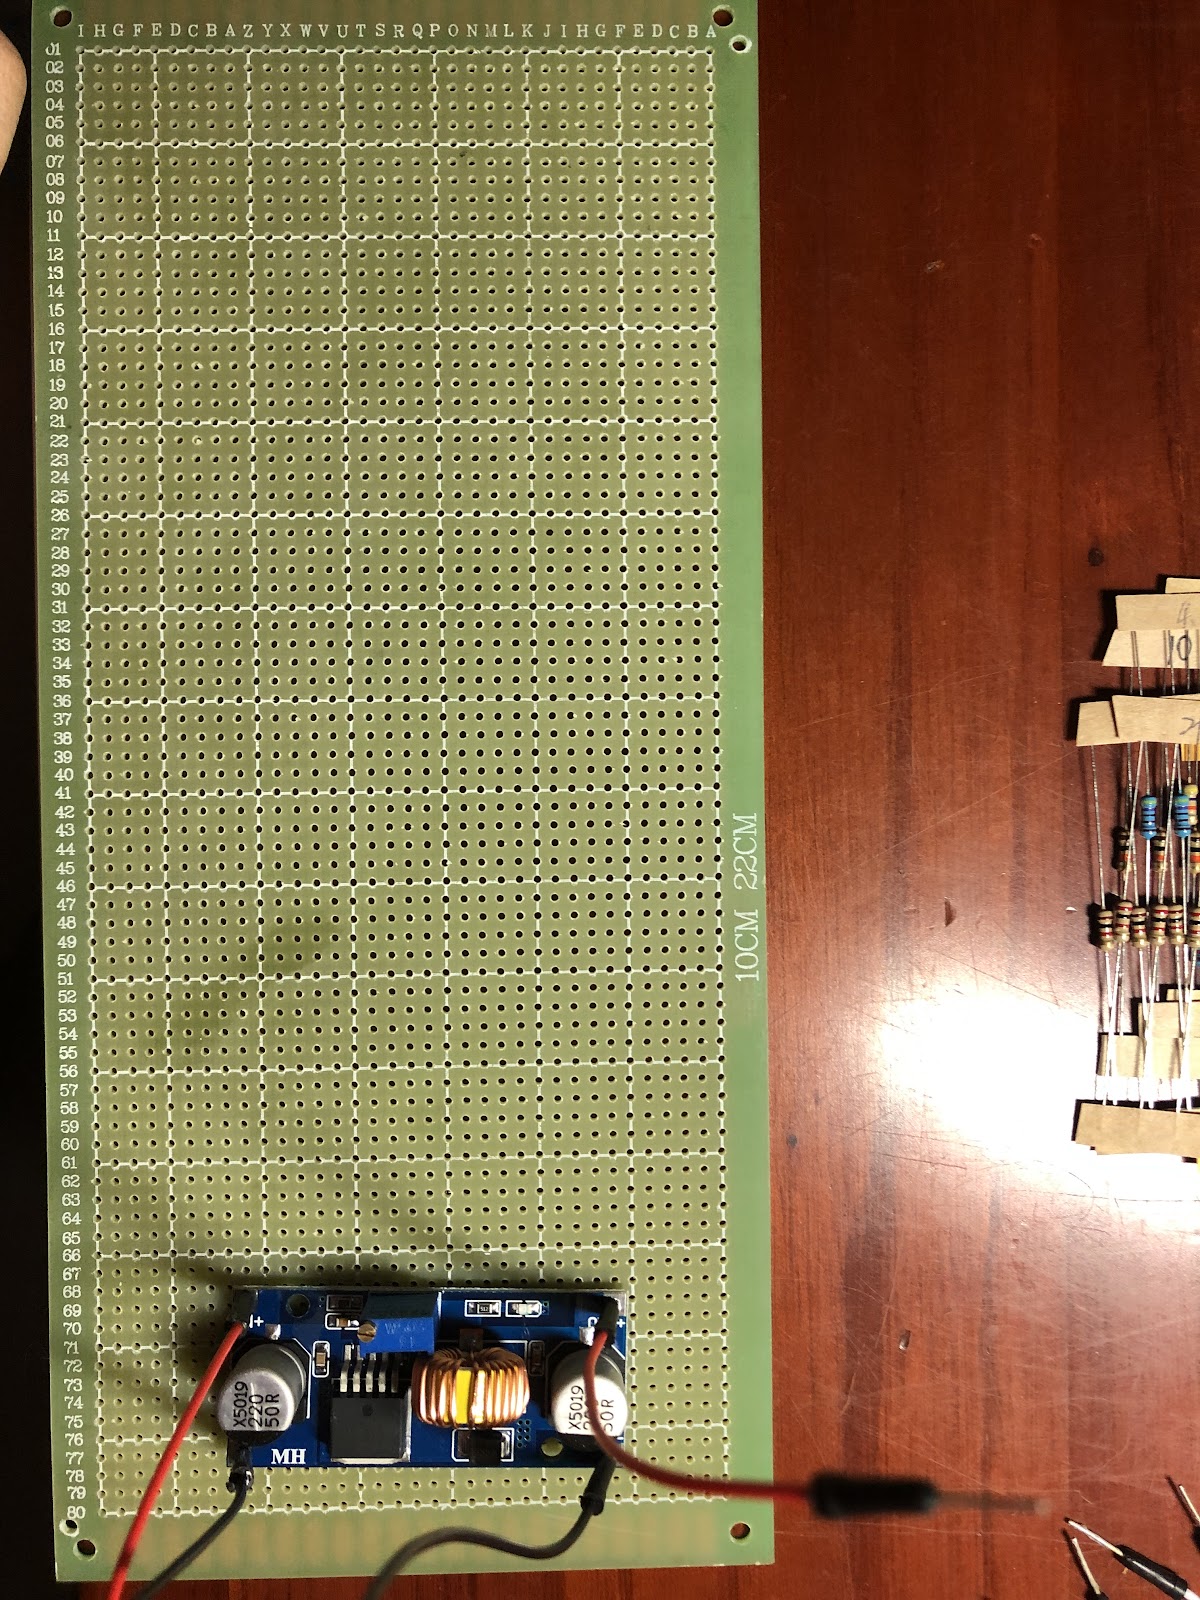
Figure 6. The size of the voltage converter module compared with the perfboard.
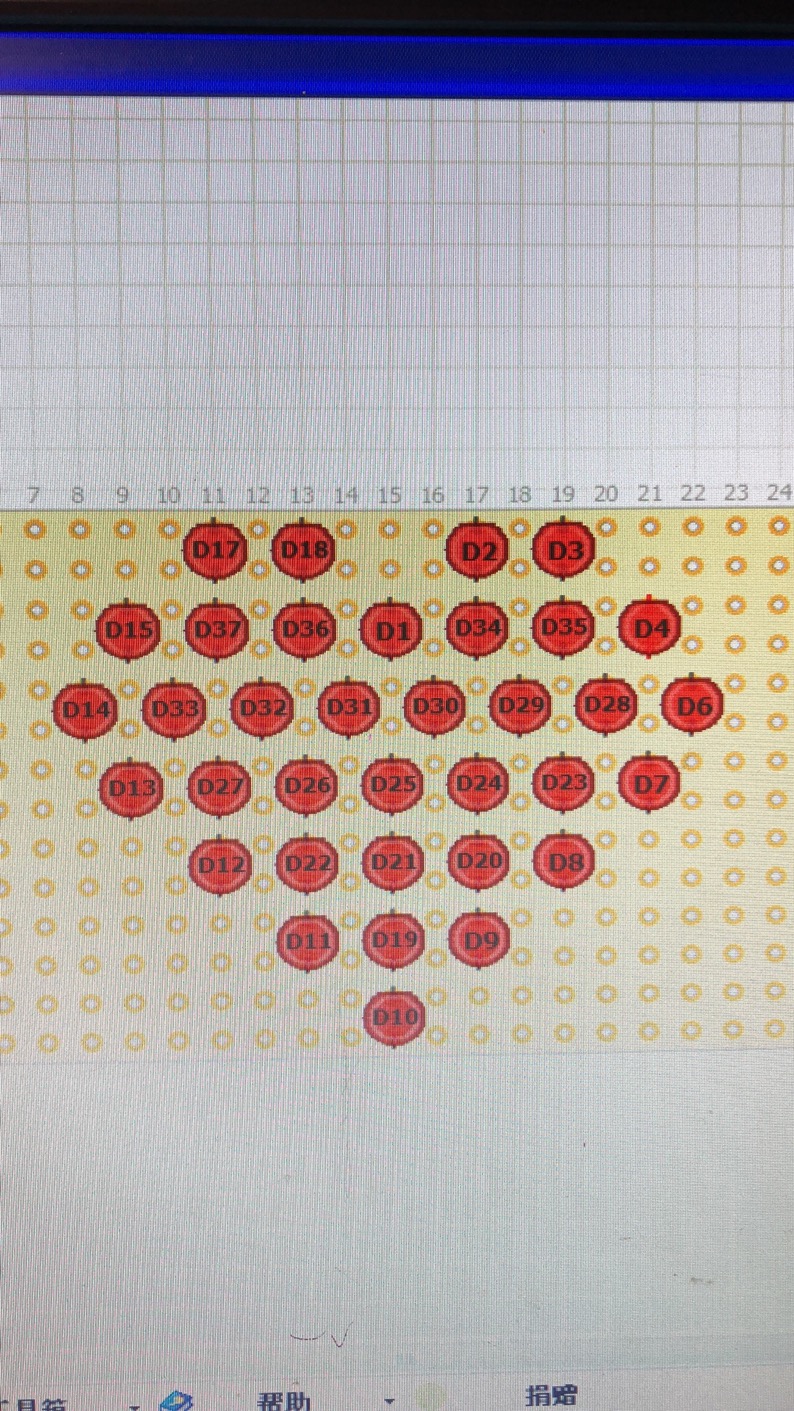
Figure 7.The design of the main shape of LEDs: (7 rows took up 14 holes and 8 columns took up 15 holes)
Figure 8. The diagram for LM324 chip.
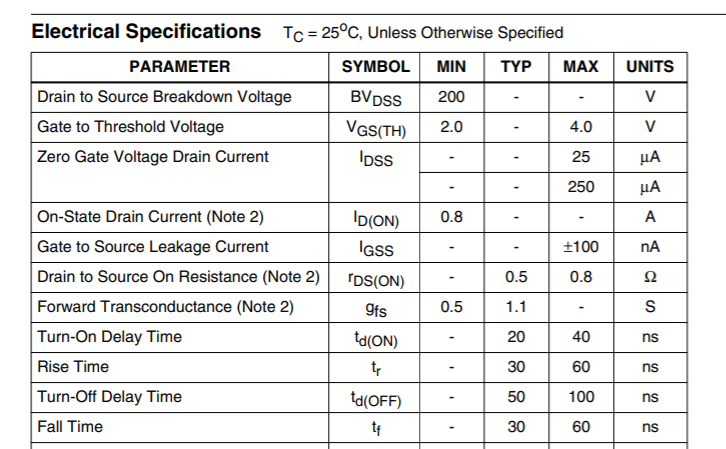
Figure 9. The datasheet of IRDF220 N-channel MOSFET.
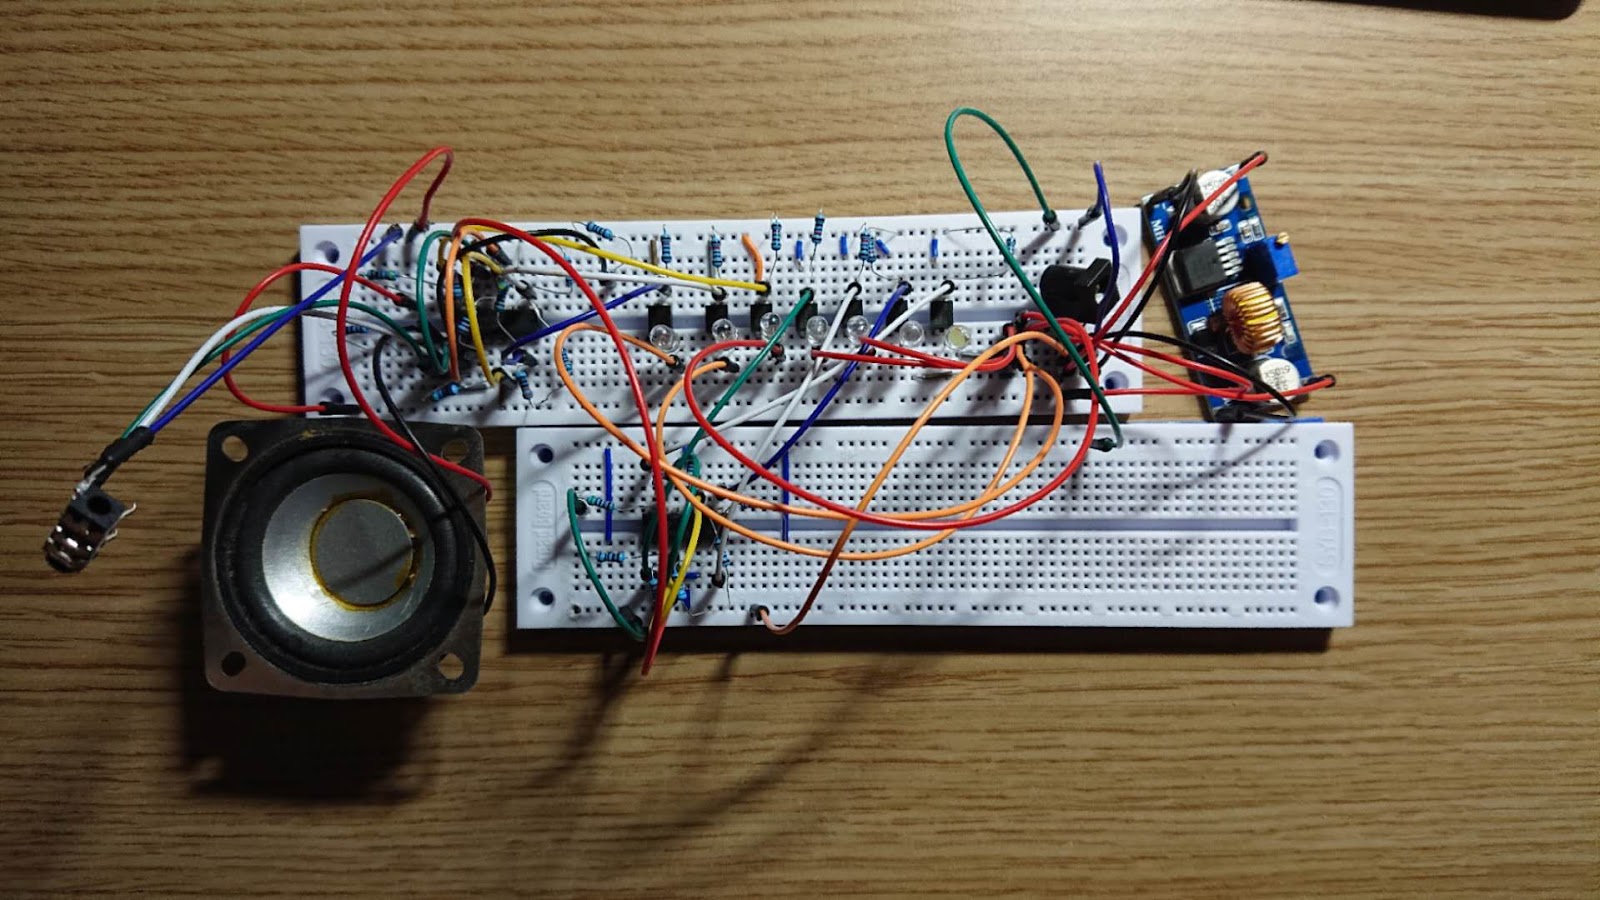
Figure 10. Minimum test circuit on the breadboard.
Further Experiment and Research
Having successfully powered up to three lines of LEDs in the way we want, we continued to broaden the test into 7 LEDs, which is the actual case we would like to use. To divide different lines with different reference voltages (Vref), we used the resistor configuration as the figure below shows:
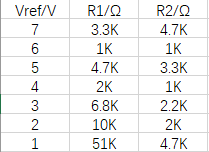
Figure 11. Current resistor configurations.
The problematic lines we find are the 2nd and 3rd lines, starting from the bottom. We find that they are more likely to turn on and off together. We researched the logic of the comparators inside the LM324. When the voltage from the audio signal is higher than Vref, the Vout is high. Conversely, the Vout is low. We think that the actual voltage between these two lines is a bit small, which causes this issue.
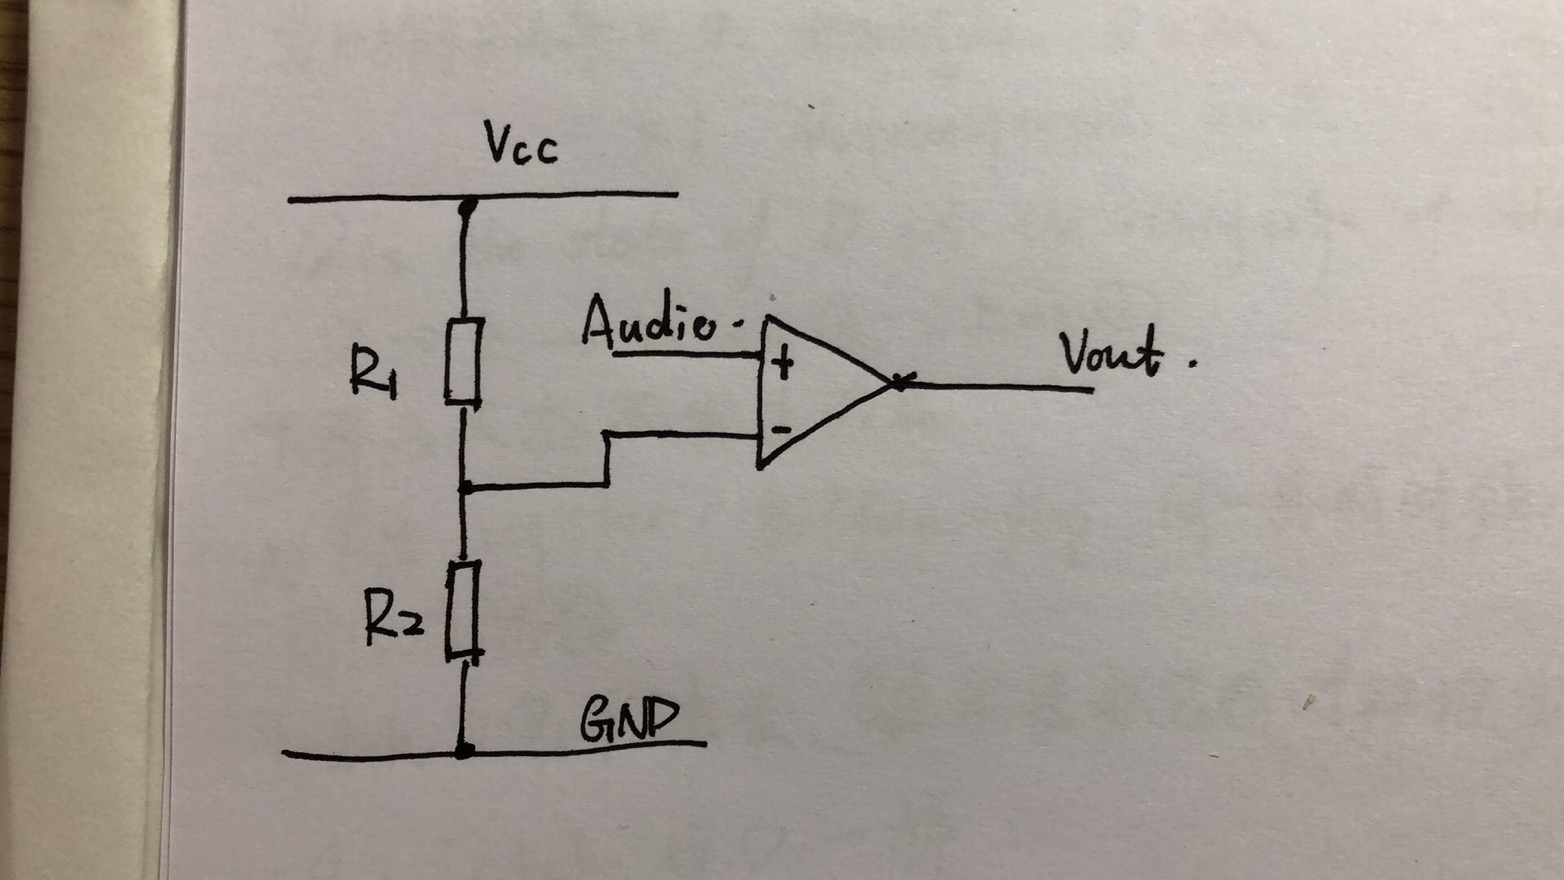
Figure 12. The comparator in LM324 for each line of LEDs.
Currently, the resistor setups are:
2nd line: R1: 10K R2: 2K
3rd line: R1: 6.8K R2: 2.2K
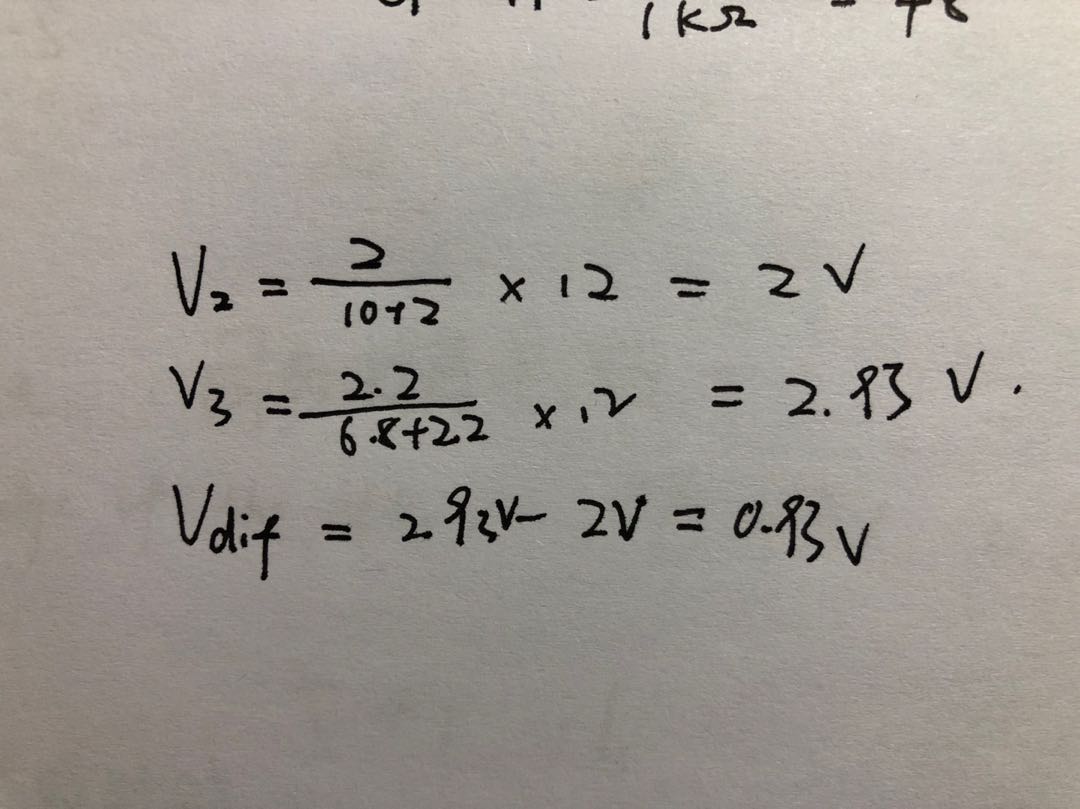
Figure 13. Calculation for line 2 & line 3 voltage.
The voltage difference between is 0.93V. Which is slightly lower than the 1V difference. To solve this problem, we increased the R2 of line 3 to 2.3KΩ (2.2KΩ + 100Ω), which brings the voltage to 3.03V. We tested again with our minimum test circuit, it works perfectly fine now. With the whole experiment part done, we can now proceed to the actual building stage.
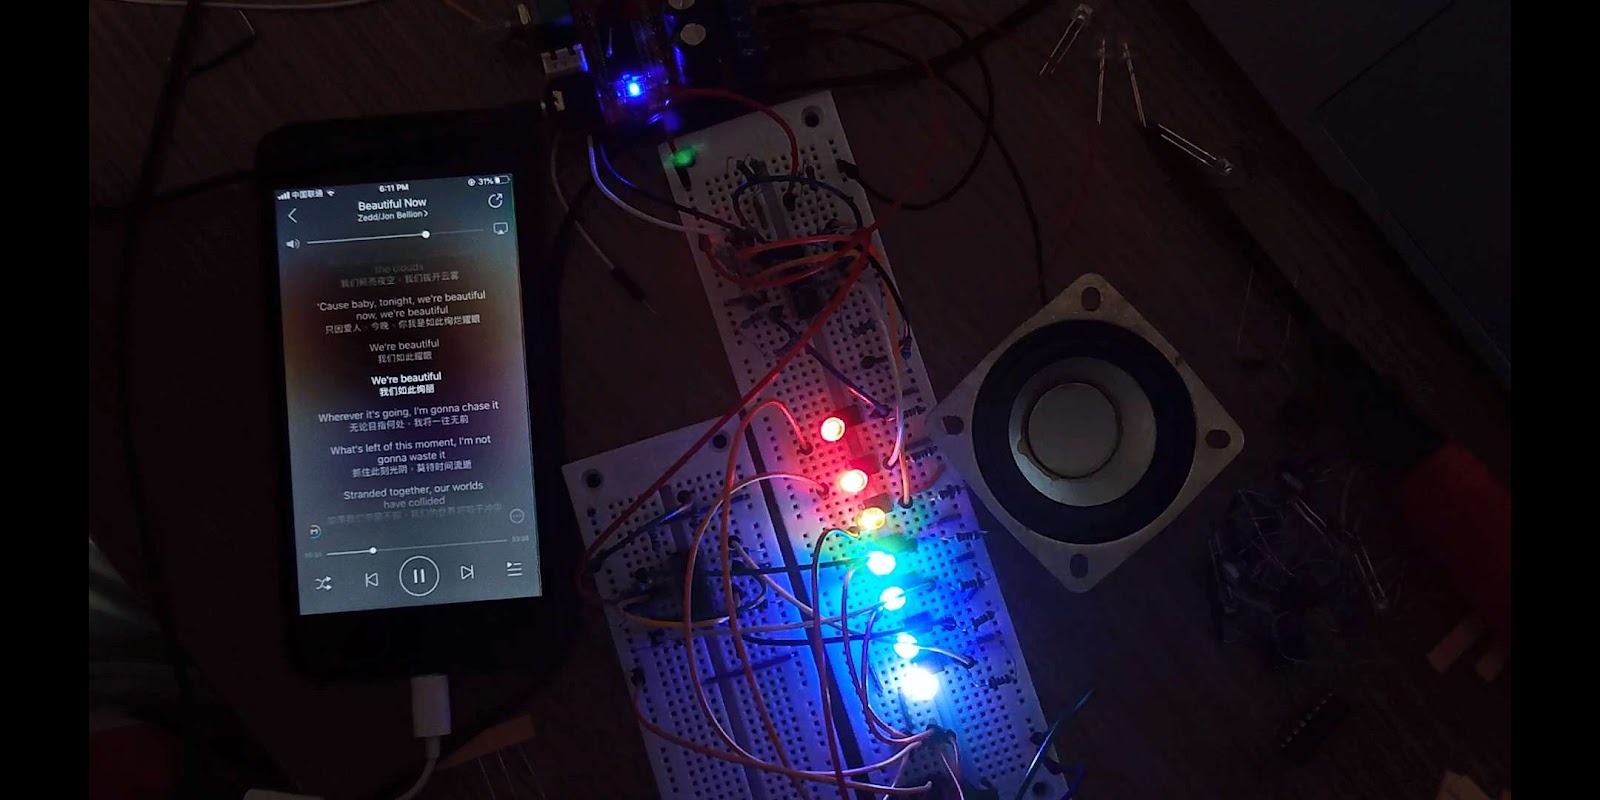
Figure 14. Experiment circuit working well.
Development Process
I. Design the component layer circuit on the perfboard.
Given the fact that we are making a compact speaker, and we need to be able to capacitate another voltage regulator board and power amplifier board, the available space for the circuit is limited a bit. As you can see from the diagram, several resistors are not connected in an elegant way. If we were permitted time
to develop this circuit on PCBs, we will definitely solve
this problem.
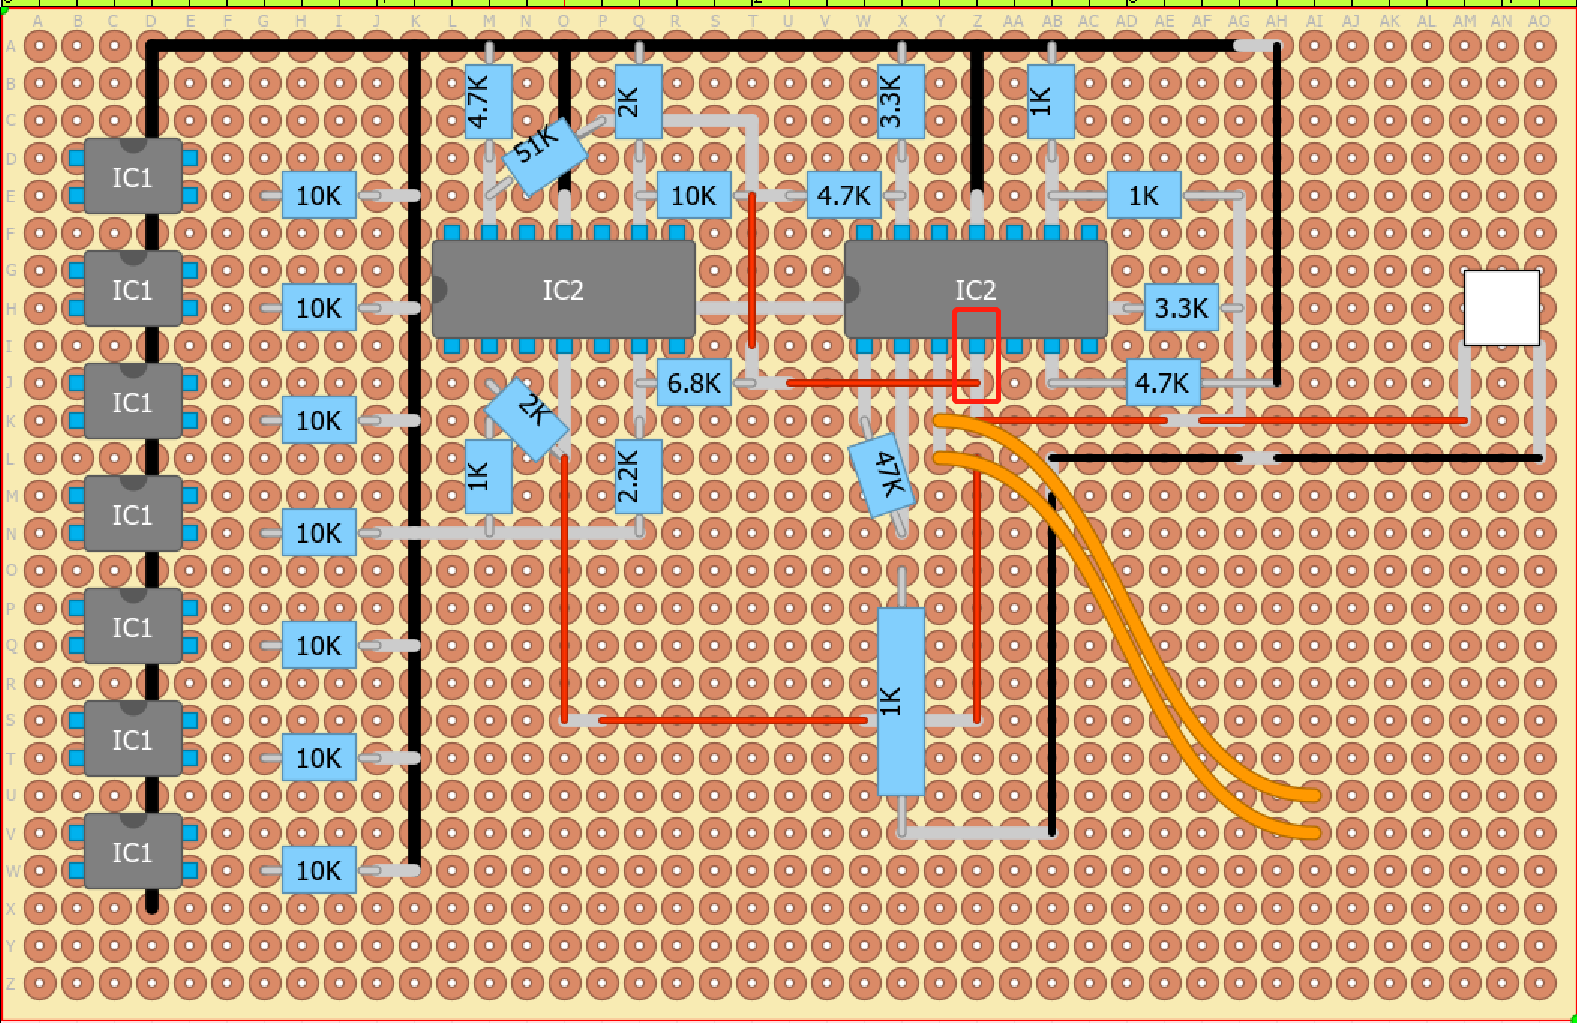
Figure 15. The circuit on the perfboard.
In the diagram, the grey lines represent tin and the redlines represent live wire while the black ones represent ground wire. The two orange wires are reserved for the input audio signals from the audio source devices. For the audio signal amplified LM324, we connect them internally with tin so that we do not need to hook up other wires. (To keep the diagram as neat as possible, the hookup wires from the output of LM324 to the NMOS gates are not shown on the diagram.)
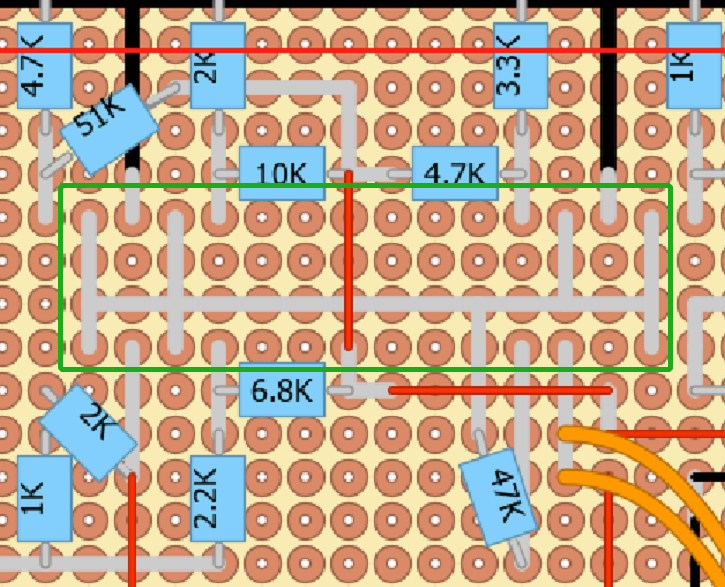
Figure 16. Internally connected audio signal. (In the green box)
II. Soldering components and LEDs.
For the component layer, we followed the design in figure 14. For the LED layer, initially we decided to use copper wires as common live/ground wires for each line of LEDs. However, due to the size restriction, doing it in this way generates risks of short circuit and the soldering was proved to be more difficult than we thought. So we followed the standard procedure and used tin.
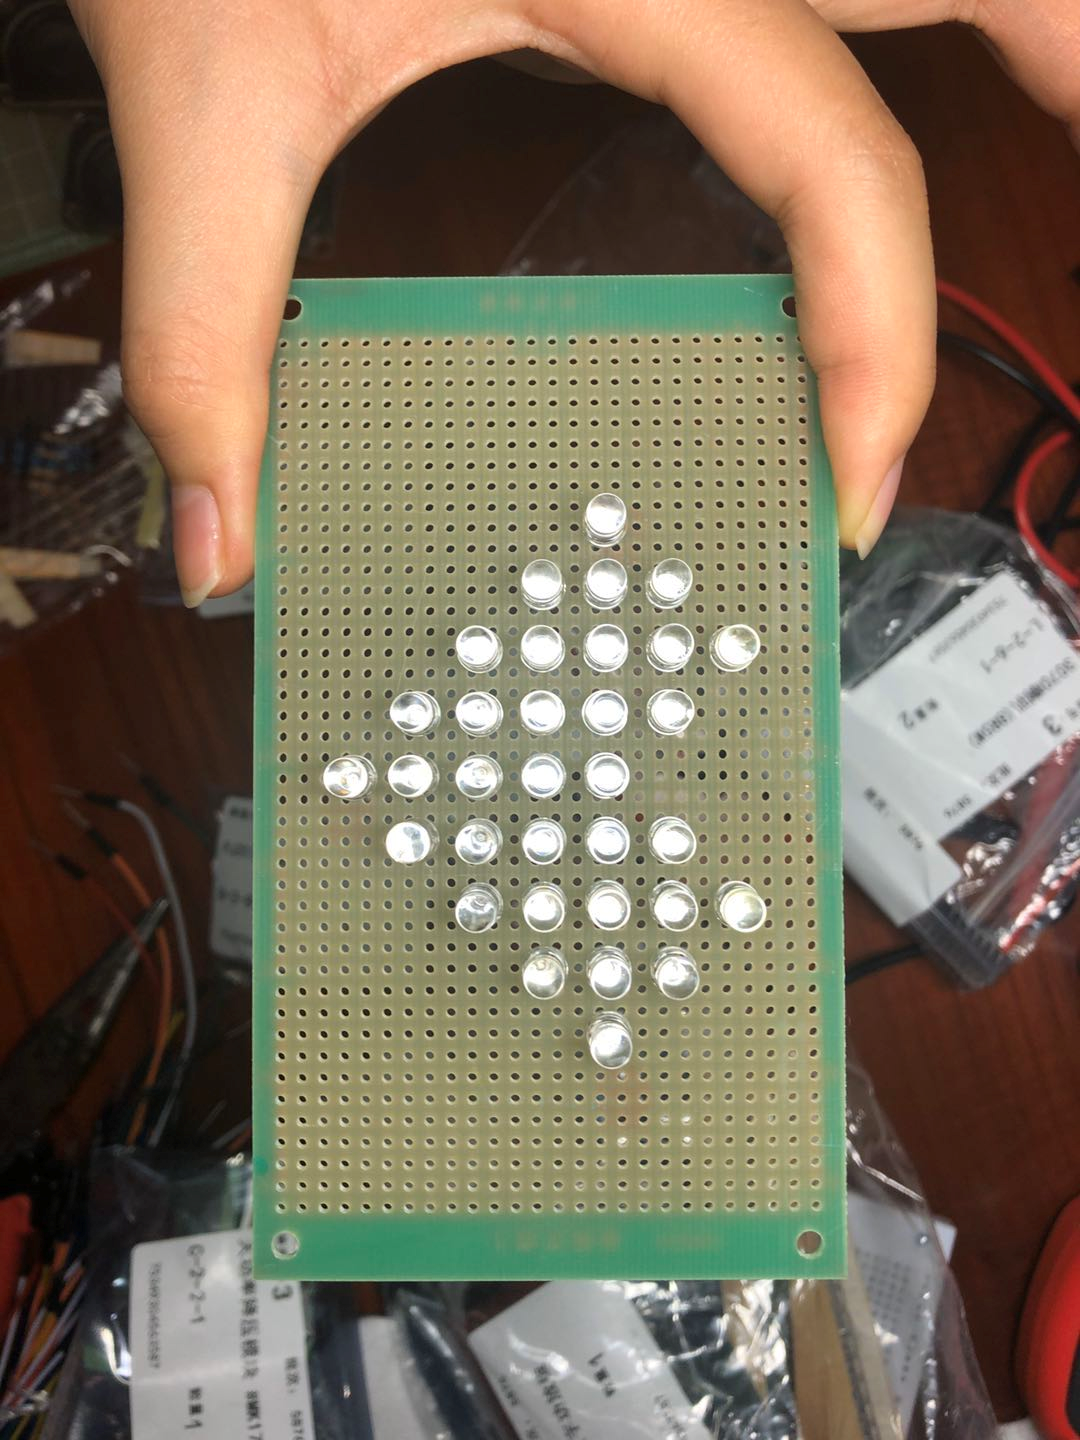
Figure 17. LED layout #1.
To bring some variation on LED layout, we also designed another layout solution.
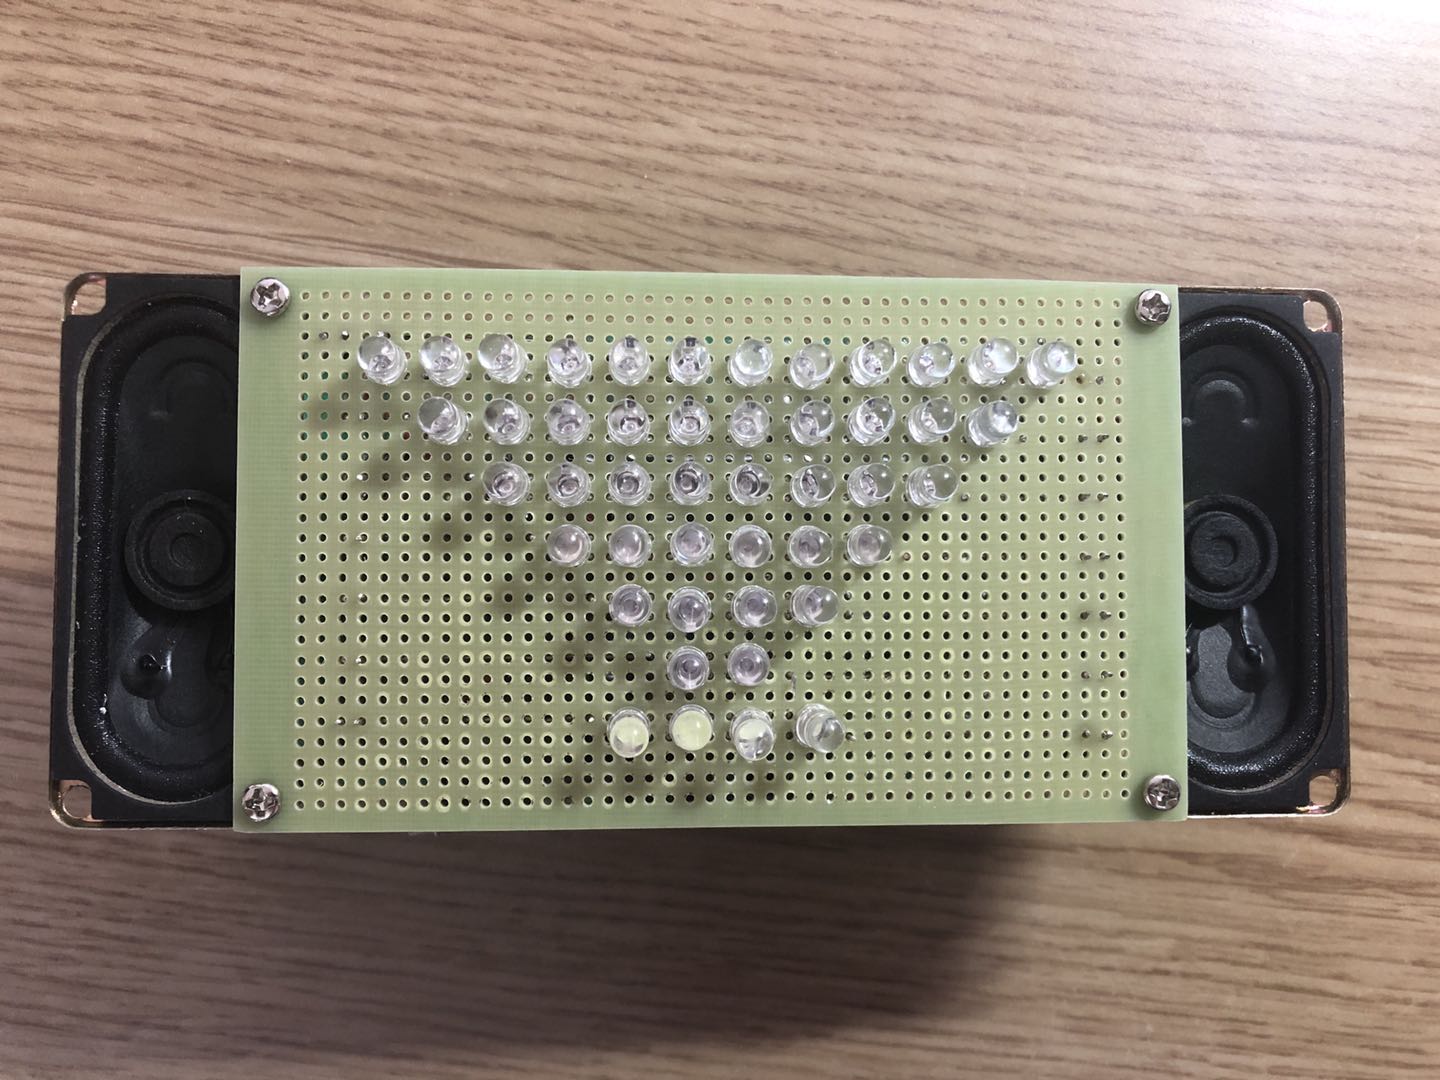
Figure 18. LED layout #2.
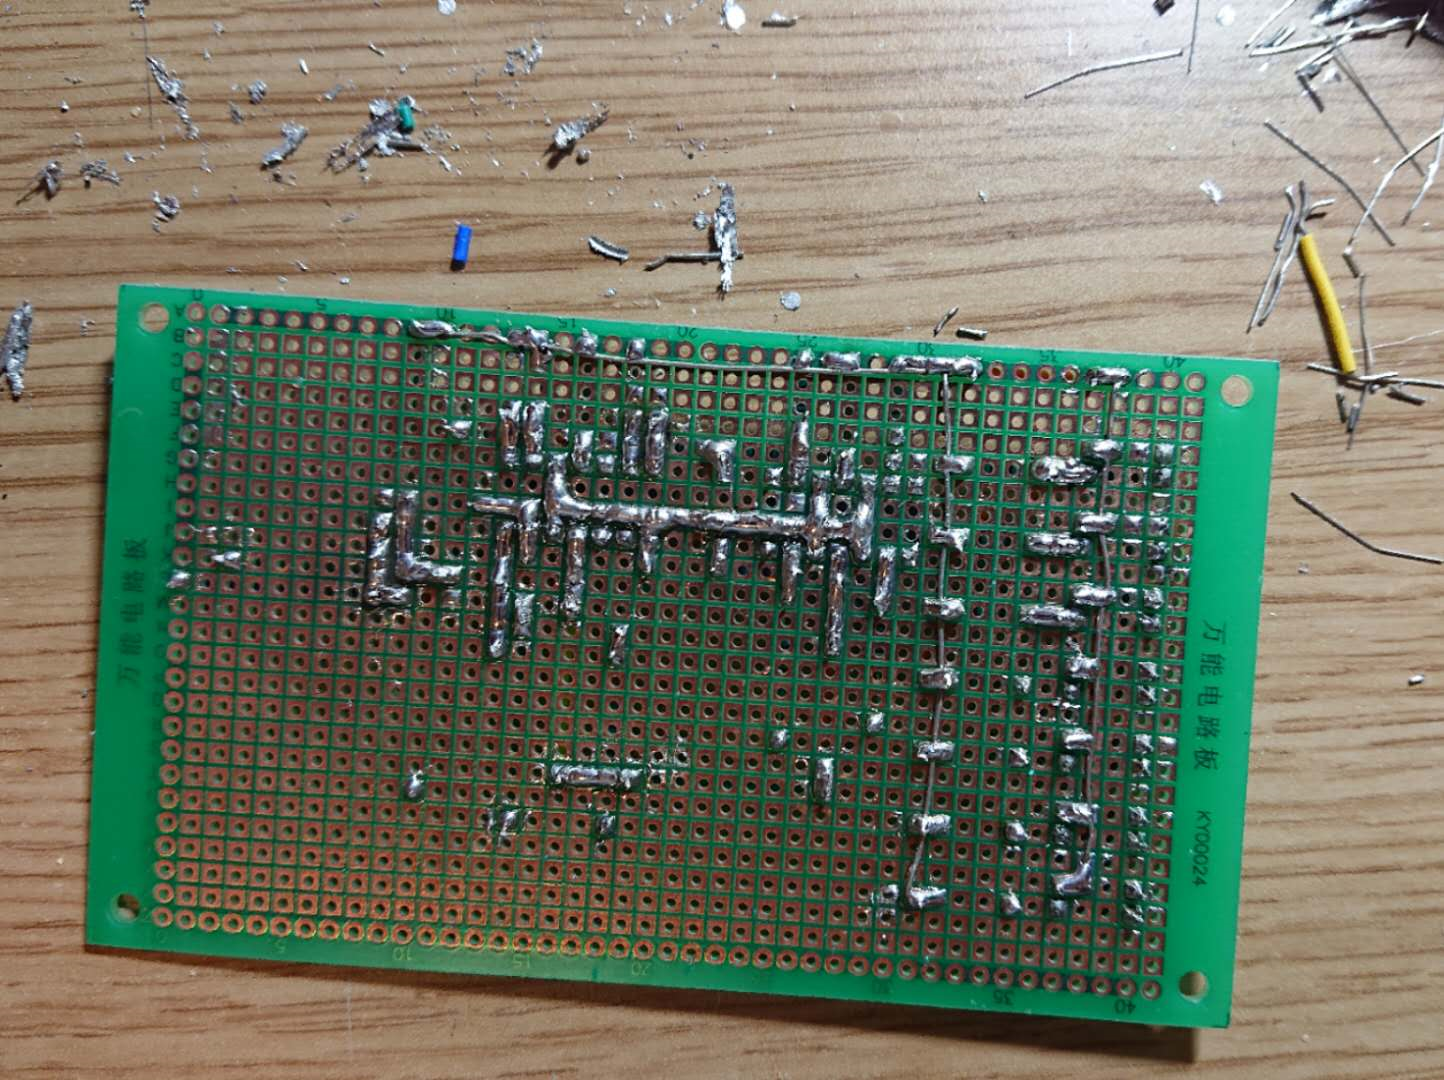
Figure 19. Soldering process.
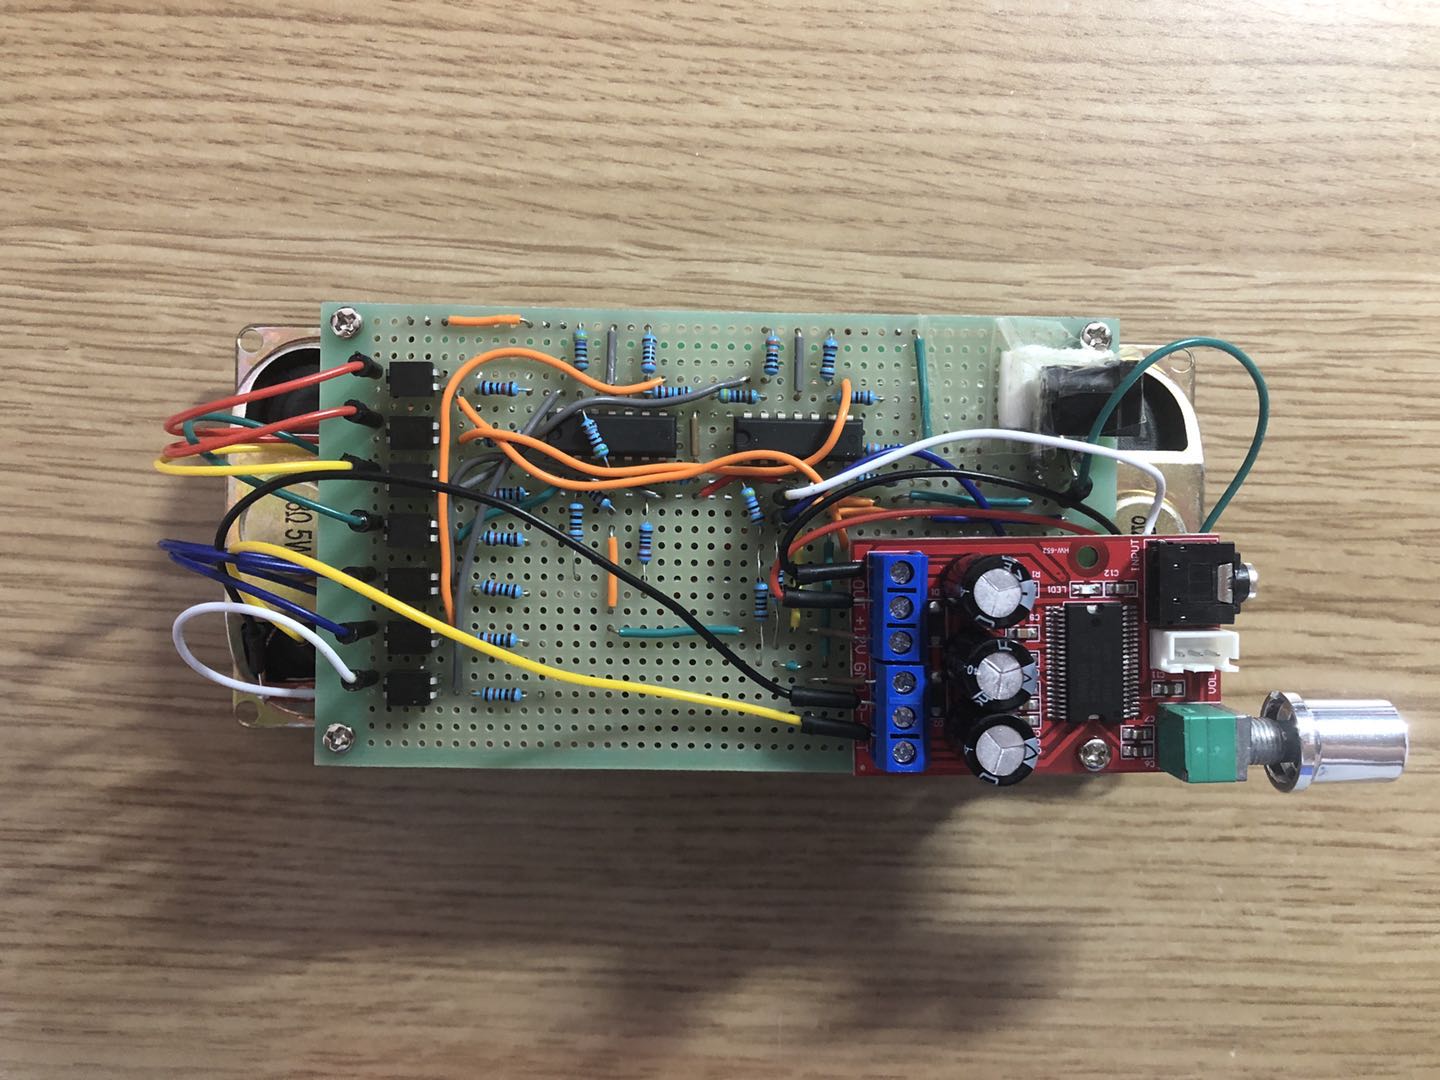
Figure 20. Completion of the circuit.
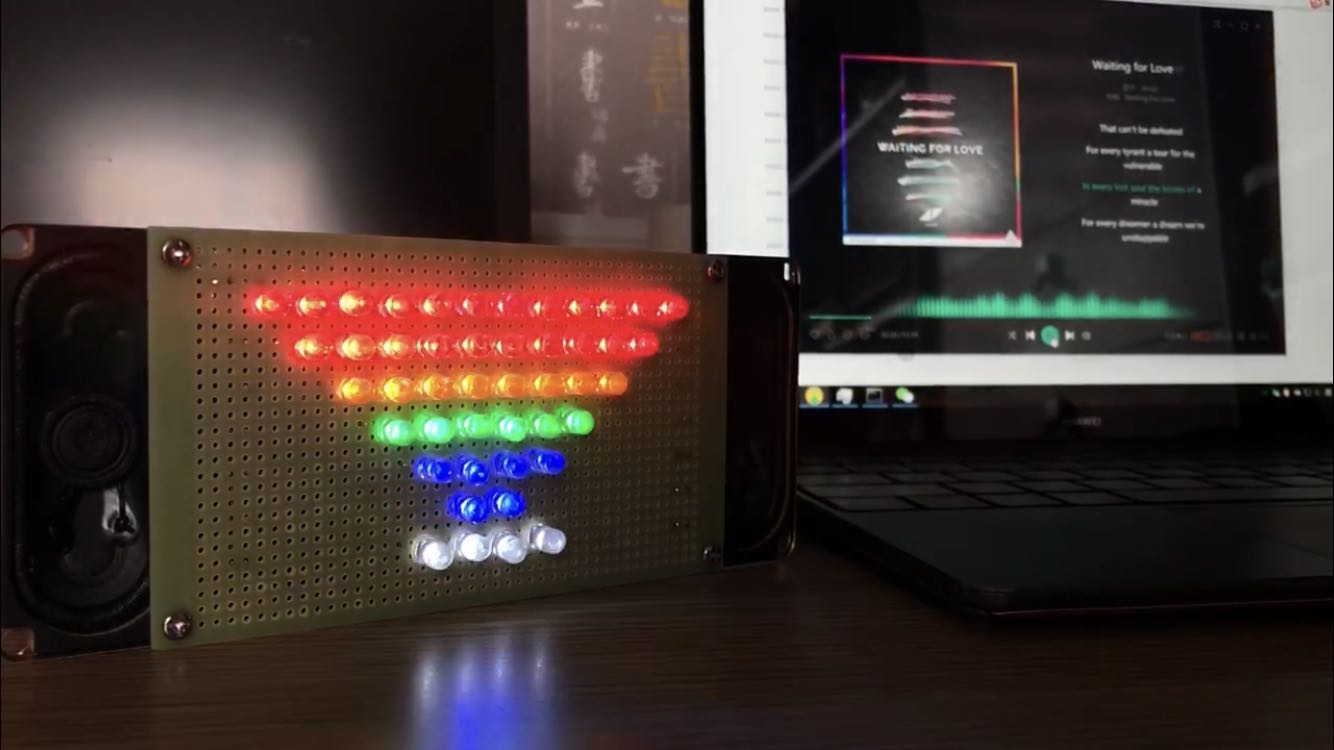
Figure 21. Picture of the speaker working.
Feedback
We received some feedback both from the instructors and peers during and after the Interactive Media Arts Show Spring 2020. Also we gathered some feedback from the general audience around us: our parents and friends.
Here we conclude the main feedback:
Peers & Instructors:
- The LED rainbow is pretty, but more fabrication to the speaker and the board would be ideal since this is a both practical and aesthetically pleasing project.
- The project is a transformation to our daily practical item: speaker. It is aesthetically pleasing: the rainbow of LEDs. And the concept "sound of the rainbow" could provoke more insights into the project.
- Instead of making the LEDs illuminate according to the volume of the music, a
frequency spectrum made of LEDs would be more intriguing and reveal more details about the music.
- Having LEDs arranged in the form of a rainbow is interesting, but maybe try the LED strip / full color LED that could change color accordingly to make it more dynamic and interactive.
- Instead of using perfboard, try designing a PCB board that would be much neater and easier to deal with. Since in the class you have learned the techniques of doing so.
General audience:
- The project is really pretty and practical at the same time.
- Maybe add a screen before the LEDs to make it more complete and look like a real speaker.
Conclusion
When thinking of our project as scientific discourse, we conclude three aspects:
- Initially, we would like this project to be an exploration of crossing the boundary of human senses. As it turns out, this goal is achieved. However, since we chose the format of the speaker to convey our ideas, more people think of our project as a decorated speaker while ignoring the different senses engaged in this project. We think this could be a great example to re-emphasize the importance of routine objects: the principle behind them and their scientific values.
- With the Volume Meter, we wanted it to be a representation of music that reveals information visually. Our final product shows a straightforward approach to music representation. However, it's a linear approach that only integrates one dimension of music. Compared with other music representation projects, there are other dimensions of music that we could try to visualize, too. Besides, integrating different dimensions of music could engage the audience more, creating a better user experience.
- Since we both have done projects with LED in the midterm, we consider LED to be a visually pleasing tool that could be integrated into many aspects or individually to do more experiments with. The feedback from others proves that these tiny but colorful lights could convey much information if used properly. It could be a visual delight to decorate; It could be an indicator if the colors are adjusted accordingly; It could also be a complement of other tools. Considering LED as only lights would be a waste of so many possibilities with this product. And that is the same for other electronic products, too. If used creatively and properly, they could achieve something much greater.
- On the boundary of practical and artistic, we think there is a lot to discover. This project is a great combination of practical and artistic items. There is much to explore in this field and as people are pursuing a higher quality of life, we think there should not be such a distinct boundary between practical and artistic projects.
Bibliography
Cooper, Matthew & Foote, Jonathan & Pampalk, Elias & Tzanetakis, George. (2006).
Visualization in Audio-Based Music Information Retrieval. Computer Music Journal. 30.
42-62. 10.1162/comj.2006.30.2.42.
This article introduces various visualization techniques developed in the context of music information retrieval for representing polyphonic audio signals. The techniques fall into two major categories: techniques for visualizing a single file or piece of music, and techniques for visual collections of pieces. We got inspiration to visualize music using a simple but beautiful electrical component: LED.
DIY Builder. “How To Make A DIY RGB VU Meter At Home.” YouTube, 27 Jan 2020.
https://www.youtube.com/watch?v=wG9RCiDdoKk
We were inspired by this project on the idea of audio visualization. Combining audio and video together creates an astounding user experience for it brings both acoustic and visual impact to the user. We would like to recreate or build on the idea of this project, to make it fit better to the topic of the course.
Kučikienė, Domantė, and Rūta Praninskienė. “The impact of music on the bioelectrical
oscillations of the brain.” Acta medica Lituanica vol. 25,2 (2018): 101-106.
doi:10.6001/actamedica.v25i2.3763
The article showcases the main scientific studies into the changes in the bioelectrical brainwave activity that occur while listening to music. It attracts our attention that some specific frequencies of music could have an impact on our brain and could cause bioelectrical brainwave activity. Since we are learning radiations’ impact on our body in electromagnetism, we find music has a similar pattern. Hence we want to elaborate on it and discover more about music.
Vennard, Martin. “Leon Theremin: The Man and the Music Machine.” BBC News, BBC, 13 Mar.
2012, www.bbc.com/news/magazine-17340257.
This article elaborated the history and development of theremin. It sets forth the basic principles behind it and the impact it had on the times it was invented. This instrument exerts an intriguing fascination on us because we like the way that it is played without actual physical contact with it. We feel like this is one of the perfect showcases of electromagnetism. It enables us to discover the principles under its attractive and mysterious image.