AI Tennis Ball Bounce Detection
Aditya Patel and Sharadwata Ganguli
GitHub Link → https://github.com/adityahpatel/Capstone.git
5 min video explanation → https://www.youtube.com/watch?v=0V2HgS6pJJI
Motivation
Tennis referees handle line calls, but they can be expensive (a chair umpire can make up to USD 7,000 per match1) and thus are most often used for professional matches. Additionally, professional tennis matches use expensive and sophisticated tools like Hawkeye2 or FoxTenn2 to assist the referee to take close line calls. Despite all of these tools being available, professional players still challenge line calls! Meanwhile, amateur tennis matches, mostly played without an actual dedicated human referee (usually the player whose side of the court the ball fell makes the line call) or sophisticated line calling tools could end up in a heated discussion between players -especially on close line calls. Hence, line calls are a critical aspect of tennis matches.
A crucial component of tennis line calls is bounce detection - i.e., detecting whether the ball actually bounced. The position of the tennis ball bounce, when observed in the context of the tennis court boundary lines, is what supports line calls, who scores -either visually or via technology. As part of our CAPSTONE, we are focusing on tennis ball bounce Detection, with the hope that in future we can use the detected bounce position and position of the court boundary lines to actually generate the line calls and thus score a tennis match. Tennis Ball Bounce Detection is a novel subset of Computer vision -one which has not been explored (when we searched for ‘tennis ball bounce detection’ in the UMICH online library we got no relevant result as shown below).

Figure1: tennis ball bounce detection search results in the UMICH online library as of 19 April 2022
Our aim is to explore this novel problem of tennis ball bounce detection and come up with a solution which can be used as a foundation for a tennis line call solution in the future.
Literature Review
We envisage our Project as consisting of 2 main components namely Object Detection and Bounce Detection of the previously detected objects (tennis balls). Due to the novelty of the Tennis Ball Bounce detection problem as mentioned earlier, we frame Bounce Detection as a Sequence Classification problem where we divide the ball trajectory throughout the match into chunks of ball coordinates per window of frames and then try to classify whether any specific frame window has a bounce.
Object Detection in Computer vision at a high level is identifying and classifying objects present in an image (or video) and providing bounding boxes (co-ordinates) for the detected objects.3
The bounding boxes are a key feature of Object Detection which differentiates it from Image Classification / Recognition where we classify the whole image as containing an object or not. Object Detection allows us to track as well as count objects in an image/ video.
Machine Learning based Object Detection models try to use features within the image in order to classify a portion of an image as an object. Examples of such approaches would be Background / Frame subtraction based Object detection which use the changing pixels on a static background to detect moving objects in a video.4
Meanwhile, Deep Learning based Object Detection Models do not require feature engineering and learn from training examples using Convolutional Neural Networks and other frameworks. The Deep Learning Object Detection models are the current state of the art. These models often have an ‘encoder-decoder architecture’, where the encoder extracts features from the image, while the decoder predicts bounding boxes and class labels for the detected objects.3 Deep Learning Object Detection models include SSDs (Single Shot Detectors), R- CNN, Faster R-CNN and YOLO (You Only Look Once). We choose YOLOv4-tiny as it is the fastest YOLOv4 model due to a reduced network size (2 YOLO layers instead of 3 and fewer prediction anchor boxes ).5 Meanwhile, YOLO framework itself is fast as it uses a grid approach to detect objects across a whole image frame all at once.6
Sequence Classification is a Supervised Machine Learning approach where we learn from labeled examples of sequence data and then be able to classify new examples of time series. This approach can be used for Pattern Recognition which is the use case we are interested in as we need to detect the bounce from the ball trajectory data as derived from the sequence of bounding boxes from the Object Detection model.7 There is a scikit learn based library called sktime which supports time series and sequence based classification.8 This includes various time series classifiers like distance based (KNeighborsTimeSeriesClassifier etc), shapelet based (ShapeletTransformClassifier), etc.8 Time series classification can also be supported using the deep learning LSTM modules available in keras.9
Ethical considerations
We are using publicly available tennis match videos (be it professional or amateur) from Youtube. While the match videos can be used to recognize people (players, match staff, spectators etc), our focus is on the tennis balls as we are detecting the same. Hence we do not anticipate any specific privacy led challenge. Also, as the videos are publicly available - we do not consider data provenance and disposal a key issue.
However, people play on a variety of courts and lighting conditions and a tennis ball detection model exclusively trained on one kind of tennis match may not be able to detect the tennis ball well in other conditions which could bias the outcome. Hence we have tried to ensure a variety of tennis court surface, camera angle and lighting conditions in the training images. We have used the following Ethics Checklist in this CAPSTONE project:
Checklist criteria | Response |
Have you comprehensively tested the training data to ensure it is fair and representative? | We have tried to ensure a diversity of tennis match video conditions -different tennis court surface -clay vs grass vs hard court, different camera angles -roof angle for professional match vs ground angle for amateur match, lighting conditions -day vs evening vs night. |
Have you thoroughly studied and understood possible sources of bias in your data ? | As tennis match videos are the inputs to our AI Tennis Ball Bounce Detector, we understood that non representation of any particular tennis match condition could represent a bias. Hence, we ensured diversity in our input data as explained above. |
Does your team reflect diversity of opinions, backgrounds, and kinds of thought; and have you involved collaboration of diverse expertise? | Our Project Team is composed of Aditya who has Material Science and Computer Vision professional background and Sharadwata who has Marketing & Analytics professional background. We also bring different cultural experiences as while Aditya is US based, Sharadwata is India based. Thus, we have diversity of opinion and background in our Project team. |
Have you tested for fairness with respect to different user groups ? | Our output (bounce detection) is not differentiated by user groups as such, hence we do not foresee the need for such a test. |
Have you tested for disparate error rates among different user groups? | Our output (bounce detection) is not differentiated by user groups as such, hence we do not foresee the need for such a test. |
Approach

Figure2: Capstone Project Modular Approach
Our approach consists of accessing the tennis match videos and then passing them on to a pipeline of 2 models in sequence -the Ball Detection model (Model1) and Bounce Detection model (Model2). The outcome would be classifying where in the match video did the ball bounce.
Technical Requirements
Due to the need of large storage space (we are working with videos, images as well as deep learning models like YOLO and Keras which have substantial storage footprint), as well as GPUs to train the YOLOv4 object detection models iteratively, we acquired Google Colab Pro and extra storage space of 100 GB in Sharad’s personal gmail account. Google Colab Pro provides access to faster GPUs, higher RAM as well as longer run times10, all of which are essential in training the YOLOv4-tiny deep learning object detection models. We had to train multiple models iteratively. The Colab notebooks available in the shared folder (link) can be shared to a user’s own google drive and run from there.
Data Collection process
As part of the ethical considerations and the need to reduce bias, we identified that we need to train the object detection model on a variety of relevant tennis match images. Hence, we searched for short tennis match videos, ensuring diversity - Professional, Amateur, different court surface (clay vs grass vs hard), different lighting conditions (day, evening, floodlights at night), different camera positions (professional roof top view vs amateur shoulder height view). We used the python package youtube-dl for this task.11 We downloaded 4 professional match videos and 4 amateur videos.
We then extracted frames from these downloaded videos using OpenCV. We got 56,450 frames from the 4 professional videos and 54,938 frames from the 4 amateur videos. We selected around 126 frames from each video (for a total of 1008 frames for 8 videos) -this is the largest original image set we will be using. Within each video, we tried to ensure a ratio of 1:2 for frames where the tennis ball is in the front court vs where the ball is in the back court. We are intentionally keeping a larger number of frames where the tennis ball is smaller in the backcourt so the model has a substantial sample to learn these smaller objects. We also halved the image set to 504 (63 images per video) for a smaller image set and further to 256 (32 images per video) for the smallest image set. This will allow us to evaluate if image set size impacts object detection model training performance.
We subsequently utilized a python based annotation tool called Labelimg12 to label the bounding box coordinates of the tennis ball(s) in the tennis match frames in YOLO coordinate format for each image set. We also need to add a new category of ‘ball’ for the tennis balls we are annotating in the frames. We need to keep in mind that YOLO coordinate format is a bit different as it starts from the top left corner and goes till bottom right -and thus 4 numbers are captured left_x, top_y, width, height and these are normalized with the width and height of the image.13
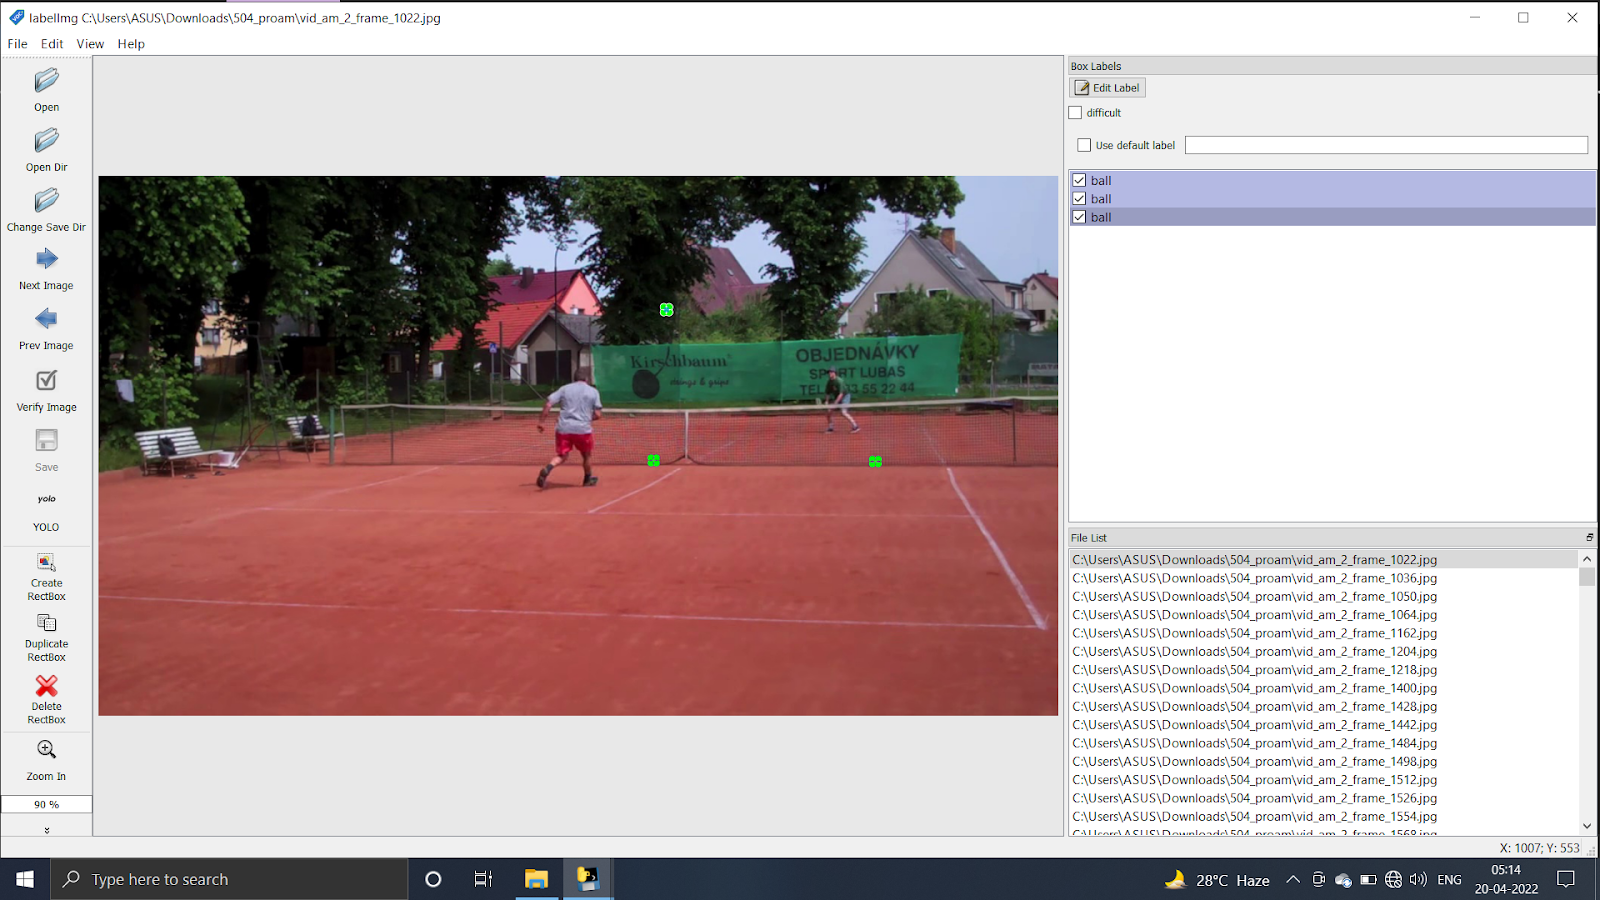
Figure3: tennis ball bounding box labelling using labelimg -normal view
labelimg also allows zooming in for even tighter (and thus more accurate) bounding box labeling.
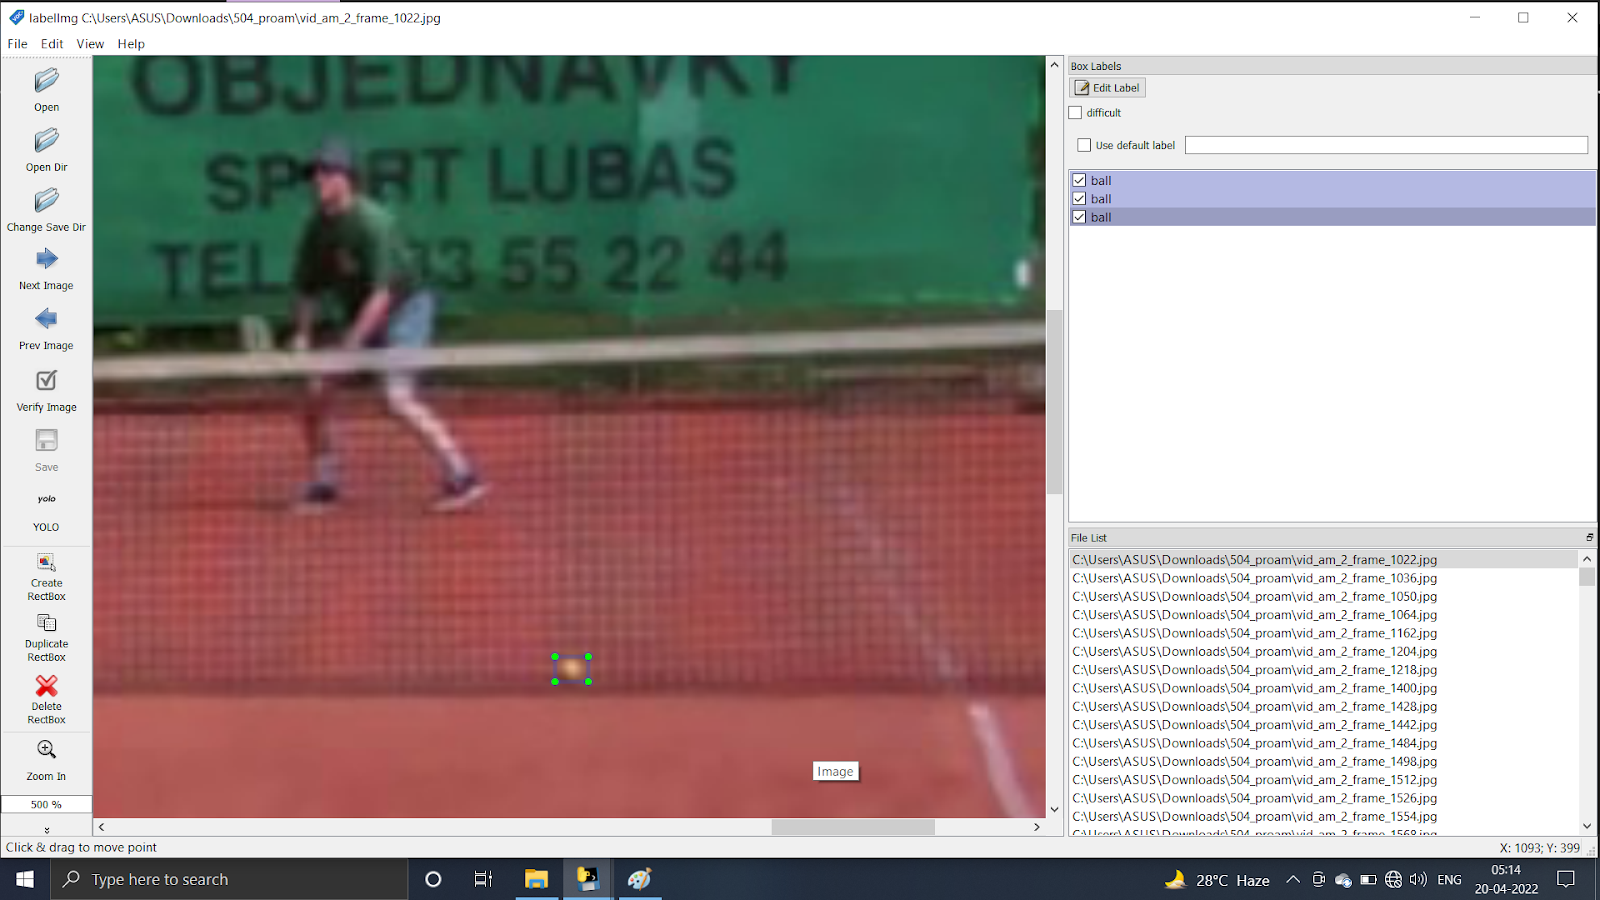
Figure4: tennis ball bounding box labeling using labelimg -zoomed in view
For Deep Learning more data is always needed and a way to have more data with the existing limited data is by using augmentation where the data is modified a bit, but the classification label remains the same with the understanding that this slightly different data provides variety to the limited training data.14 For Images, data augmentation could be flipping or rotating the image or cropping the image. We used the python package albumentations15 for augmenting the image sets -we use image augmentation approaches - RandomCrop, HorizontalFlip and RandomBrightnessContrast. RandomCrop could result in the detected object itself being cropped away and thus the resultant image will have no labels. We will discard such labelless images as YOLOv4 does not mandate such labelless images in the input data. We also used a randomseed to ensure reproducibility of RandomCrop and RandomBrightnessContrast.
Now, we have 256,504 and 1008 original image sets and 887, 1764, 3525 as the augmented image sets. We will be training the Object Detection Model on the augmented image sets.
Object Detection Model - Model 1
On Object Detection we chose the YOLO framework (deep learning model) as it is faster (it scans the image all at once -hence the You Only Look Once moniker).6 Within YOLO we chose v4 as it is the latest ‘accepted’ version. There are controversies regarding YOLOv5, especially because of its lack of a published paper16 -hence we did not choose it. And finally within YOLOv4 we chose the YOLOv4-tiny as it is the fastest.5 The YOLOv4-tiny model that we will implement is darknet based. Darknet is an open source neural network architecture written in low level languages like C and CUDA.17
We will not be training the YOLOv4-tiny model from scratch, but will use pre-trained weights as a starting point to train the model using our labeled images. There are other parameters that we will change -primary being max_batches which needs to be at least 6,000 or equal to number of classes X 2000 (we have only 1 class ‘ball’) or number of input images. As we have less than 6,000 images in all image sets - hence , we choose 6,000 as the max_batches. Subsequently, we need to set steps at 80% and 90% of max_batches, which in our case would be 4,800 and 5,400. The width and height of the YOLOv4-tiny network by default is at 416 respectively.
The Performance Metric used for Object Detection models will be mAP@0.50 which is the mean average Precision of the Training labels using an Intersection over Union threshold of 0.50.
When we trained YOLOv4-tiny on the original + augmented 887 labeled tennis match frames (based on 256 original images), we get a mAP@0.50 metric of 67.5%, as shown below:
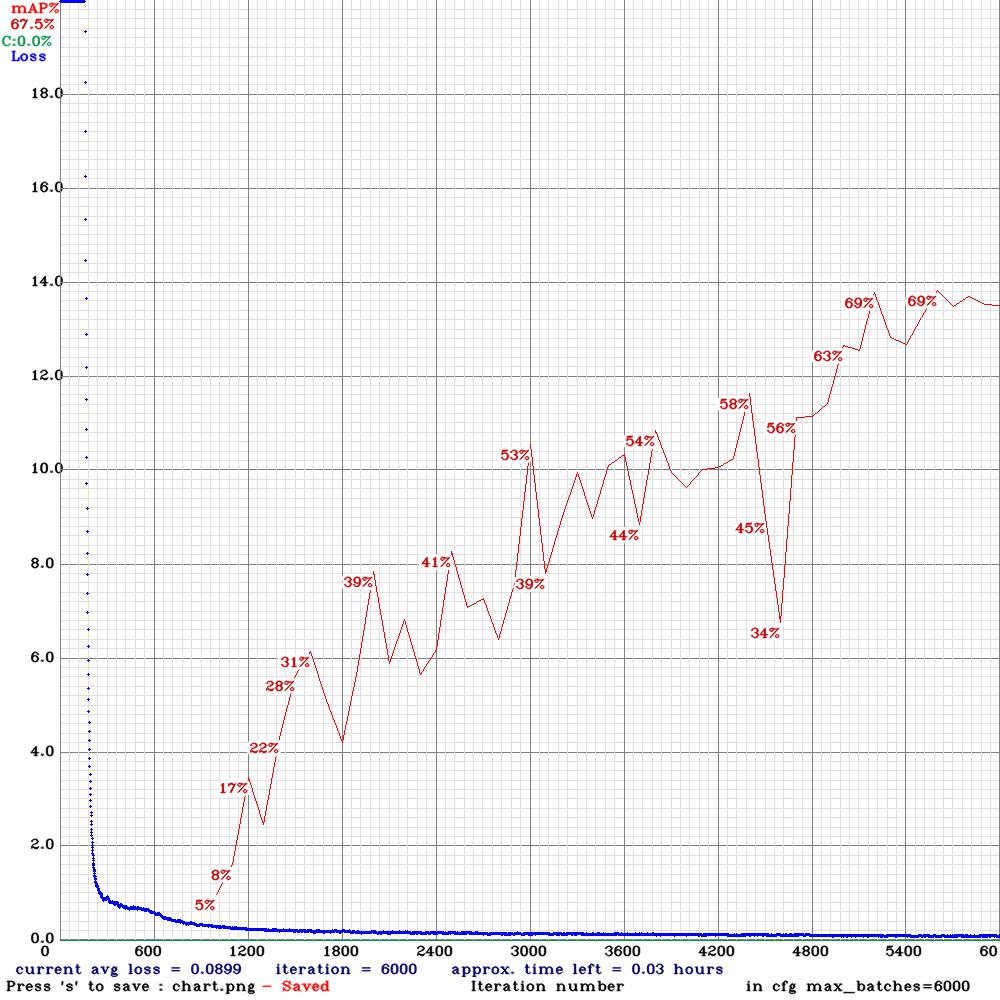
Figure5: YOLOv4-tiny metric performance on mAP@0.50 on the original + augmented 887 labeled tennis match frames (based on 256 original images)
Additionally, when we tested the model on small video, it was not able to detect the tennis ball at far end of the court (https://drive.google.com/file/d/1-vEcgJYmfCfXSoVMg1ajUdRl4b4K73dQ/view?usp=sharing ).
Now, when we trained YOLOv4-tiny on the original + augmented 1764 labeled tennis match frames (based on 504 original images), we get a higher mAP@0.50 metric of 69.3%, as shown below:
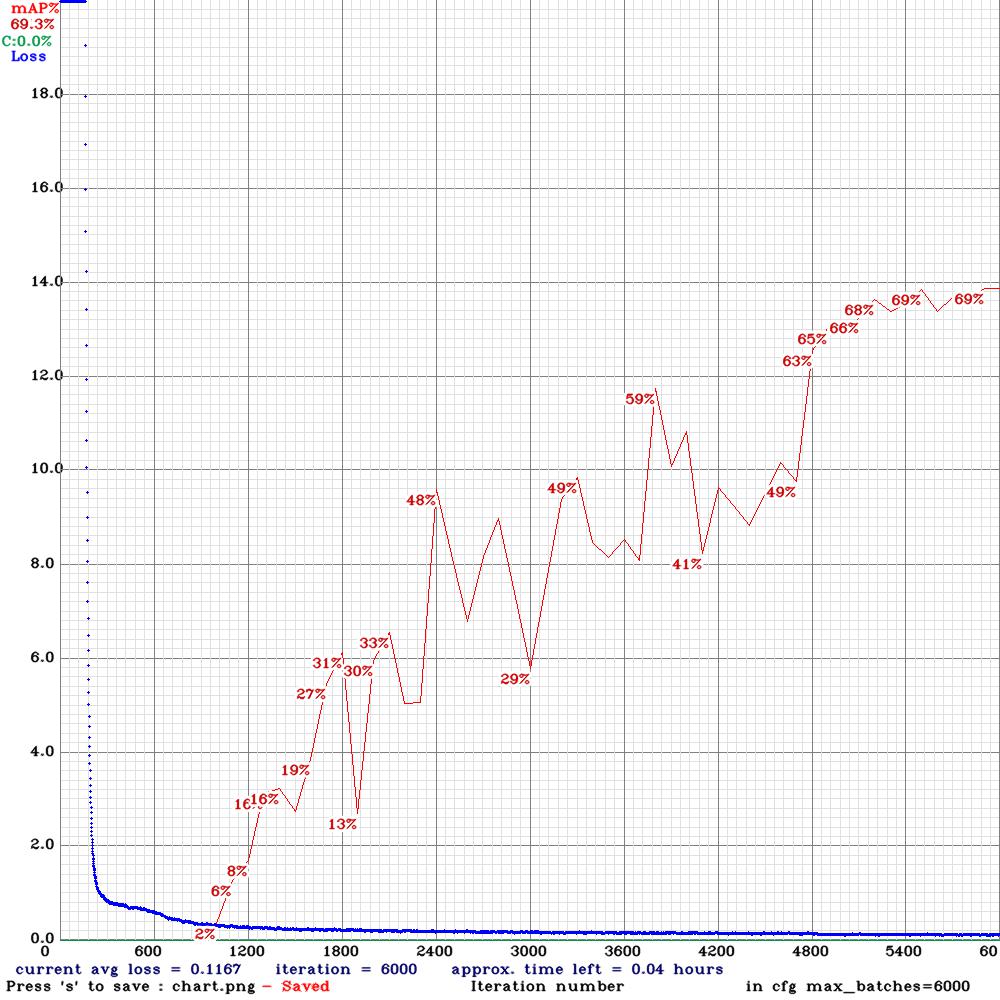
Figure6: YOLOv4-tiny metric performance on mAP@0.50 on the original + augmented 1,764 labeled tennis match frames (504 original images)
Subsequently, when we trained YOLOv4-tiny on the original + augmented 3,525 labeled tennis match frames (1008 original images) -the largest image set we had, we get a higher mAP@0.50 metric of 70.1%, as shown below:
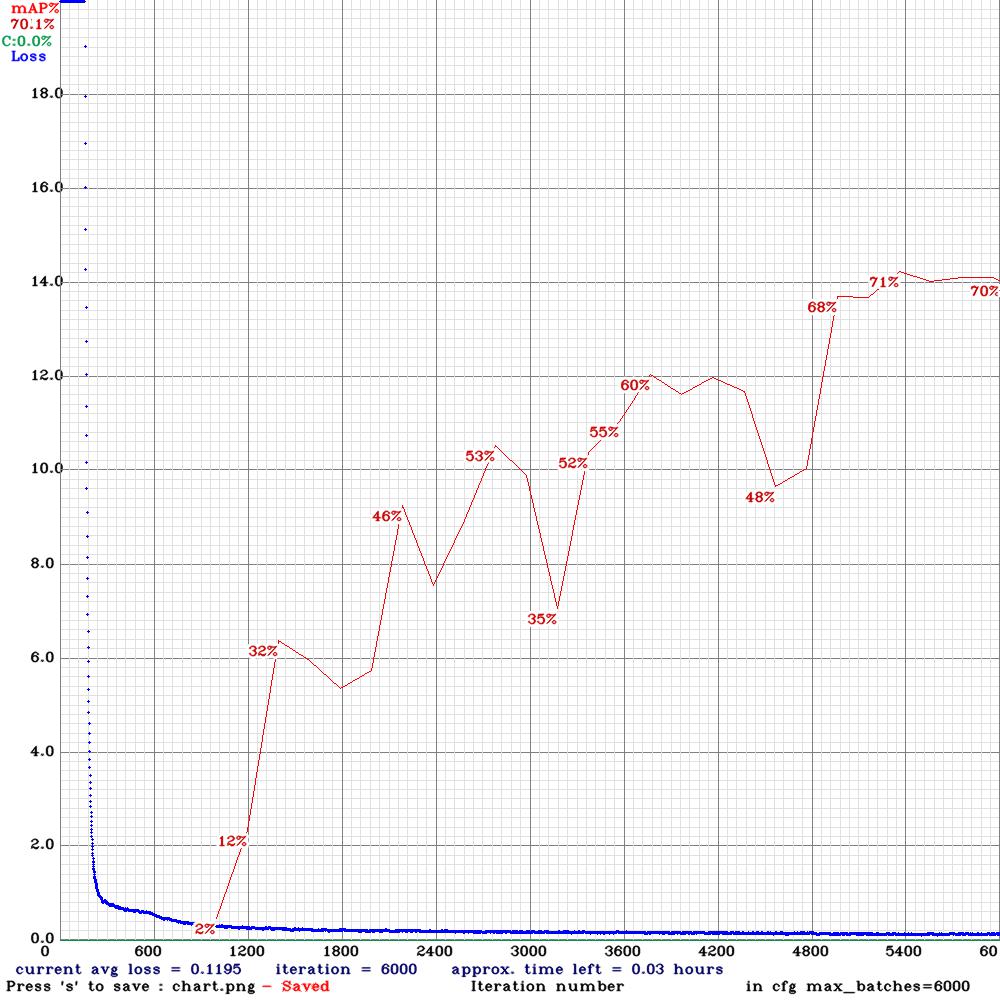
Figure7: YOLOv4-tiny metric performance on mAP@0.50 on the original + augmented 3,525 labeled tennis match frames (1008 original images)
While the performance on mAP@0.50 is evidently increasing slowly as we increase the size of the image set -we do find the performance at the far end of the court is still not good!
Hence, we increased the resolution of YOLOv4-tiny (width and height) to 1,664 for the original + augmented image set of 3,525 images (original 1,008 images). We get a much higher mAP@0.50 value of 93.9%, as shown below:
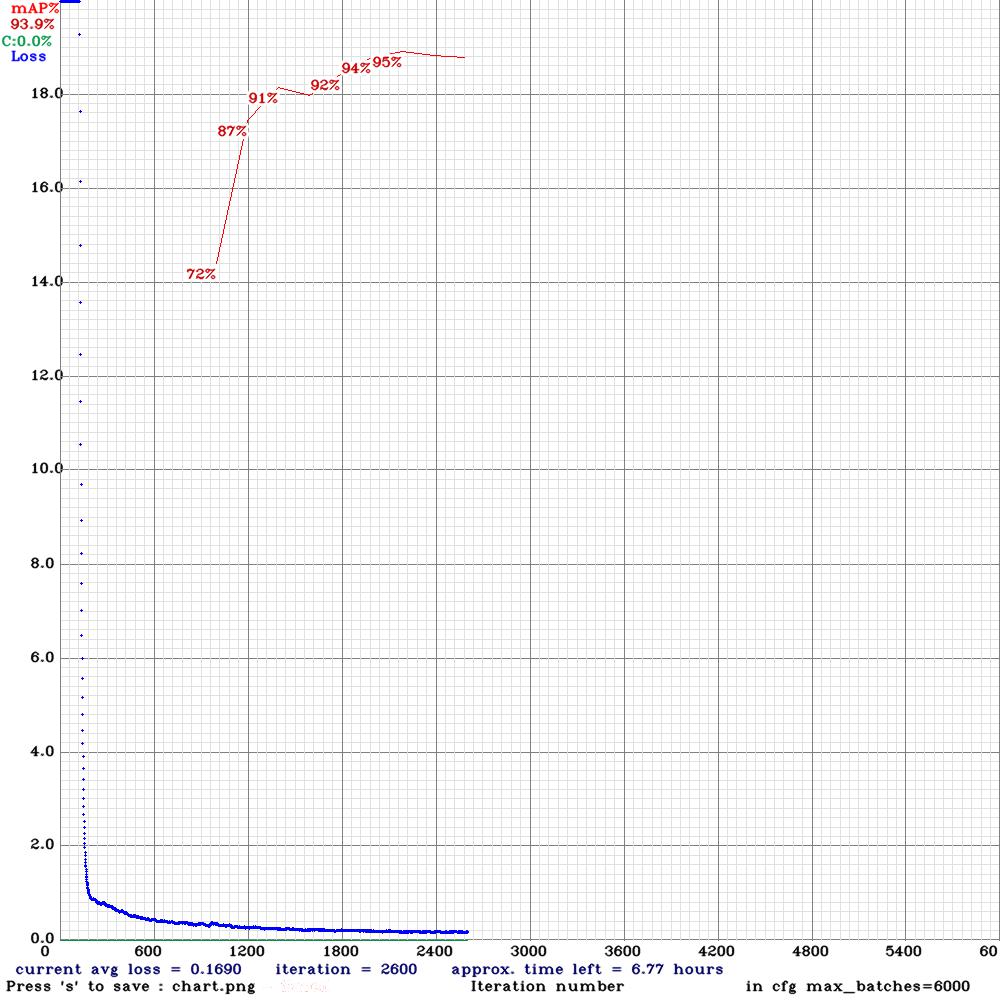
Figure8: YOLOv4-tiny metric performance on mAP@0.50 on the original + augmented 3,525 labeled tennis match frames and 1,664network resolution (original 1,008 images)
As evident from the truncated graph above, we ‘early stopped’ the training around the 94% mAP@0.50 mark as beyond that the model would have ‘overfit’ resulting in nearly 99% mAP@0.50 metric value!
When we tested the model on a small video, it was able to detect the tennis ball at far end of the court (link).Thus, we chose this as the Object detection model. This model is named as proam_1008_aug_1664res.
Multiple YOLOv4-tiny runs with the same input data and hyperparameters result in slightly different mAP@0.50 values -they do not seem to be exactly reproducible. We explored ensuring reproducibility of YOLOv4-tiny models but found no available solution due to a lack of standard best practices for Deep Learning Model reproducibility.18
Bounce Detection Model - Model # 2

Figure9: Bounce Detection Model approach
Label Collection
One of the harder parts of this project was collecting the ground truth data for bounce detection. We could not find any ready-to-use dataset where frames were labeled based on whether the ball bounced in them or not. We had to create our own dataset. We explored several tools to do so, eventually converging on ‘Fiji’. ‘Fiji’ is an open source image processing package based on ImageJ2. We manually went through 10,000 images from a professional tennis match video one by one and identified the frames where the ball bounced, labeling them as 1 and others as 0. This process was time consuming. It is to be noted that there is an inherent imbalance in the data set - a lot more frames where the ball did not bounce compared to the frames where it did bounce. This necessitated that the ground truth labels that we collected for the ball bounced images be accurate and not noisy. We verified the quality of the ground truth labels by reviewing this process multiple times.
Feature Engineering
We engineered features based on intuition trying to mimic how a human would interpret a trajectory.. We had 4 raw features coming out of YOLO namely, the left_x coordinate, right_y coordinate, width and height of the rectangle encompassing the tennis ball bounding box. We transformed these 4 features into two features - centroid_x and centroid_y coordinate. These 2 features should fully describe the pixel location of the ball in a given image.
Translating the sports (domain) problem into a data science problem
One of the key challenges was coming up with a way to convert the ball bounce detection problem into a data science problem. We discussed multiple possibilities like framing this problem as a vanilla binary classification problem or as a novelty detection problem or as a trajectory prediction problem. Eventually we converged that the best way to model this would be as a many to 1 sequence problem, where the input would be a window of x number of frames and the output is 1 or 0, depending on whether a ball bounced in that window or not. This makes intuitive sense because in a real professional match, whenever the player challenges a line call, the human judge looks at the video replay of a bunch of frames before and after the expected frame where the ball bounced. Based on that window of frames, the human judge first estimates in which frame the ball bounced. Thereafter, he/she makes a decision on whether than was inside the line or outside. We incorporated that intuition while translating the tennis problem into a data science problem.
Pre-processing
The output of the first model (object detection) in our pipeline is a CSV file with coordinates of the ball in each of the frames. As a pre-processing step, coordinates are pulled from these thousands of CSV files (one per frame) and inserted into a single csv file. Thereafter csv files are converted into a numpy array of sliding windows. At this step we remove what we term invalid windows from the bank of sliding windows. Any window of say size 20 where the frames are discontinuous is deemed invalid and is not considered as a candidate window for bounce detection. Discontinuity can happen due to several reasons such as the ball being absent in the field of view such as during a commercial break which means there are no coordinates registered for that particular frame. Also, during a video match there are many frames in which the camera is focused on the face of the player or the players are taking a break and the play has been stopped temporarily.

Figure10: Bounce Detection preprocessing approach
Model Performance Metric
With the above framing of the ball bounce detection problem as a many-to-one sequence prediction problem, we choose AUC (Area Under the Curve) as one of our key metrics for assessing model performance. AUC is the measure of the ability of a classifier to distinguish between classes and is used as a summary of the ROC curve. The Receiver Operator Characteristic (ROC) curve is an evaluation metric for binary classification problems. It is a probability curve that plots the TPR (True Positive Rate) against FPR (False Positive Rate) at various threshold values and essentially separates the ‘signal’ from the ‘noise’. The higher the AUC, the better the performance of the model at distinguishing between the positive and negative classes. When AUC = 1, then the classifier is able to perfectly distinguish between all the Positive and the Negative class data points correctly. If, however, the AUC had been 0, then the classifier would be predicting all Negatives as Positives, and all Positives as Negatives. We achieved an AUC of 89% on training set and 84% on the validation set as shown below.
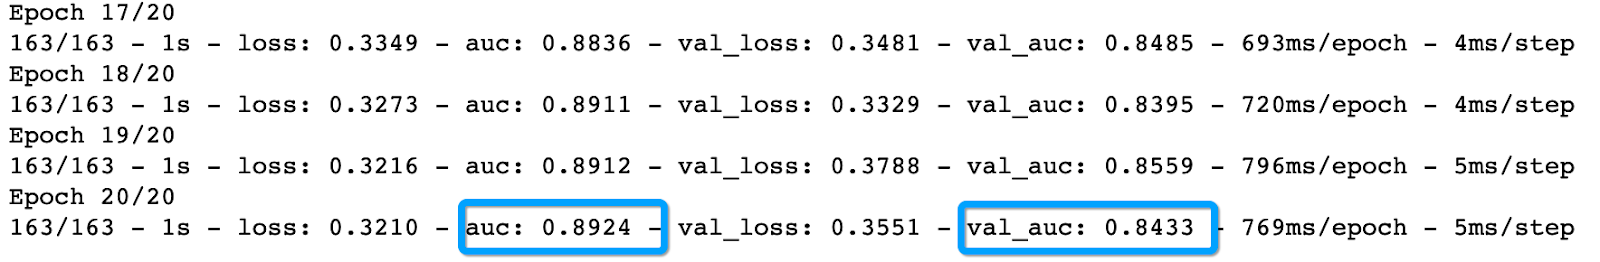
Figure11: AUC values on training and validation set
Performance charts
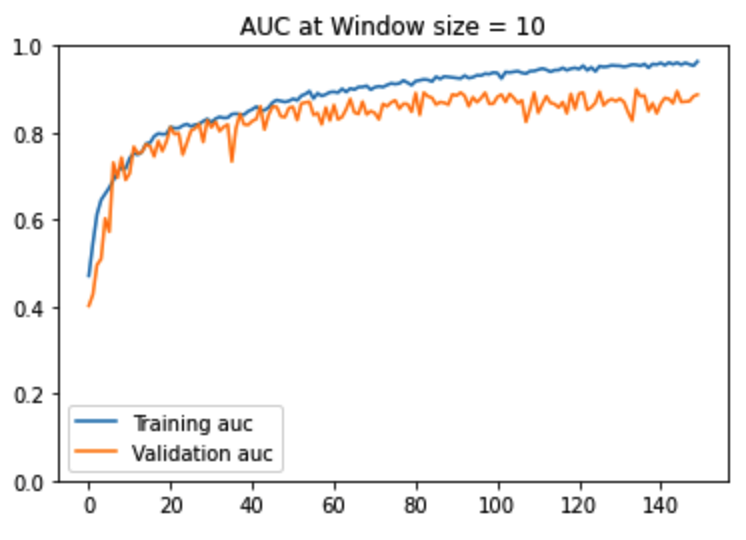
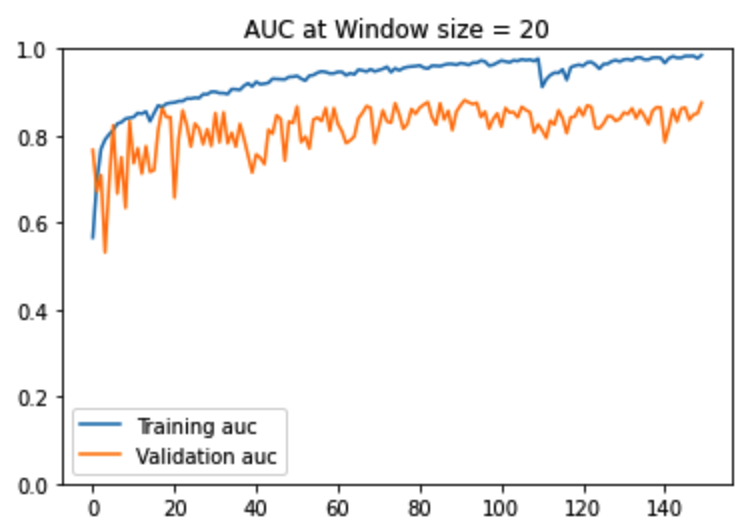
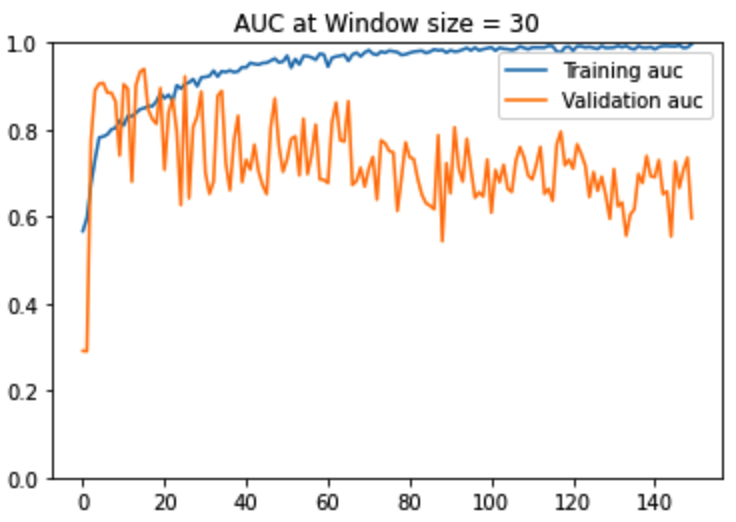
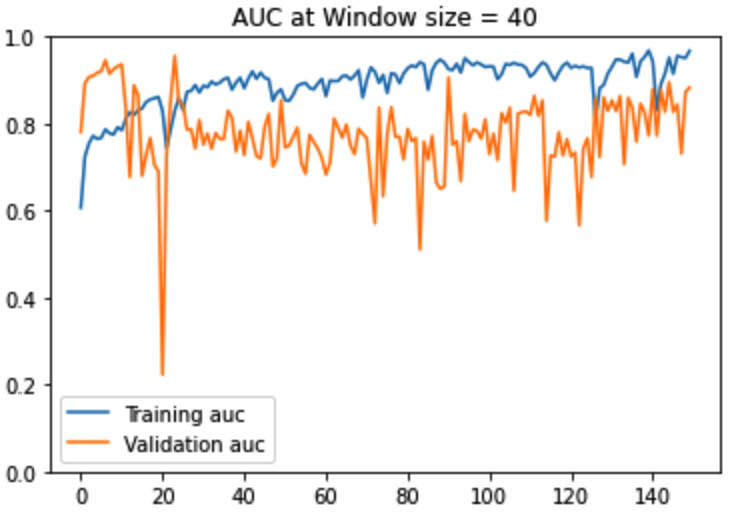
Figure12: AUC -ROC Curves
As seen in the above performance charts, window size = 10 produces the most stable training. For larger window sizes, not only is the training unstable but also the gap between the training and validation AUC is much larger and volatile. For window size = 10, both the training and validation AUC increase upto epoch ~50, thereafter training AUC keeps gradually increasing whereas the validation AUC plateaus. This aligns with intuition because a human being would need no more than 10 consecutive frames to decide whether the tennis ball hit the ground or not. It is to be noted that at a window size of 10 consecutive frames, 22% of all sliding windows have a ball bounce event and 88% do not. There is an imbalance in the dataset. This is to be expected. In a tennis match video, there will always be a whole lot more number of frames without the ‘ball bounce event’ versus with the ‘ball bounce event.’ Considering the imbalance of the dataset, we used the AUC metric to help us assess the quality of our classifier in terms of distinguishing between positive and negative classes.
Model Architecture Choice
We modeled the problem as a many to one sequence prediction problem, the natural choice was to use a Recurrent Neural Network or a Long Short Term Memory Network. RNN is especially designed to deal with sequential data which is not independent and identically distributed. RNN can be useful for modeling short length windows however when windows get larger, due to the vanishing gradient problem, RNN fails to undergo gradient descent. In our case, our optimal window size was found out to be 10, which is not long. Hence RNN worked as well as LSTM. Please see the performance scores below.
Figure13: Model Architecture

Model Error Analysis
It is important to note that the AUC of 85% that we obtained is not the AUC of model # 2 but the overall AUC of the entire pipeline which includes both models 1 and 2. The source of errors can be due to the training data or either of the models. In an ideal scenario:
Data Related Error sources
- The camera is positioned such that the ball is visible in every single frame.
- The court lighting and resolution of the video camera used are adequate.
- There are multiple cameras located at different angles to cross-validate the bounces detected.
- Ground truth labels are collected for every single ball hitting the ground.
- There is an abundance of data on ball bounces.
Model Related Error sources
- Model # 1 has zero false negatives and zero false positives giving AUC of 100% and accuracy of 100% on validation set.
- Each image has detected exactly 1 tennis ball if it exists, avoiding any duplicates.
- Model # 2 has zero false positives and zero false negatives giving an AUC of 100% on the validation set.
Examples of data related sources of error are shown in the images below. Upon reviewing the window of images around this particular frame, a human judge would conclude that the ball did hit the ground in this frame. However, part of the tennis ball is occluded by the player’s head. This makes it very difficult for the model to predict that bounce did happen. Similarly, some balls bounced outside the sideline, some were hit flat hence it was difficult for even a human judge to say where exactly the ball bounced, some balls hit the ground and then rebounded and some balls bounced outside the horizontal lines.
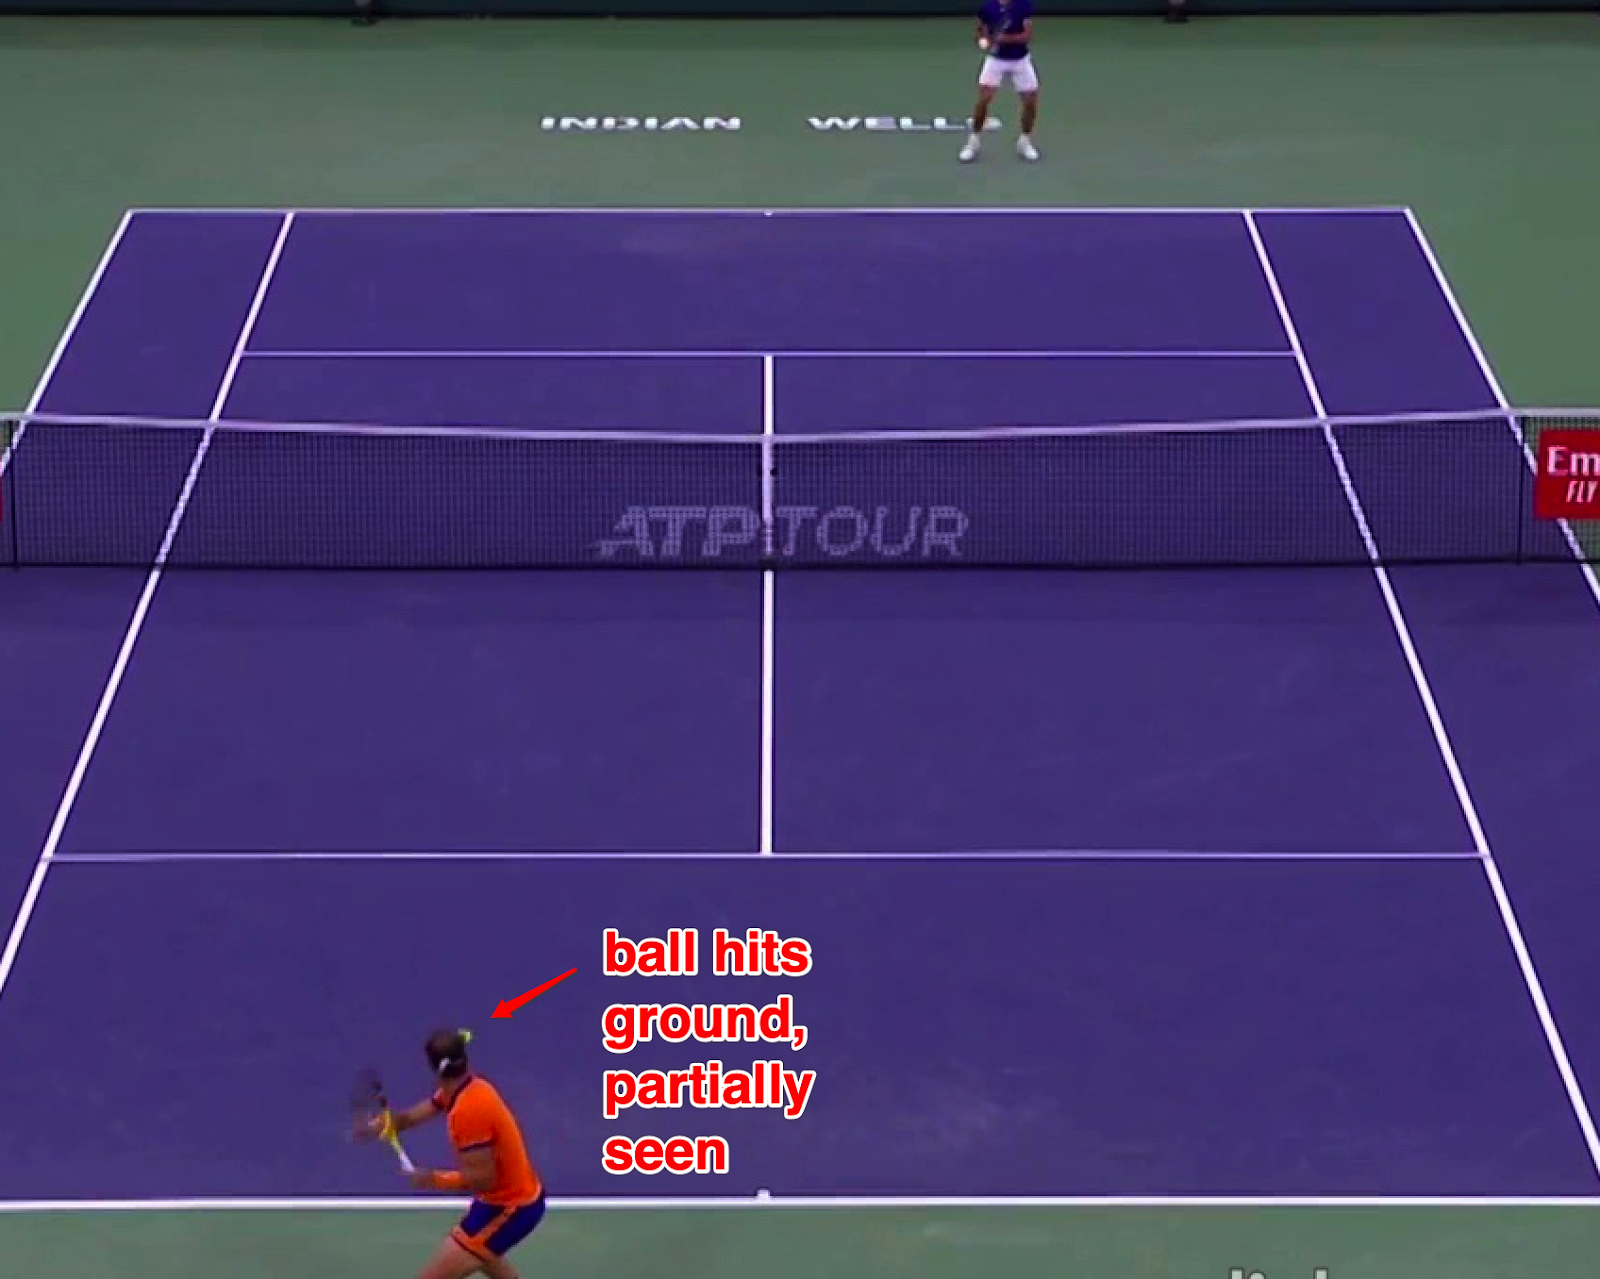
Figure14: Bounce is partially occluded by the head of the player
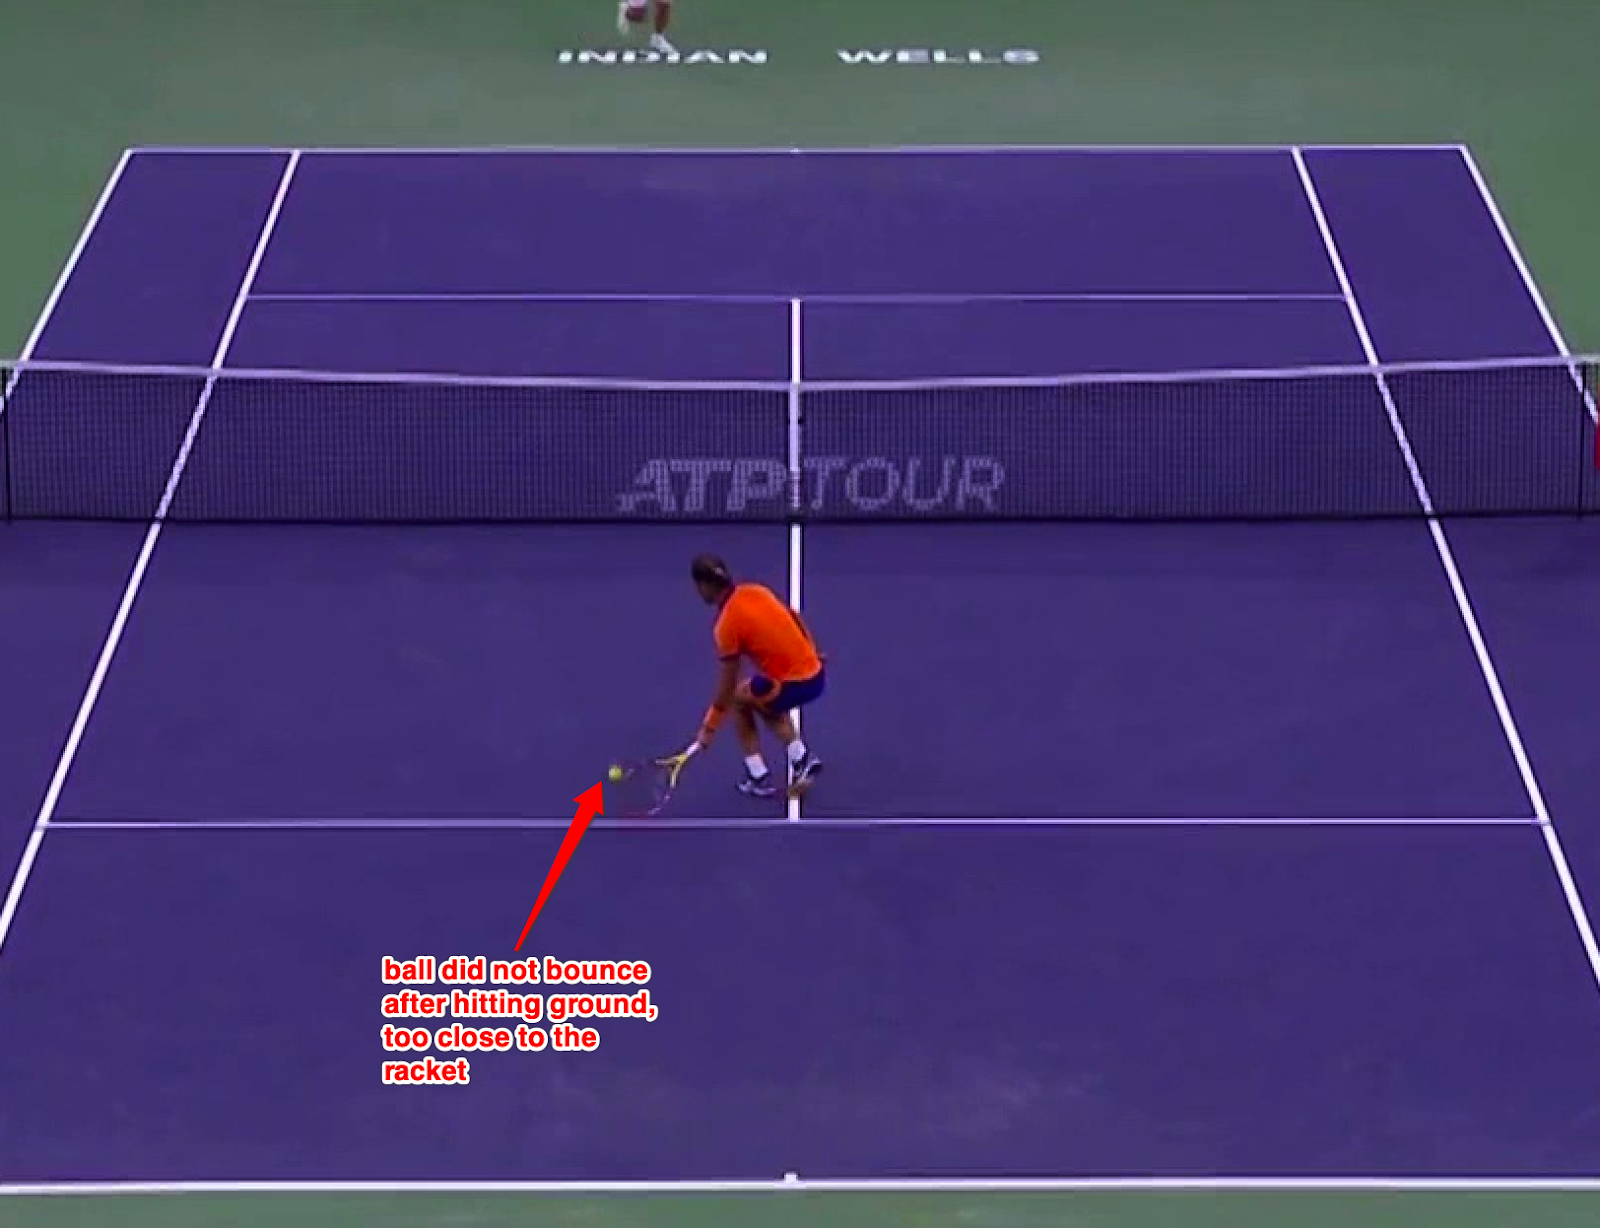
Figure15: Bounce very close to the ground -difficult to distinguish
Conclusion
To conclude, Tennis Ball Bounce Detection is a novel problem. We have explored a solution to this novel problem based on 2 models -Object Detection and Bounce Detection and the models perform well on Performance metrics : 93.9% mAP@0.50 for Object Detection and 85% AUC on validation set for Bounce Detection. Meanwhile, we did face challenges of false detections and null detections in Object Detection.
Future Work
It is critical to realize that the performance of bounce detection is highly dependent on the type of video inputted by the user/player. Now, that we have developed the bounce detection, there are a few future developments that we would like to explore:
- Increase the size of the original image set for Object Detection.
- Implement additional augmentations on the image set for Object Detection
- Implement deepsort based object tracking to remove issues of false object detections or null object detections
- Explore & Implement YOLOv4-tiny reproducibility
- Explore augmentation of input data for Bounce Detection
- Develop an end to end pipeline incorporating both object detection and bounce detection
- Develop the line call component by combining context of ball position as well as court boundary lines
Statement of Work
- Aditya Patel: Tennis Domain expertise, Bounce Detection primary responsibility, GitHub repository primary responsibility, Blog Post shared responsibility, Final Presentation Video shared responsibility
- Sharadwata Ganguli: Video Data extraction primary responsibility, Object Detection primary responsibility, Ethical Evaluation primary responsibility, Final Presentation Video shared responsibility, Blog Post shared responsibility,
Acknowledgements
We are grateful to our instructors Professor Qiaozhu Mei and Winston Featherly-Bean for their valuable guidance, suggestions and feedback as we initiated and progressed through this Capstone Project.
References
- How much do tennis grand slam umpires earn? EssentiallySports. (2021, September 1). Retrieved April 19, 2022, from https://www.essentiallysports.com/atp-wta-tennis-news-how-much-do-tennis-grand-slam-umpires-earn/
- Afp. (2019, March 16). Hawkeye vs foxtenn: Two tech firms are battling it out to win the tennis line-call business. Scroll.in. Retrieved April 18, 2022, from https://scroll.in/field/916856/hawkeye-vs-foxtenn-two-tech-firms-are-battling-it-out-to-win-the-tennis-line-call-business
- Object detection guide. Fritz. (n.d.). Retrieved April 20, 2022, from https://www.fritz.ai/object-detection/
- Background subtraction. OpenCV. (n.d.). Retrieved April 20, 2022, from https://opencv24-python-tutorials.readthedocs.io/en/latest/py_tutorials/py_video/py_bg_subtraction/py_bg_subtraction.html
- Solawetz, J. (2021, October 27). Train Yolov4-tiny on custom data - lightning fast object detection. Roboflow Blog. Retrieved April 20, 2022, from https://blog.roboflow.com/train-yolov4-tiny-on-custom-data-lighting-fast-detection/
- Gandhi, R. (2018, July 9). R-CNN, fast R-CNN, Faster R-CNN, YOLO - object detection algorithms. Medium. Retrieved April 20, 2022, from https://towardsdatascience.com/r-cnn-fast-r-cnn-faster-r-cnn-yolo-object-detection-algorithms-36d53571365e
- IBM developer. (n.d.). Retrieved April 20, 2022, from https://developer.ibm.com/learningpaths/get-started-time-series-classification-api/what-is-time-series-classification/
- Bhattacharyya, J. (2021, September 6). Guide to sktime - python library for time series data (compatible with Sci-Kit Learn). Analytics India Magazine. Retrieved April 20, 2022, from https://analyticsindiamag.com/sktime-library/
- Team, K. (n.d.). Keras Documentation: Timeseries classification from scratch. Keras. Retrieved April 20, 2022, from https://keras.io/examples/timeseries/timeseries_classification_from_scratch/
- Google. (n.d.). Google colab. Retrieved April 21, 2022, from https://colab.research.google.com/signup
- Ytdl-Org. (n.d.). YTDL-org/youtube-DL: Command-line program to download videos from youtube.com and other video sites. GitHub. Retrieved April 21, 2022, from https://github.com/ytdl-org/youtube-dl
- Tzutalin. (n.d.). Tzutalin/labelimg: 🖍️ LabelImg is a graphical image annotation tool and label object bounding boxes in images. GitHub. Retrieved April 21, 2022, from https://github.com/tzutalin/labelImg
- Albumentations documentation - bounding boxes augmentation for object detection. Bounding boxes augmentation for object detection - Albumentations Documentation. (n.d.). Retrieved April 21, 2022, from https://albumentations.ai/docs/getting_started/bounding_boxes_augmentation/#:~:text=322%2C%20117%5D%20.-,yolo,x%2D%20and%20y%2Daxis.
- Gandhi, A. (2021, May 20). Data augmentation: How to use deep learning when you have limited data. AI & Machine Learning Blog. Retrieved April 21, 2022, from https://nanonets.com/blog/data-augmentation-how-to-use-deep-learning-when-you-have-limited-data-part-2/
- Albumentations documentation. Albumentations Documentation. (n.d.). Retrieved April 21, 2022, from https://albumentations.ai/docs/
- Yolov5 controversy - is yolov5 real? Computer Vision, OpenCV, AI & Augmented Reality Tutorials. (n.d.). Retrieved April 19, 2022, from https://www.augmentedstartups.com/blog/yolov5-controversy-is-yolov5-real
- Redmon, J. (n.d.). Darknet: Open source neural networks in C. Retrieved April 21, 2022, from https://pjreddie.com/darknet/
- ArXiv:2107.00821v2 [cs.SE] 29 jul 2021. (n.d.). Retrieved April 23, 2022, from https://arxiv.org/pdf/2107.00821.pdf