Version and date: 1.6, 02/11/2021
Guide about Affordable CO2 detectors for COVID-19 Prevention
Florentina Villanueva1,2, Elena Jiménez1, José Manuel Felisi3, Tomás Garrido3, José Luis Jiménez4, Mila Ródenas5 y Amalia Muñoz5
1 Instituto de Investigación en Combustión y Contaminación Atmosférica. Universidad de Castilla-La Mancha (ICCA-UCLM), Camino de Moledores, s/n. 13071 Ciudad Real.
2 Parque Científico y Tecnológico de Castilla-La Mancha. P. Innovación, 1, 02006. Albacete.
3 Asociación Mesura, Valencia.
4 Departamento de Química y CIRES. Universidad de Colorado, Boulder (Colorado) CO 80309-0216. Estados Unidos.
5 Fundación CEAM. C/ Charles R. Darwin 14. Parque tecnológico 46980 Paterna, Valencia.
Twitter: @FloriVilla3 @EJimenez_UCLM @felisi2punto0 @TomsGarridoPre1 @jljcolorado @Mila_Rodenas @amaliaceam
Contact: Florentina.VGarcia@uclm.es; Elena.Jimenez@uclm.es; jmfelisi@gmail.com, tgarridoper@gmail.com; jose.jimenez@colorado.edu; mila@ceam.es; amalia@ceam.es
Link to this document: https://bit.ly/monitorsCO2
Link to Spanish version: https://bit.ly/medidoresCO2
Objective. There is an urgent need to measure CO2 indoors, where the air is shared, to reduce the risk of COVID-19 infection, There is also a great variation in the quality of existing low-cost sensors. For these reasons we did a quick intercomparison of different sensors available in Spain. In this document, we share the results with the aim of recommending good quality sensors to the citizenship. The tests carried out are limited given the urgency of the subject and are documented at the end of this document. It will be updated with new information.

How to cite: F. Villanueva, E. Jiménez, J. M. Felisi, T. Garrido, J. L. Jiménez, M. Ródenas, and A. Muñoz. Guide about affordable CO2 detectors for COVID-19 Prevention, versión 1.4, 17/04/2021. https://bit.ly/monitorsCO2
- GENERAL RECOMMENDATIONS
When purchasing a CO2 detector to be installed in indoors (classrooms, meeting rooms, bars, restaurants, etc.) the following considerations should be taken into account:
- Ventilation: To avoid getting indoor CO2 levels higher than 700 ppm, ventilation is needed. If there is natural ventilation, we recommend a continuous, crossed and distributed ventilation. It is necessary to ventilate the space at outdoor CO2 levels (usually, around 410-420 ppm). In Spain, there is a very useful “ Guide for Ventilation in Classrooms” from CSIC: http://hdl.handle.net/10261/225519.
- Mobility: Mobile devices can work with batteries, but their durability must be ensured. If the device is permanently installed in the room, it is recommended to be plugged-in.
- Sensor Time Response: The response time of the sensor must be short, on the order of several seconds, but some sensors have a time response of about 2 minutes.
- Data acquisition and processing: Most of the tested devices only have histograms without the possibility of exporting data. If possible, it is recommended to buy a CO2 detector with the option “export data”.
- Location: The device must be located away from an open door or window at the most unfavorable point of ventilation. It has to be placed at a height of approximately 1.5 m and more than 1 m from people. Measurements in several places of the room allow to detect poorly-ventilated zones.
- Verification of the initial measurement (Background calibration): Before starting to measure indoors, check the measurement outdoors (a value close to 400 ppm). This way we will know whether it is properly calibrated when purchased or it needs to be re-calibrated.
- RECOMMENDED CO2 METERS
Devices with non-dispersive infrared (NDIR) sensors work very well. Cheaper devices with several sensors that also measure, TVOC and HCHO are not recommended, because they use another type of sensor that can not suitably work.
The following table shows some of the characteristics of the tested devices which yielded satisfactory results.
Note: If someone detects an error or omission in any of the specifications, contact us by email.
Device | Data export | Battery | Autonomy | Background calibration |
Aranet4 | + Smartphone & PC | +
| Several years | +
|
Kkmoon,etc Dioxcare | + PC as PDF file | +
| 14 h max. | +
|
Soulong/Gototop, Mod. PHT-2000 | + PC | +
| Non available | +
|
AZ 7755 | + PC | +
| > 24 h | +
|
Nrpfell | X Monitor | +
| X
| |
Temtop, Mod. M2000C/M2000 | X Monitor & Histogram (New versions +) | +
| 6 h | +
|


Device | Data export | Battery | Autonomy | Background calibration |
Wöhler CDL210 | + PC as csv file | X
| Plug-in | + |
Monitor SA1200P | X Monitor & Histogram | 2 versions +
|
10 h Plug-in | + |
SignCO2 | + No monitor Smartphone & PC | +
| 5 years | X
|
CO2Panel pi | + No monitor Smartphone & PC | X | Plug-in | + |
SanisCO2 LITE | + No monitor Smartphone (only Android) & Tablet | X | Plug-in | X |
MICA LITE | + No monitor Smartphone or PC | X | Plug-in | + |
Airok CO2 | + Smartphone, PC, Smart TV, tablet | + | Several months | +
|
DM 72C | X Monitor | X | Plug-in | X |
DM 1306 | X Monitor | X | Plug-in | X |
DM 1307 | X Monitor | X | Plug-in | X |
Air Experience (Sanity Air) | X Monitor
| X
| Plug-in
| X
|
CO2Panel Matrix | + Monitor Smartphone & ordenador | X
| Plug-in
| + |
Other CO2 meters, not tested * | ||||
CO2SEQ | + Histogram& PC as PDF file | X
| Always connected to a PC to register | X |
Airea (by ROBOTBAS) | X | X
| Plug-in
| + Manual |
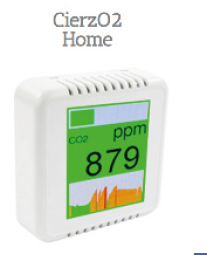
CierzO2 Home | + Monitor PC | X
| Plug-in
| + Manual |
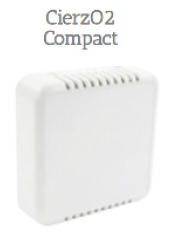
CierzO2 Compact | + PC | X
| Plug-in | + Manual |


* There are other CO2 meters in the Spanish market at a price slightly higher than € 200, some of them with ENAC certification, such as the CO2SEQ model from SEQUOPRO (https://www.sequopro.es/detectores/detector-co2-sequopro).
Technical description
All results from the tests carried out with the above and other devices are detailed in section 4.2. Check the number of units tested in the table at the end of this document.
- The Kkmoon / Kecheer / Curconsa / Aprotii devices (names of the different manufacturers) are robust equipment. They are highly reproducible at least up to 2000 ppm. They require a re-calibration prior to be used. These devices have the advantage that the data can be exported as a PDF file and they can be copied to an Excel spreadsheet for analysis.
- Aranet4 detectors, although somewhat more expensive than the rest, are very accurate, similar to the reference CO2 detectors used. These devices present the advantage that data can be obtained from an app. It is recommended to do a weekly calibration.
- Soulong /Gototop devices can also be used to monitor CO2 indoors with average deviations from the reference detector less than 6%.
- AZ7755 devices are also a feasible option with a good quality / price ratio, although their price is higher than the Kkmoon / Kecheer / etc. Data can be stored and analyzed on a PC with the appropriate cable.
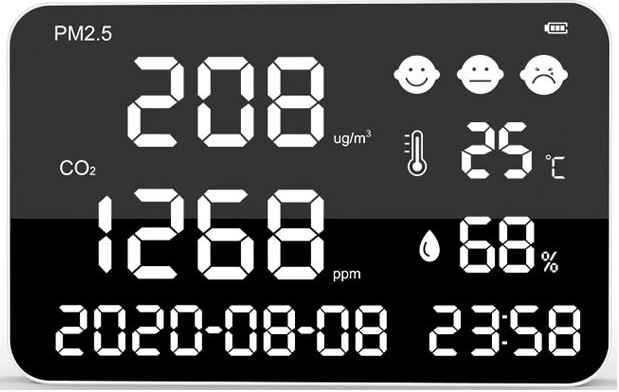
- The Temtop M2000C device shows an average deviation (in absolute value) of around 7%. No data export. This detector also measures the level of PM2.5 and PM10 particles, although the concentration values provided are not reliable when compared to the DustTrak 8533. The M2000 model also measures HCHO and total particles. We observe an average deviation of 7-15% in absolute value.
- Nrpfell meters are benchtop. They can be used as mere indicators of the CO2 level in a room as they do not export data. However, this CO2 meter correlates very well with the reference meter (average deviation of 1%), making it a good option based on the quality/ price ratio. Unfortunately, they do not have the calibration option by the user. Response time <3s.
- Wöhler CDL210 is also a good choice based on the quality / price ratio. It enables continuous logging and subsequent data export to PC (even if there is a power outage). However, it needs to be plugged in during the measurement. If the equipment is turned off without downloading the data and then turned on again, the recorded data will be lost. If it is unplugged, the battery lasts around 10 hours, but exclusively for the internal clock not for recording data.
- The SA 1200P monitor has a good quality / price ratio. The tested model does not export data, although there is another one that it does. It is a benchtop meter that needs to be plugged in during the measurement. It does not allow data export. It only allows the data visualization on the monitor or in the histogram. It has a very simple menu and has the option of background calibration.
- The SIGNCO2 meter presents a good correlation with respect to the reference CO2 meter employed. Currently, this device has no display to monitor the CO2 concentration. The measurement frequency is programmable, but the minimum time is 11 minutes. It would be desirable to have a 1-min measurement to better see the changes in CO2 level. This device also needs a display to monitor the readout of the CO2 level. It does not need to be plugged in to measure or download the data. Battery durability is 5 years. The data is sent through the TELEGRAM messaging application and the company sends the data plotted in Excel to your email address.
- The CO2panel “pi” meter has a good quality / price ratio. It does not have a display to monitor the CO2 concentration, but it does have a traffic light LED that lights up according to the CO2 level. These alert levels are programmable. The measurement time is also programmable: 1 min, 5 min, etc. It needs to be permanently plugged in during the measurement. It has the possibility of manual or automatic calibration (programmable). Recorded data is downloaded at http://www.co2panel.com/control/ by entering the meter's MAC / NICK ID. Configuration of the equipment through the internet connected via WiFi. This CO2meter can also be purchased in the UK.
- The SanisCO2 LITE device has a good quality / price ratio. The measurement is continuously monitored on the screen of the mobile or tablet through an app. In the mobile application the data has to be refreshed each time, but in the tablet application (currently more developed) it allows observing the measurement in real time. At the moment, the mobile app is only available for the Android system. They are working on downloading data from the mobile as well. It is designed for public spaces. It has a dual beam sensor to correct the drift in time of the measurements. The user has not to calibrate the equipment.
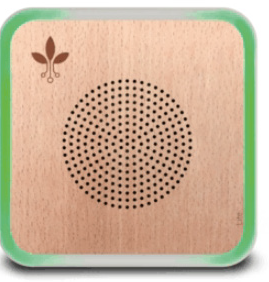
- InBiot MICA Lite CO2 meters are designed to continuously monitor the indoor air quality. That is why it is a device that must be permanently plugged in. It has some LEDs that light up automatically depending on the ventilation needs of the space. GREEN: <800 ppm; YELLOW: 800–1500 ppm; RED:> 1500 ppm. These alerts can be scheduled for email alerts. For educational centers the established ranges are lower than those. Configuration is an advantage of internet connected devices. It has a simple and intuitive interface. Online storage and data download. CONNECTIVITY and INTEGRATION are the strong points of these CO2 meters. It can be integrated into third-party platforms through an app and even with BMS or home automation systems through the ModBus RTU communication protocol, allowing the management of air conditioning and ventilation equipment. In addition to measuring CO2, relative humidity and temperature, it has an indicator of the probability of virus spread based on the previous measurements and on the particles in suspension. It is recommended to leave it plugged in for at least 24 hours before starting to measure to obtain reliable data. The MICA Lite has a dual-beam sensor and has an internal algorithm that varies the self-calibration cycle to adapt to the type of ventilation in the space, making this self-calibration much more reliable and robust. The user indicates the type of ventilation of their space during configuration. Updated MICA Lite data recording is configurable up to 1 minute.
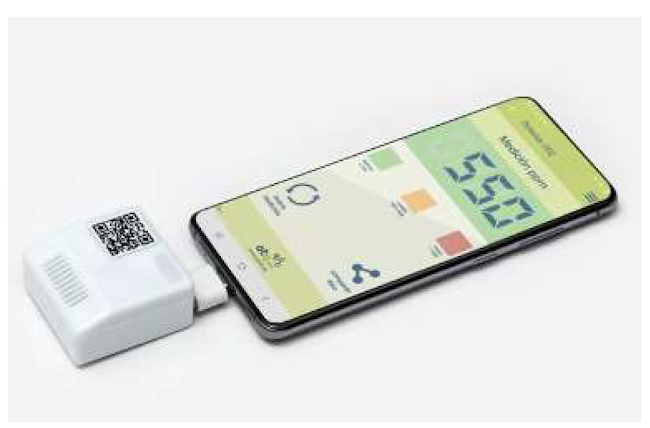
- The Airok CO2 meter is a good option in relation to quality / price. It has a low consumption electronic ink screen to monitor CO2 in real time and allows continuous recording and sending of data to the cloud via WIFI. Portable, it does not need to be plugged in to measure or download data. Manual calibration and autocalibration (programmable). Programmable and configurable light and acoustic warnings, even it sends alerts by email or telegram. The app (www.medirco2.com) allows the data download (CO2, T, Humidity and Pressure) in EXCEL spreadsheet and also through a QR code. It can be integrated into third-party platforms, allowing automation of air conditioning and ventilation equipment.
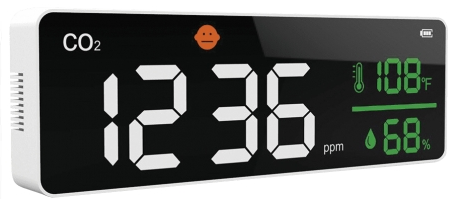
- DM monitors work have to be continuously plugged-in to measure CO2 (mod. DM72C has an autonomy of 9 hours). Variable screen size, depending on the model. Model DM1307 (big screen), DM1306 (wall mount) and DM72C (desktop). They do not export data, they only give instant information. It is factory calibrated and cannot be calibrated manually.
- The Air Experience, a CO2 meter from Sanity Air, has to be plugged-in continuously during the measurement. This device cannot store/process data, it only gives instantaneous information. It has a small visible color screen and a small internal fan that favors the homogeneity of the measured air. It makes a little noise, but can be disabled from the factory. It is factory calibrated, but the option of manual calibration is not available manually.
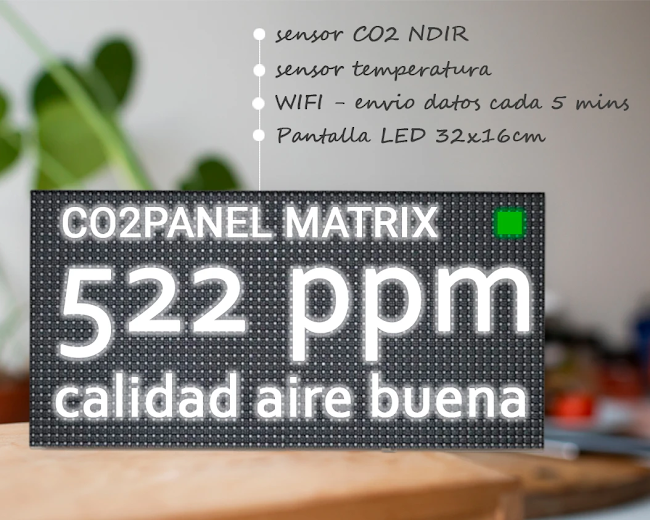
- The CO2Panel Matrix meter has to be continuously plugged-in during the measurement and data acquisition. It has a highly visible screen which makes this CO2 detector very suitable for professional use in restaurants, leisure centers, classrooms, meeting rooms and in all those rooms where it is convenient to monitor the CO2 level, as this measure is an indirect way to see the possibility of contagion by COVID19 or other diseases caused by pathogens that can be transmitted through aerosols. Accuracy for CO2 measurement is + -50ppm (+ 5% of reading) and the equipment is delivered calibrated, but it can be calibrated manually. CO2Panel MATRIX incorporates an internet connection via wifi, so that it sends the information to the CO2Panel cloud for further analysis.
- The CO2 meters from Airea (by ROBOTBAS) have a very good quality/ price ratio. It has a powerful, highly visible tricolor illumination to indicate the need for ventilation in real time and an acoustic warning. The data download is done by days, being impractical for long-term studies.
- The CO2 meters from CierzO2 (by Telidia) have two possibilities of presentation: with display (Home model) and without a display (Compact model). The suitability of each model depends on the customer’s needs. Both models have a color scale according to the air quality. The frequency of data recording (20 s) makes it possible to have a more controlled evolution of CO2 in the environment.
- CHARACTERISTICS OF THE TESTED NDIR CO2 METERS
The specifications of these devices are summarized in the table below along with approximate pricing. Mostly it has an uncertainty / precision of ± 30-50 ppm plus 1.5-3% of the reading at a resolution of 1 ppm. The commercial devices that have been compared or will be compared are:
- Kkmoon/Kecheer/Curconsa/Aprotii (different distributors)
- Dioxcare sold by Quantum Spain.
- Aranet4
- Soulong/ Gototop modelo PHT-2000
- AZ instruments Co. Modelo 7755
- Temtop, modelo M2000C
- Nrpfell
- EGVOC-165W Air Quality Monitor
- Wohler CDL 210
- Monitor SA1200P
- SIGNCO2
- CO2panel
- SanisCO2 LITE
- MICA LITE by Inbiot UPDATED!
- Airok CO2
- DM72C
- DM1306
- DM1307
- Sanity Air
- CO2 panel MATRIX
- Airea by ROBOTBAS NEW!
- CierzO2 by Telidia NEW!
Specifications for these devices are summarized in the table below along with approximate pricing. Mostly it has an uncertainty / precision of ± 30-50 ppm plus 1.5-3% of the reading and a resolution of 1 ppm.
Device | Price* (€) | Measurement range (ppm) | Sensor model | Additional parameters** |
Aranet4 | 199 | 0-9999 | Sensair Sunrise | RH, T |
Kkmoon/Kecheer | 95 | 0-9999 | (1) | RH, T |
Dioxcare | 129 | 0-9999 | (1) | RH, T |
Soulong/Gototop, Mod. PHT-2000 | 115 | 0-9999 | n.a. | RH, T |
AZ 7755 | 155 | 0-9999 | n.a. | RH, T |
Nrpfell | 75 | 0-2000 | n.a. | RH, T |
Temtop, Mod. M2000C | 155-190 | 0-5000 | MH-Z19A | RH, T, PM2.5, PM10 |
EGVOC-165W (AQM) | 95 | 400-5000 | n.a. | RH, T, PM1.0, PM2.5, PM10, HCHO, TVOC |
Wöhler CDL210 | 183 | 0- 2000 | n.a. | RH, T |
Monitor SA1200P | 155 | 0-5000 | n.a. | RH, T |
SignCO2 | 200 | 0-5000 | GSS CozIR LP | RH, T |
CO2panel “pi” | 129 | 0-500 | Winsen MH-Z19A | T |
SanisCO2 LITE | 125 | 400-5000 | Cubic CM1107 | - |
Mica LITE Inbiot | 320-400 (2) | 0-5000 | Not available | RH, T, PM2.5 |
Airok CO2 | 185 | 400-9999 | GSS COZIR LP3 | RH, T, P |
DM 72C | 76 | 0-5000 | TES0902 (3) | RH, T |
DM 1306 | 55 | 400-5000 | TES0902 (3) | RH, T |
DM 1307 | 105 | 400-5000 | TES0902 (3) | RH, T, PM2.5,PM1 y PM210 |
Device | Price* (€) | Measurement range (ppm) | Sensor model | Additional parameters** |
Sanity Air | 250 | 0-40000 | SCD30 (3) | RH, T |
CO2 panel MATRIX | 169 | 0-5000 | MHZ-19C | T |
Airea by ROBOTBAS | 119 | 400-10000 Precisión: ±50 ppm | SCD30 (3) | RH, T, TVOC (Rango: 0-1187 ppb, Precisión: ±100 ppb) |
CierzO2 Home | 125 | 0-5000 | MHZ19C | RH, T |
CierzO2 Compact | 105 | 0-5000 | MHZ19C | RH, T |
* The price of these CO2 meters is approximate, since it is currently increasing because of the high demand.
- We have observed that there are models of this device that have a SenseAir S8 sensor and others that have a Honeywell CRIR-M1, a Cubic CM1106 or o a ZyAura ZG09 sensor.
- This price includes multiple possibilities of cloud services.
- Double-beam sensor.
- TECHNICAL SUMMARY ON THE INTERCOMPARISON STUDY.
4.1. Methodology
This section presents the technical summary of the intercomparison of various low-cost CO2 detectors. As a reference, the following detectors were used: DELTA OHM (see link) and CHAUVIN-ARNOUX (see link) used by ICCA-UCLM in Ciudad Real, and TESTO / CASELLA by MESURA in Valencia. These NDIR (Non Dispersive Infrared Detector) sensors have an accuracy of ± 50 ppm with a resolution of 1 ppm. Alternatively, other sensors previously validated have been used as a reference.
It is not a perfect calibration, nor according to any regulations.
Definitions and statistical parameters
Correlation: To evaluate how the measurements of the low-cost CO2 meter correlate with respect to the reference one, the CO2 concentration (in ppm, parts per million by volume) from the low-cost meter is plotted against that measured by the reference CO2 meter. The linear relationship, given by the equations that appear inserted in those plots, indicates this correlation.
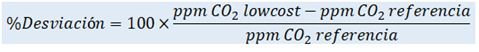
% Deviation: This parameter indicates the relative error in the measurement from the low-cost device with respect to the reference one. The closer to ZERO, the better.
At the end of this document, some statistics obtained in each intercomparison are summarized and that appear in the figures where the percentage deviations (% deviation) appear, such as:
- 99th percentile (P99): Reflects that 99% of CO2 measurements show a % deviation lower than the indicated value.
- 95th percentile (P95): Reflects that 95% of CO2 measurements present a% deviation lower than the indicated value.
- Median or P50: 50% of the measurements present a % deviation lower than the indicated value.
- Minimum, maximum and average value of the observed %deviation .
4.2. Results of the intercomparison
This section shows the technical summary of the intercomparison of various low-cost CO2 detectors.
Kkmoon/Kecheer/etc. versus Delta Ohm/ Testo/ Casella
Figure 1 shows the comparison of CO2 measurements recorded in a nursery classroom and a primary classroom in a school Ciudad Real (Spain).
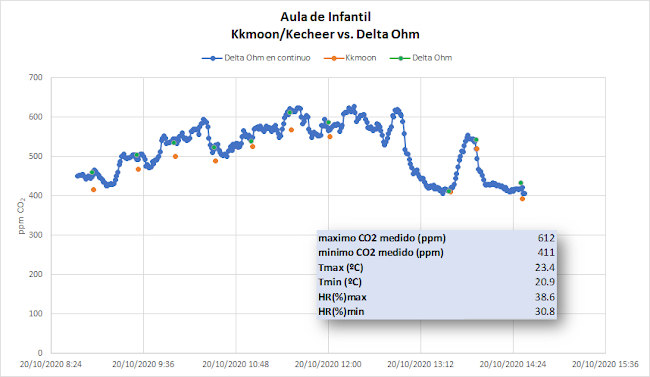
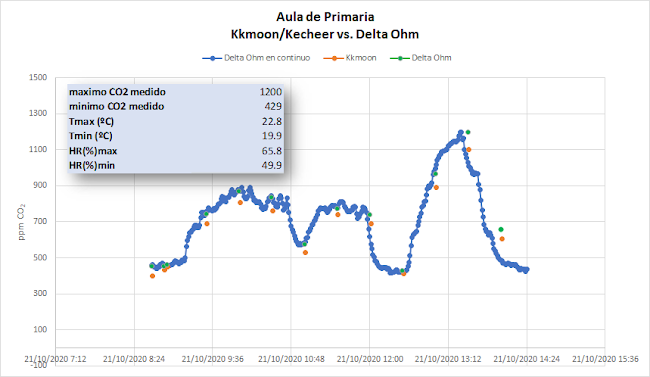
Figure 1. Comparison of the recorded CO2 levels in two classrooms with toddlers (w/o masks) and kids wearing masks.
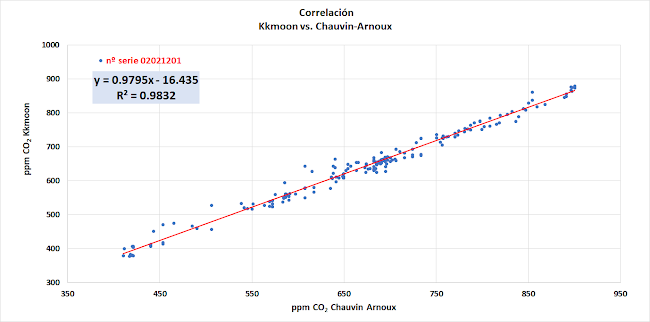
As shown in Figure 2, the tested sensor generally underestimates the amount of CO2 (average of 10%) over the entire measurement range (400-600 ppm). Table 3 presents more statistical data.
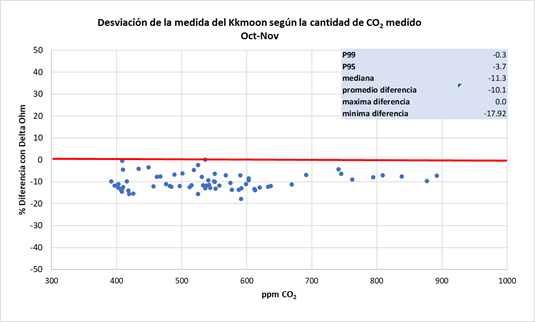
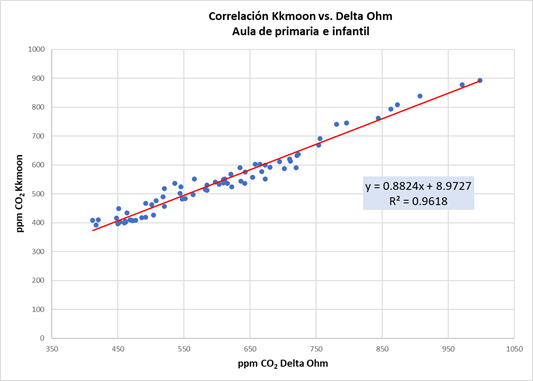
Figure 2. Deviation and correlation of the single CO2 measurements from Kkmoon versus Delta Ohm detector.
Kkmoon devices were subjected to the effect of gels, alcohols, home-cleaning products and its response was not affected. When received, a calibration (single point @400 ppm) is needed. In Figure 3, the blue bars represent the outdoor CO2 measurement before calibration (once received) and the orange ones after calibrating 10 sensors.
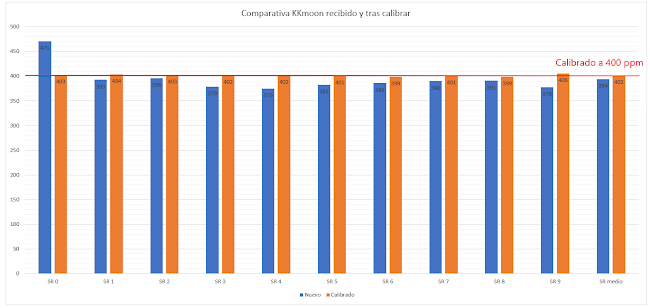
Figure 3. Response of 10 Kkmoon sensors before and after calibration at home.
The reproducibility of these Kkmoon detectors is excellent, as shown in Figure 4.
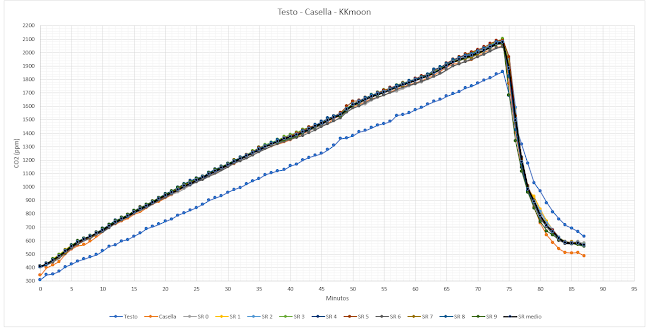
Figure 4. Simultaneous measurement of CO2 around 1.5 h with 10 Kkmoon compared with Casella and Testo reference detectors.
After the 1st calibration carried out on November 15, 2020, the 10 units of Kkmoon or similar (named as SR0, SR1,… SR9) were simultaneously re-calibrated on December 22, 2020 at the same place. The results obtained are summarized in the following table:
Background calibration OUTDOORS | ||||
Sensor | 1st Calibration 15-nov (ppm) | Outdoor measurement after 37days (ppm) | 2nd Calibration 22-dic (ppm) | % Deviation in 37 days |
SR0 | 401 | 436 | 398 | 8,7% |
SR1 | 400 | 440 | 400 | 10,0% |
SR2 | 405 | 544 | 396 | 34,3% |
SR3 | 402 | 444 | 395 | 10,4% |
SR4 | 399 | 431 | 400 | 8,0% |
SR5 | 401 | 474 | 396 | 18,2% |
SR6 | 398 | 424 | 400 | 6,5% |
SR7 | 403 | 436 | 401 | 8,2% |
SR8 | 400 | 432 | 400 | 8,0% |
SR9 | 401 | 441 | 401 | 10,0% |
Average: 12,2% | ||||
Among the 10 devices, there are two (SR2 and SR5), and especially the SR2, which have a greater deviation than the rest.
Conclusion: The devices respond very well to calibration and have a positive drift of 10% after 37 days of use.
RECOMMENDATION: Monthly calibration of the equipment in clean outdoor air.
The battery durability of these 10 devices has been tested, based on standard operating conditions (data storage every 5 minutes) and minimizing the consumption due to the brightness of the display (Brightness, 25%). With this configuration, the uninterrupted operating time has been verified by varying the “OFF Backlight” option:
Data Storage | Brightness | OFF Backlight | Maximum autonomy |
5 minutes | 25% | OFF | 10 hours |
5 minutes | 25% | 1 minute | 14 hours |
The instruments can operate with a data storage every 5 minutes for a maximum of 14 hours.
Additional tests:
Five more units of “Kkmoon or similar” model SR510A have been tested to check for reproducibility. The CO2 level was measured two different days in two indoor environments. The average difference (in absolute value) between the tested CO2 meter with an arbitrary one lies between 9.2 and 21.3 ppm, below the accuracy stated by the supplier

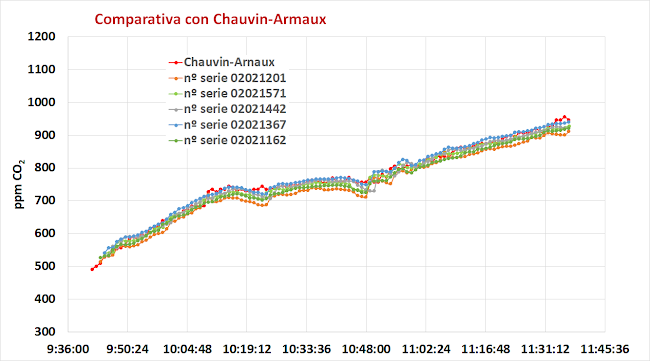
The improvement of the measurement after calibration was also checked in all devices. A couple of examples are shown below.
Serial number 02021162
No calibration, just after reception of the device
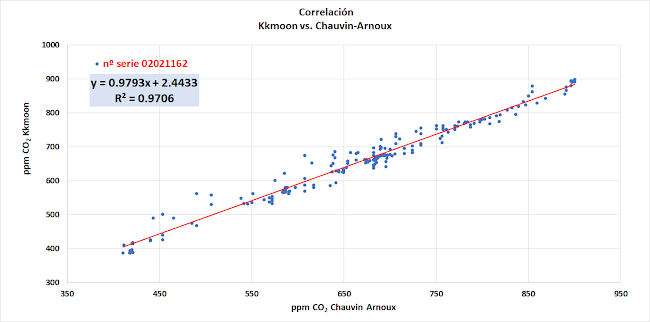
After calibration outdoors
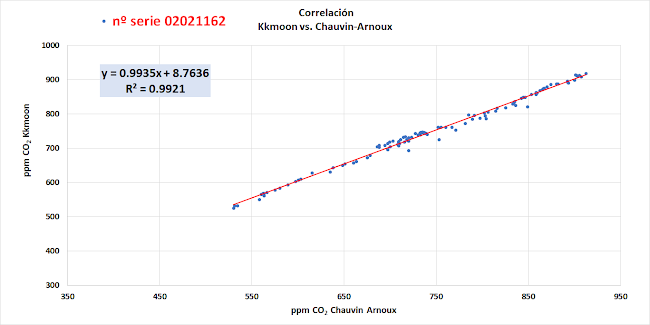
Serial number 02021162
No calibration, just after reception of the device
After calibration outdoors
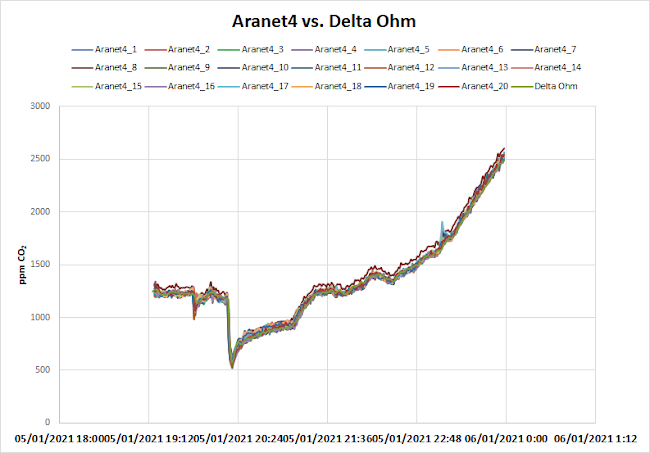
Aranet4 versus Delta Ohm
Aranet4 detector has been tested against the Delta Ohm in two classrooms in a school of Ciudad Real (Spain), toddlers (5 years old w/o mask) and 9-yr kids (with masks). This detector continuously records the data, as Delta Ohm does. Figure 6a shows the excellent correlation between the measurements from Aranet4 and those from Delta Ohm in both classrooms. In general, the readout of Aranet4 is slightly higher than the one from Delta Ohm, but it is a negligible difference. As it can be seen in Figure 6b, CO2 measurements from Aranet4 and the reference detector are highly consistent with average deviations of approximately 2% (Figure 6) over the 400 -900 ppm range.

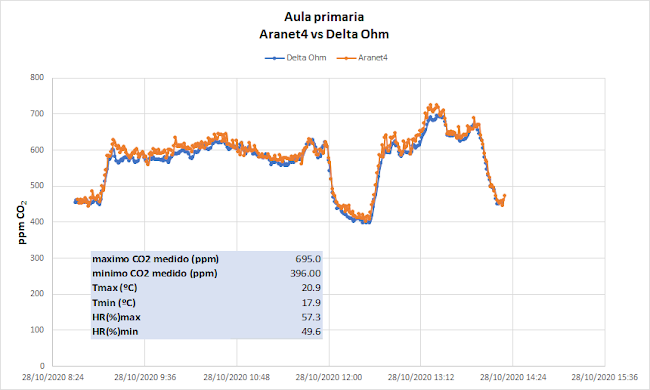
Figure 5. Comparison of the CO2 measurements in two different classrooms.
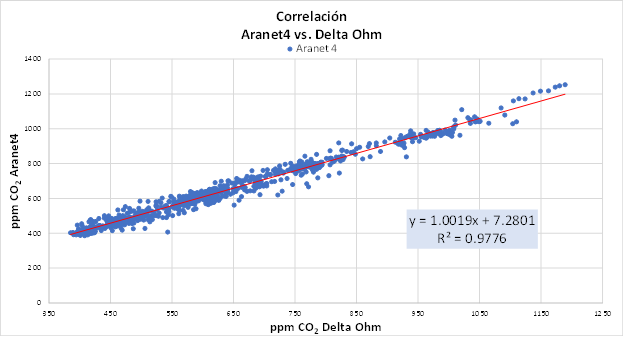
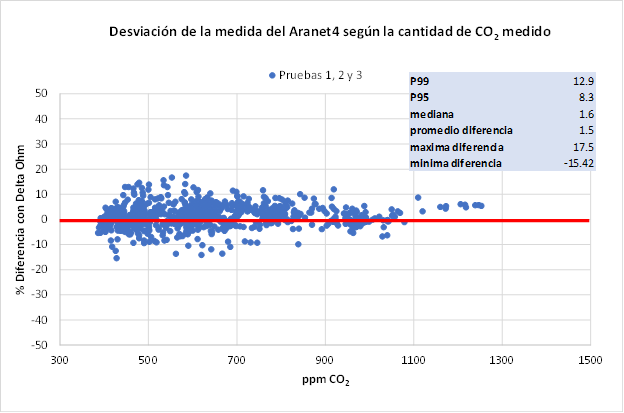
Figure 6. Correlation of all measurements and deviation (in % difference) of Aranet4 with respect to Delta Ohm as a function of the CO2 level.
Soulong/Gototop, Mod. PHT-2000 versus Delta Ohm
Soulong / Gototop devices slightly underestimate the amount of CO2 relative to the Delta Ohm measurement, as shown in Figure 7. The test was carried out in two high school classrooms in Ciudad Real (Spain).
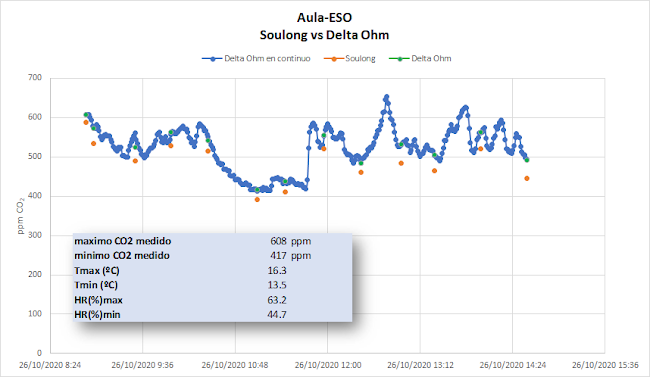
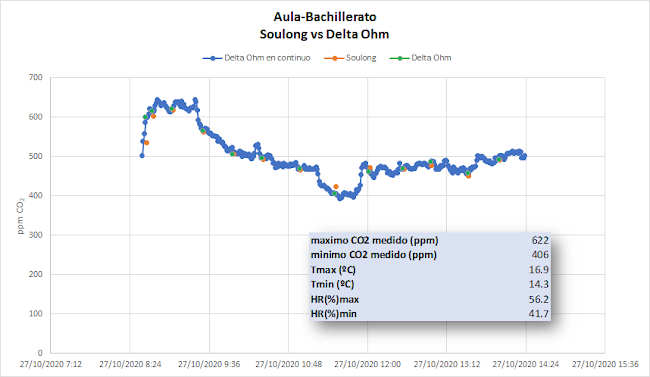
Figure 7. Comparison of CO2 measurements in a high school in Ciudad Real.
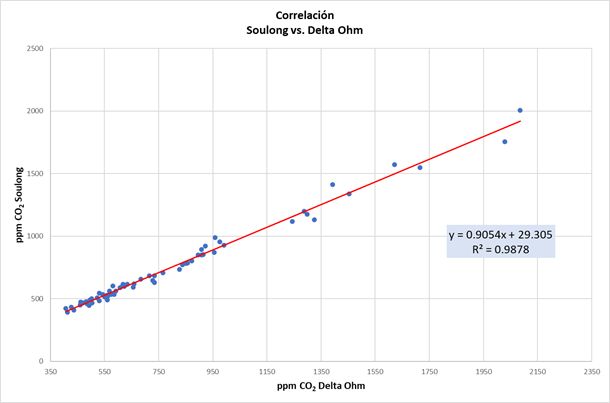
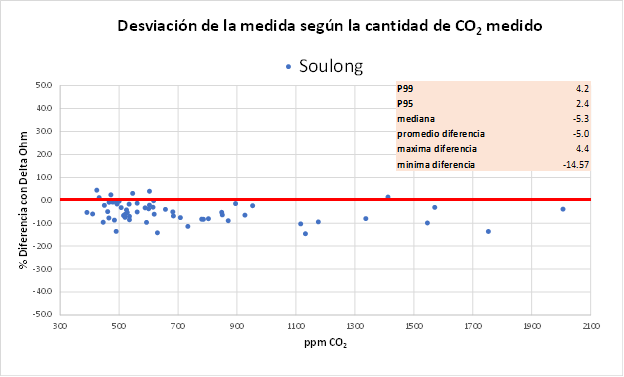
Figure 8. Correlation and deviation (in % difference) of Soulong/Gototop with respect to Delta Ohm as a function of the CO2 level.
Twenty more units of Aranet4-Pro were simultaneously tested to check their reproducibility and their correlation with the reference CO2 meter (Delta-Ohm). Aranet4-Pro are highly reproducible. The difference in the CO2 level among them is always below the accuracy stated by the supplier.
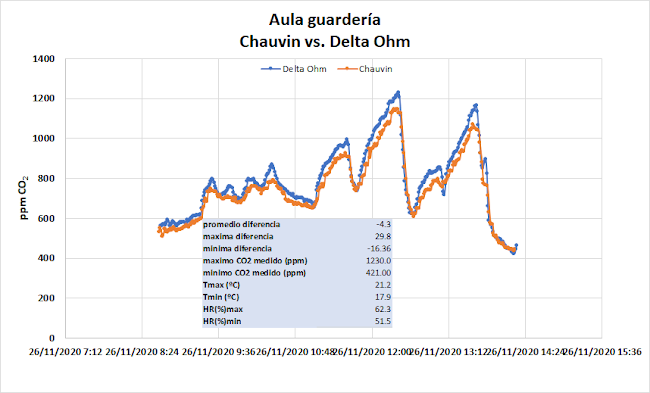
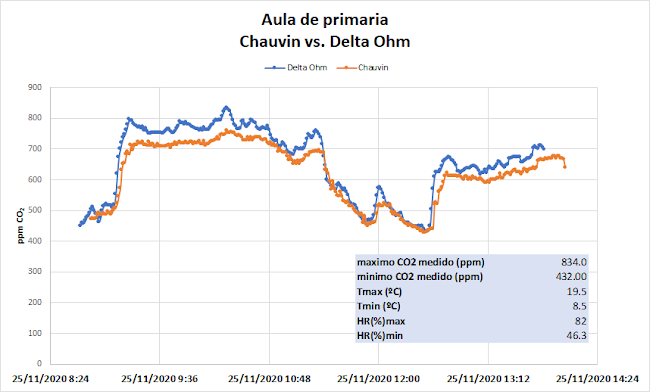
AZ inst. Mod. 7755 versus Delta Ohm
The AZ7755 device has been tested twice both outdoors and indoors. (at home) An example is presented in Figure 9. Az7755 has the option to record the data in a PC every 2 seconds.
In this test, we write down the readout from the monitor at different times.
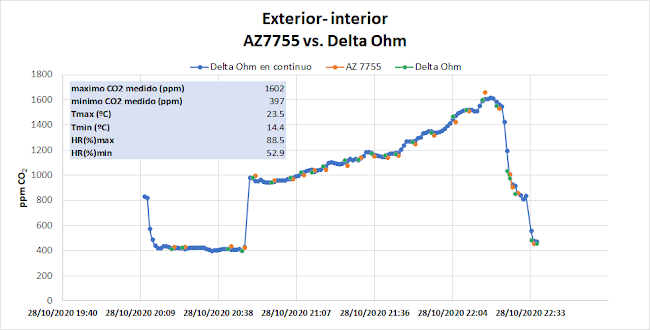
Figure 9. Comparison between AZ7755 and Delta Ohm detectors.
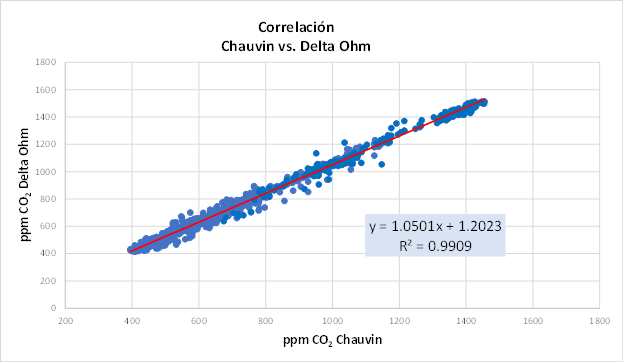
As it can be seen in Figure 10, there is a very good correlation (slope = 0.97). EIn both tests, the average deviation (% difference in CO2 measurements) is below 1%.
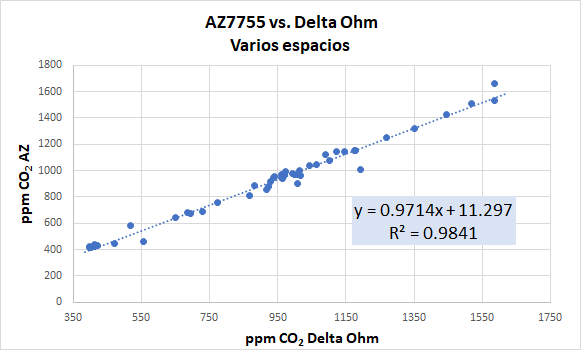
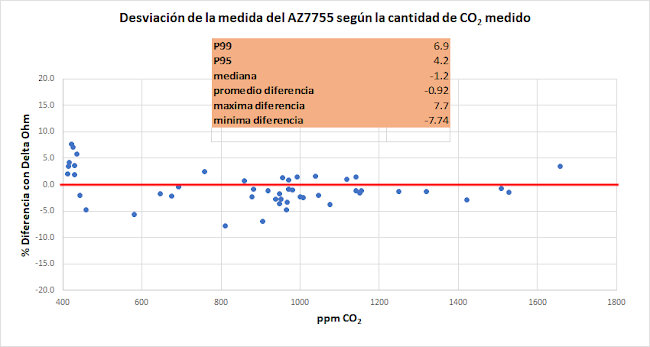
Figure 10. Correlation and % deviation of the CO2 measurement from AZ7755 device with respect to Delta Ohm.
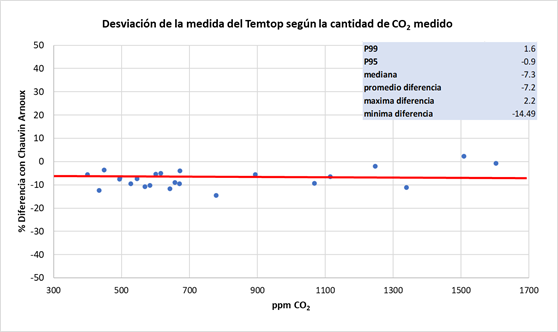
Comparison between references: Chauvin-Arnoux vs Delta Ohm
The comparison between the CO2 measurements from the two references has been carried out in three different sites: a nursery, a kindergarten classroom and a primary classroom in Ciudad Real. Examples are shown in the following figures.
The correlation found between the two reference CO2 meters is very good, although the Chauvin-Arnaux measures about 40 ppm less, on average.
As for the percentage deviation, it is 5% (in absolute value) on average.
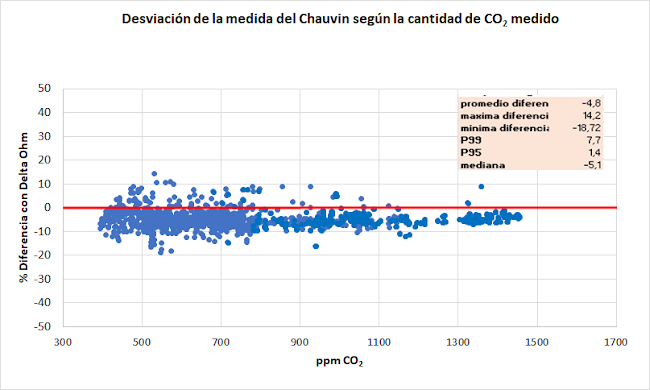
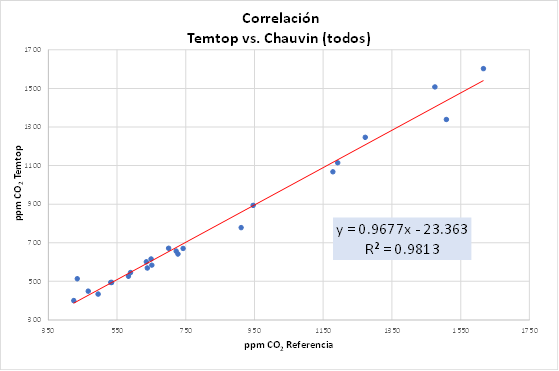
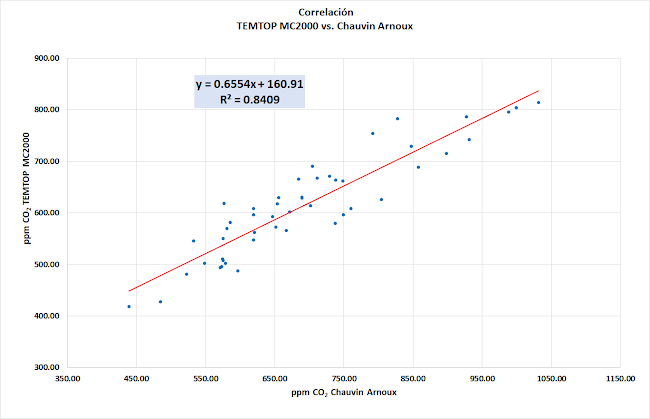
Temtop M2000C versus Chauvin-Arnoux
The comparative measurements were made in a toddlers, kids and high-school classroom of a school in Daimiel (Ciudad Real, Spain). Although the Temtop device has the option to download data, during the loan of this equipment, the owner did not provide us with the proper connections and the measurements were made in a timely manner. The measurements are very scarce. We will record more data to be able to do a better analysis.

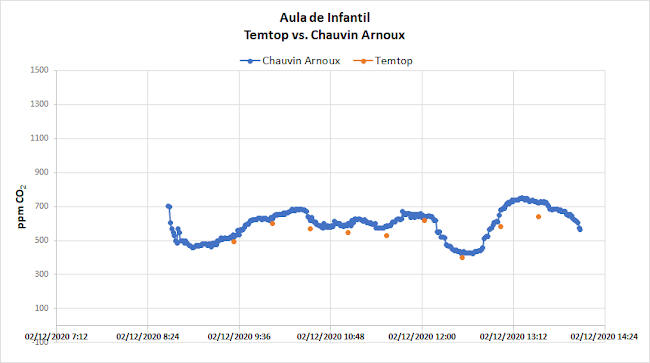
As can be seen in the previous plots, the trend in the CO2 measurement is similar in both devices, since the slope in the correlation graph is not far from unity. The observed deviation in the CO2 measurement from the Temtop meter with respect to the Chauvin-Arnaux is approximately 7% (in absolute value), as observed in the statistical data presented at the onset of the figure at the bottom.
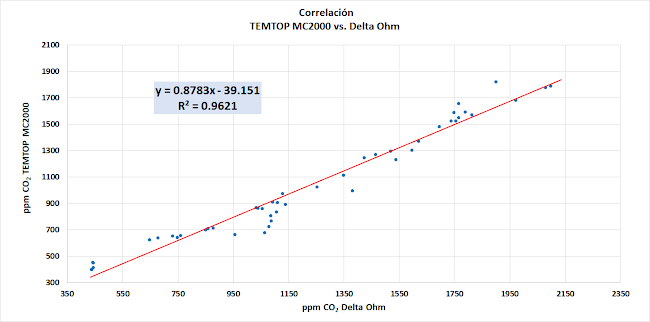
Temtop M2000 versus Chauvin-Arnoux & Delta Ohm
The intercomparison between the Temtop M2000 has been carried out with two reference CO2 meters. Examples of simultaneous measurements made with both meters are shown below. As can be seen, the measurements from Temtop M2000, in general, are below the reference ones, although they are occasionally close.
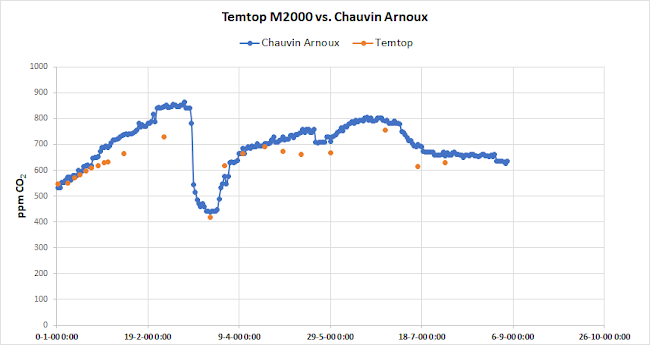
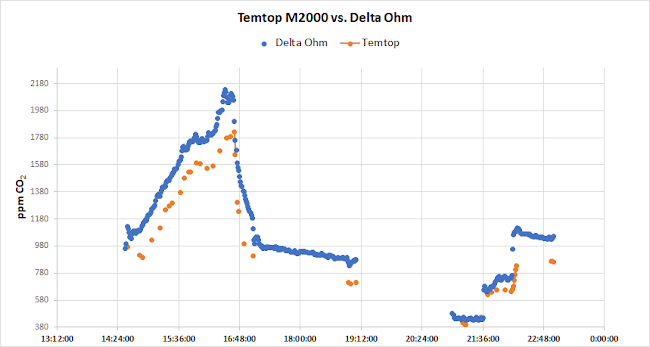
The average percentage deviations vary from 7.7% (in absolute value) to 15% (in absolute value) depending on the range of CO2 concentrations.
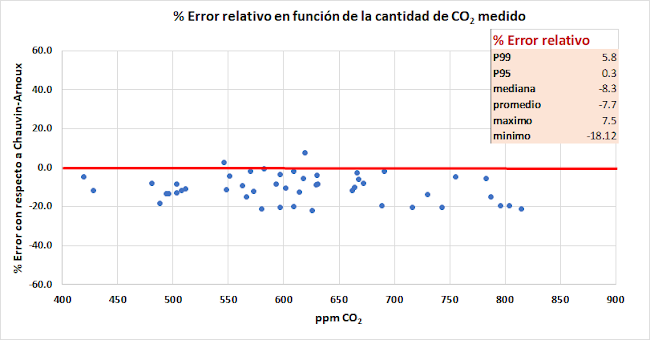
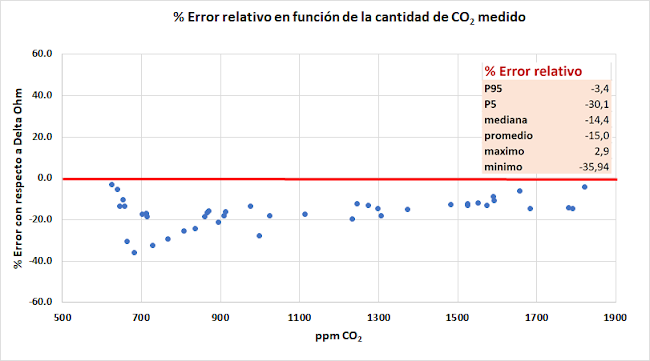
The observed correlation differs from one experiment to another performed in different days and after calibration of the CO2 meter. No reason was found for such a difference.
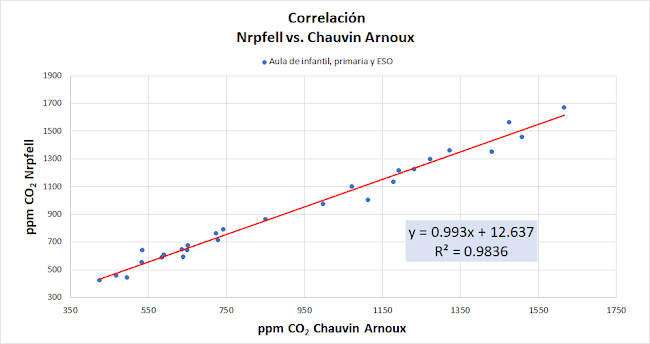
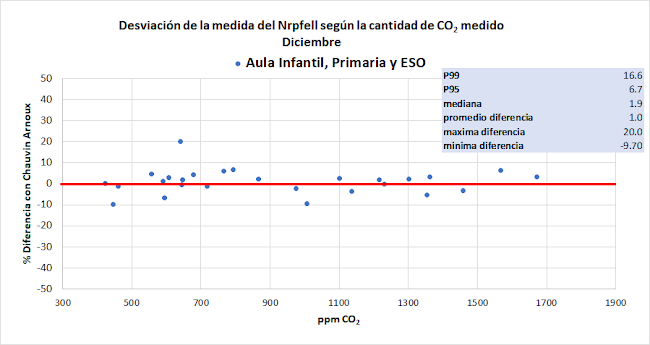
Nrpfell versus Chauvin-Arnoux
CO2 has been measured using the Nrpfell device in a primary-school and high-school classroom in Daimiel (Ciudad Real, Spain). Even though there are few single CO2 measurements in the three different classrooms, as observed in the figures below as examples, the combination of all data gives excellent results. This low-cost meter follows the same trend as the reference meter and with a very small deviation.
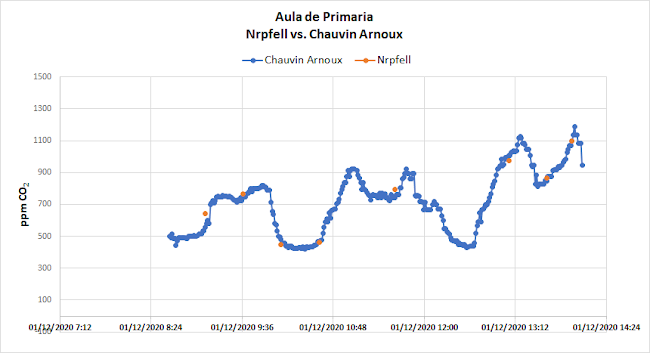
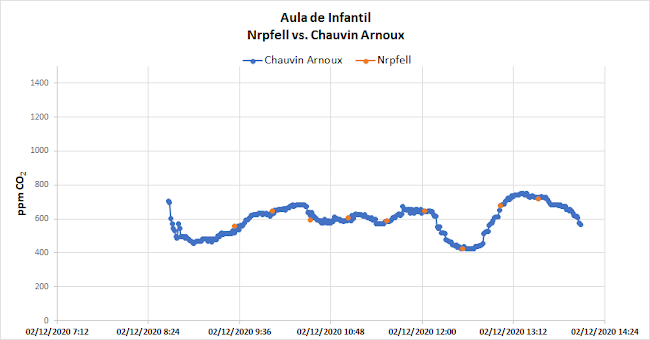
Combining the three sets of data, we observe a very good correlation with the Chauvin-Arnaux with average deviations within the 400-1700 ppm range of around 1% (in absolute value).
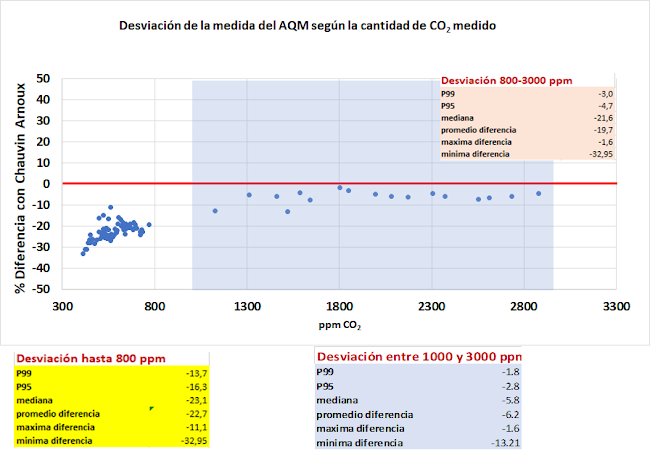
EGVOC-165W AQM versus Chauvin-Arnoux
In addition to CO2, temperature and relative humidity, this device also measures formaldehyde (HCHO), total volatile organic compounds (TVOC) and particles (PM1.0, PM2.5, and PM10). As seen in the following graphs, EGVOC-165W AQM greatly underestimates the CO2 concentration when levels are below 900 ppm. However, the measurement is more reliable above 900 ppm.
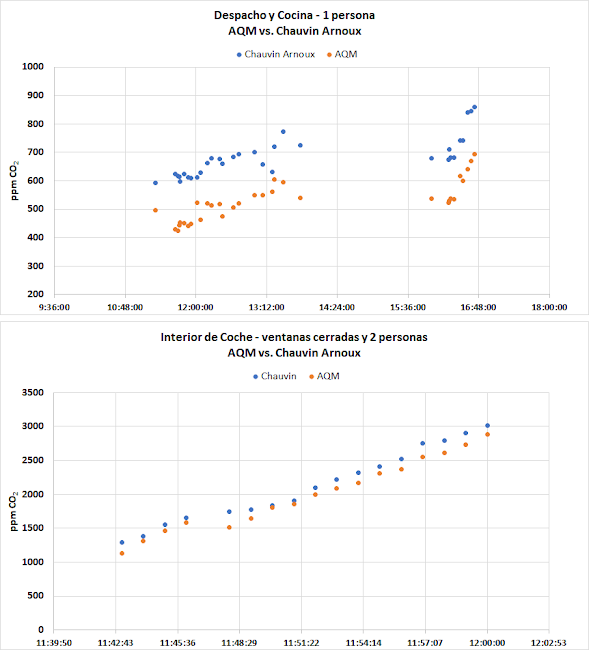
The underestimation in the CO2 level by EGVOC-165W AQM is clearly seen in the correlation plot (top plot) both below 1000 ppm and in the entire 700-3000 ppm range. As it can be seen, when data are plotted in the full range, the intercept (which gives us information on the amount of ppm that the AQM underestimates) is very high, -176 ppm. At CO2 concentrations below 1000 ppm (bottom plot), the correlation is not good (slope much lower than 1 and an appreciable intercept). This device presents differences in the CO2 measurements of 20-30% with respect to the reference meter (see deviation graph at the bottom).
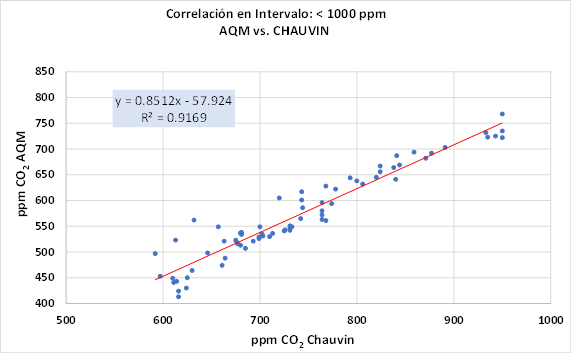
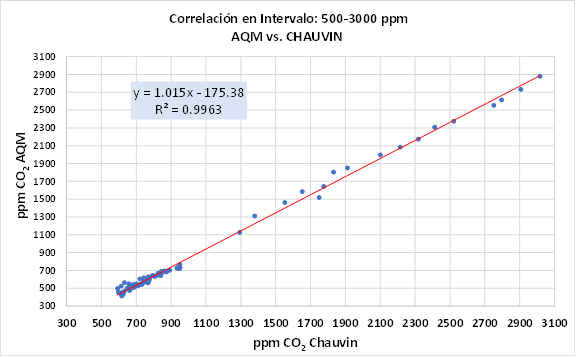
The observed differences (in %) in the CO2 measurement from EGVOC-165W AQM depends on the CO2 level, as we have discussed. Thus, up to 800 ppm of CO2, the% difference (in absolute value) is on average around 23%, while above 1000 ppm the difference drops to 6% (in value absolute).
EGVOC-165W AQM are multifunctional devices. They also measure HCHO, TVOC, PM1.0, PM2.5 and PM10. The CO2 sensor is NDIR. They require calibration (by exposure to fresh air - reading 400 ppm) a few minutes before measuring. No option to export data. It measures every 4-5 seconds, however the CO2 concentration is plotted every hour (if you move the cursor), which is not useful for a trend analysis. The graph can be visualized on the smartphone through the generic smartTUYA app. The CO2 measurement is underestimated by almost 200 ppm at levels less than 1000 ppm. Above 1000 ppm, it measures something better. Other drawbacks: fully charged battery lasts 2.5 hours.
This model is not recommended, since it underestimates the CO2 level by more than 170 ppm in the 400-900 ppm range.
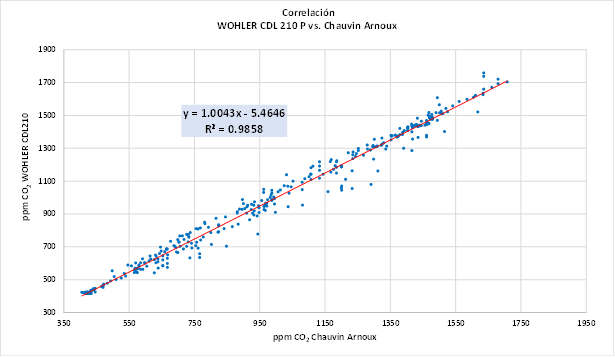
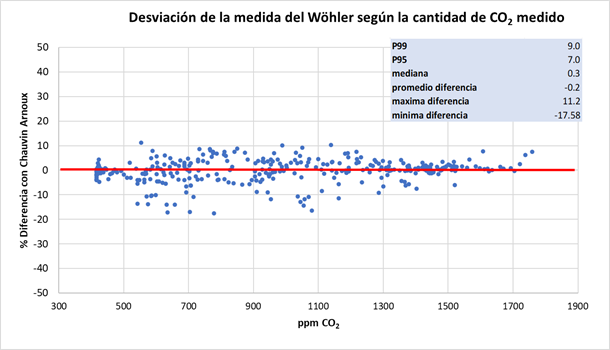
Wöhler versus Chauvin-Arnoux
Some examples of the temporal evolution of the CO2 concentration in several indoor environments. Single and continuous (1 min) measurements were performed with Wöhler.
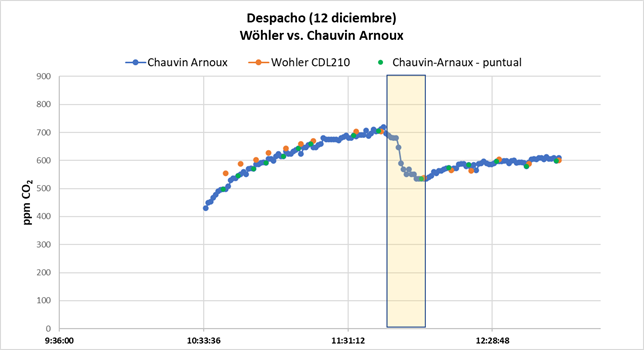
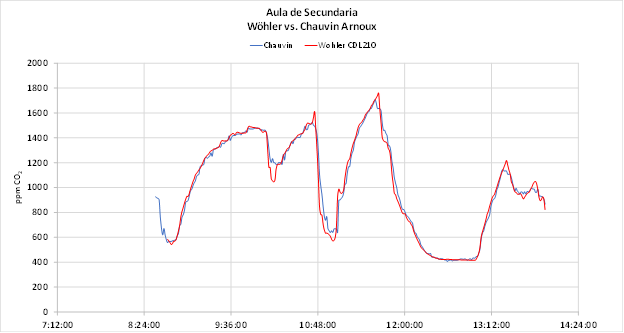
It was observed good correlation and very small % deviations on the order of 0.2% on average (in absolute value).
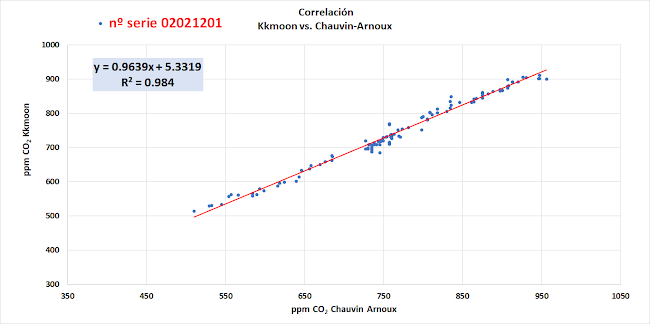
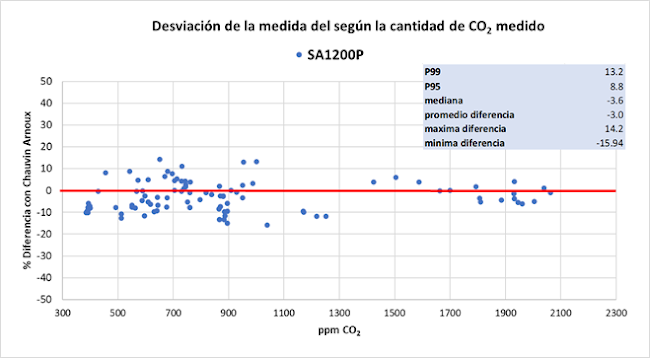
SA 1200P versus Chauvin-Arnoux
This device has no possibility to data export so punctual measurements of CO2 were registered manually. An examples is given below:
As it can be seen in the figure below, the correlation is quite good (r2 = 0.984).
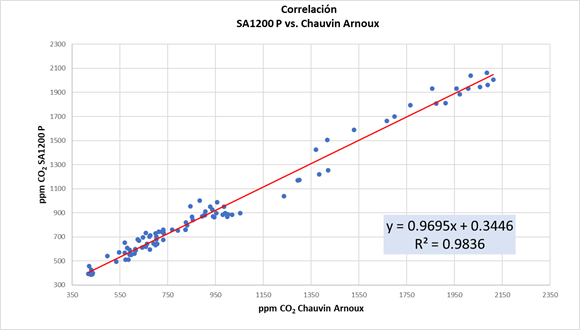
The average value of the percentage deviation is 3% (in absolute value) and 95% of the measurements are below 8.8%.
SignCO2 versus Chauvin-Arnoux
The CO2 concentration has been measured in various indoor environments (office, bedroom, car, ...). The SignCO2 meter measures every 11 min (minimum time, currently programmable). In the following figures, several examples of the temporal variation of CO2 concentration are shown.
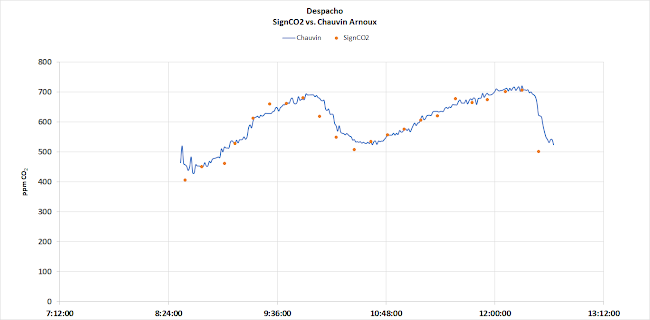
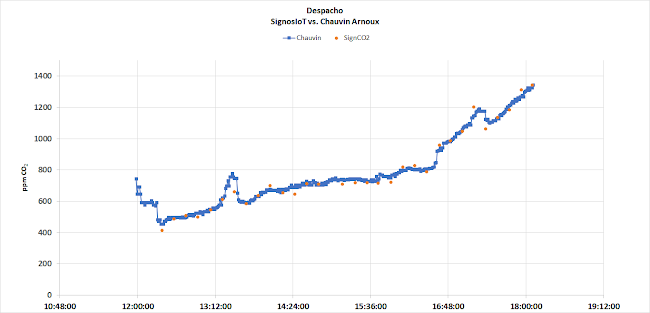
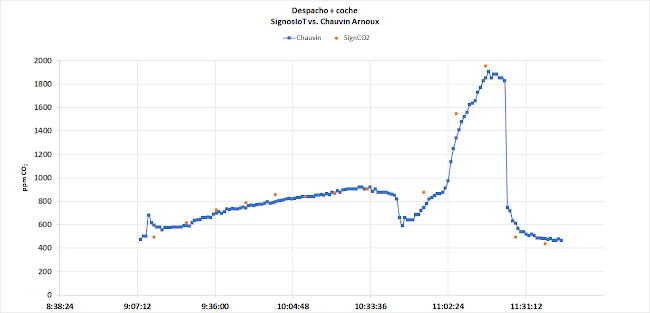
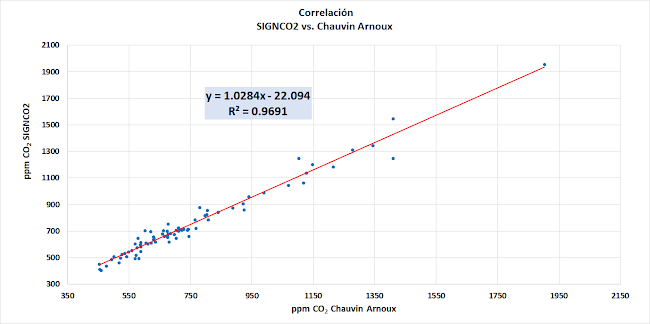
The CO2 measurements recorded from the SignCO2 meter are generally slightly lower than the reference meter. The measurements from SignCO2 satisfactorily correlate with those from the Chauvin-Arnaux meter. On average, the %deviation is 0.4% (in absolute value), although it ranges between -15% and 17.3%.
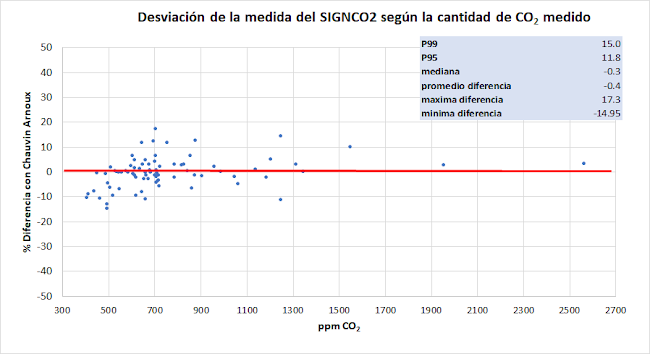
This SignCO2 meter does not have a display to monitor the CO2 level, while recording. The measurement frequency is programmable, but the minimum time is 11 minutes. It would be desirable if it could measure every 1 min and had a display. It does not need to be plugged in to measure or download the data.
CO2panel 𝜋 versus several references
Experiments presented in chronological order. The behavior of this CO2 meter is highly variable. Calibration is very important.
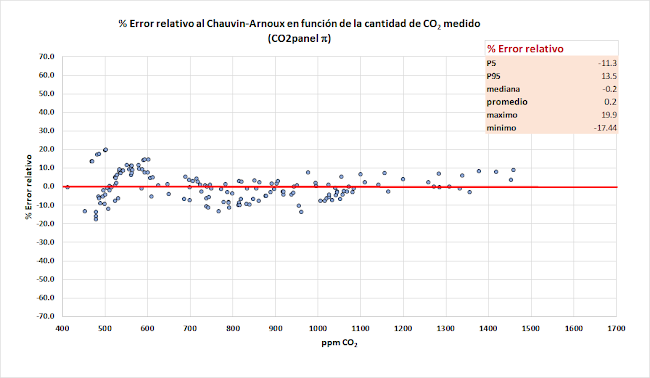
Reference: Chauvin-Arnoux
Between 700 and 1000 ppm, the measurements from the CO2 panel 𝜋 with respect to the reference meter are quite in agreement. Only the rare measurements between 1000 ppm and 1200 ppm are higher than the reference.


CO2 measurements were performed during 3 days. The correlation between both meters is quite good as can be seen in the previous figure. Likewise, the % deviation with respect to the Chauvin-Arnaux was 0.2%. Specifically, some values deviate 20% in absolute value, but 95% of the measurements are below 13.5%.
Reference: Average from several Aranet4
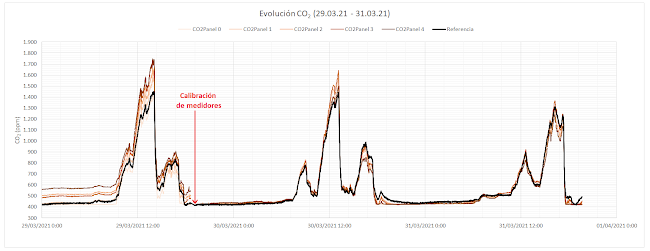
The measurements obtained with 5 CO2Panel 𝜋 devices and the "Reference" one have been continuously compared between March 3 and April 9 (37 days). Throughout this period, 2 manual calibrations have been carried out on March 9 and March 29.
The conclusions drawn from the testing of the 5 meters are summarized below.
1. Calibration:
After calibration, all CO2 measurements agree with the "Reference" values. After 2-3 days from the calibration, the CO2 concentrations are still set to "Reference". And from the 4th day a slight deviation appears, especially for higher CO2 values.
After these tests, we recommend a weekly calibration to obtain more precise results. Depending on each case, the weekly automatic calibration can be activated, or carried out manually at the appropriate times. These devices cannot be easily taken outside to carry out the calibration because they have to be continuously plugged in. At the time of calibration we must ensure that the indoor is very well ventilated (that we have the same CO2 as outside). If this step is not done properly, the equipment may tend to calibrate downward and give upward values.
2. CO2 levels:
Between 400 and 900 ppm, the tested meter provides very close values to the "Reference" ones. For higher CO2 levels (900-1,000 ppm), the results are quite scattered. In any case, they are useful equipment in the CO2 ranges of interest to ensure a good ventilation. For more accurate studies, they are not recommended.
An example of the correlation of the 5 CO2panel𝜋 meters is shown below in the figure. As can be seen, the correlation is very good.
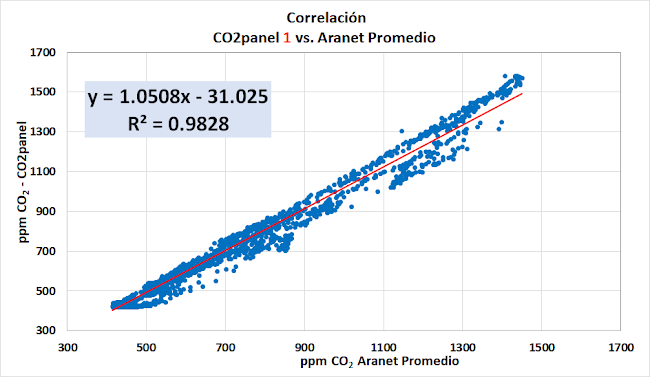
The average parameters from the linear regressions obtained for the 5 CO2panel𝜋 meters are given below before and after calibrating.
- Before calibration:
- After calibration on March 9:
- Two weeks ago from the calibration:
- After calibration on March 29:
As it can be seen in the tables, the slopes are progressively improving after calibration. The intercepts remain around zero, within the uncertainties, and r2 improves, but not substantially.
The following graphs show, as an example, the % deviation from the reference for the 5 CO2panel𝜋 meters before and after calibrating on March 29th.
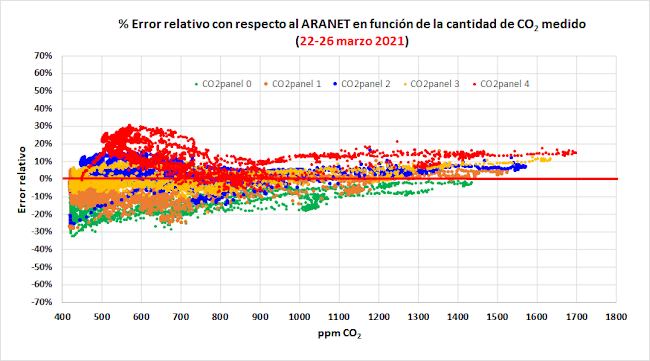
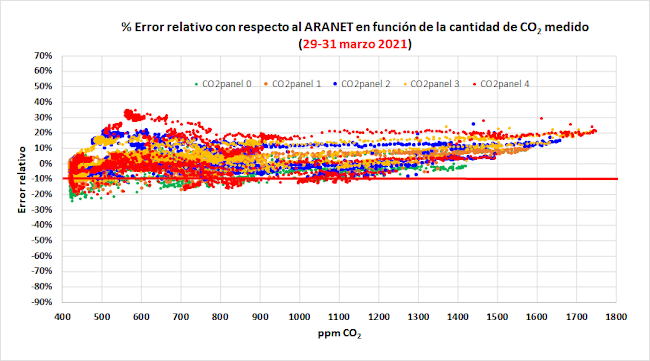
In April 2021, the 5 previous units (CO2Panel 0-4) plus another 3 units (CO2Panel 5, 6 and 7) were tested again.
Time evolution of CO2: Not all meters follow the same trend. Among the last 3 CO2 meters tested, there was one with greater deviations, as shown in the summary table below.
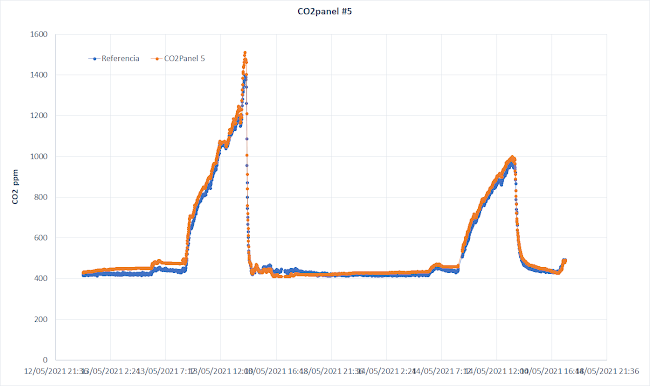
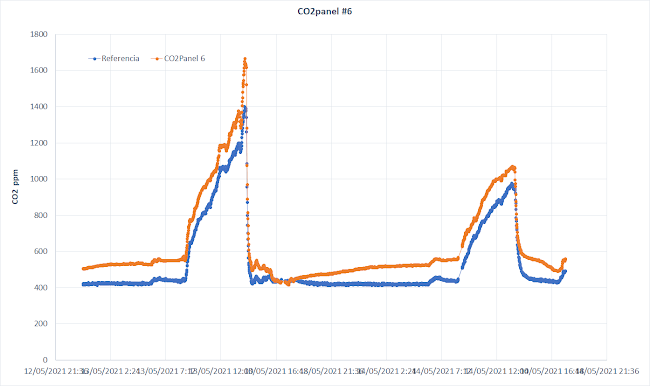
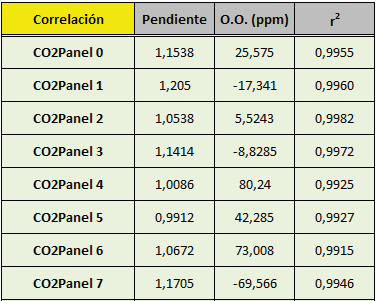
Correlation: Slopes close to unity with ordinate at the origin between -30.8 ppm and 44.8 ppm.
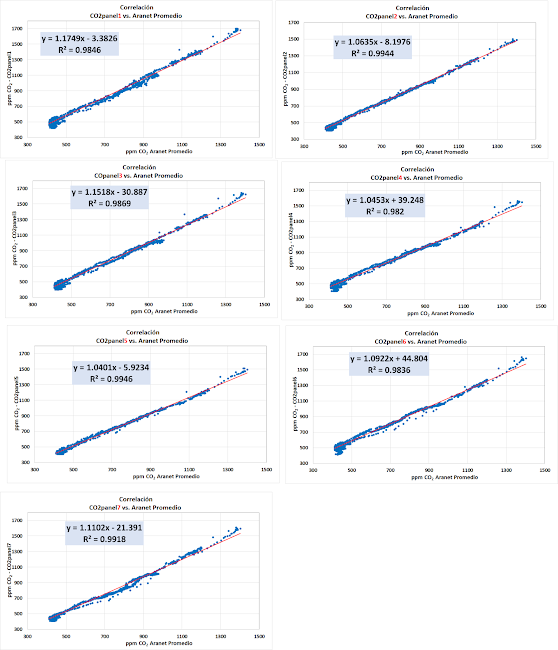
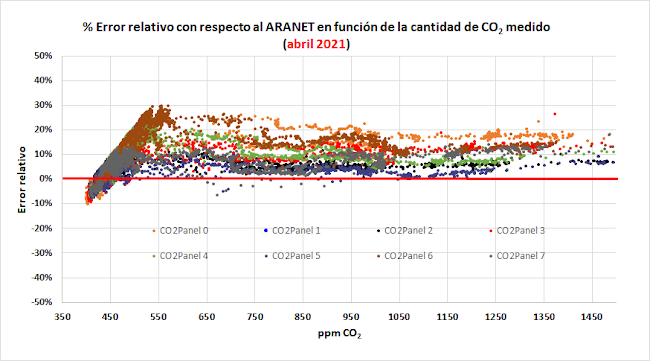
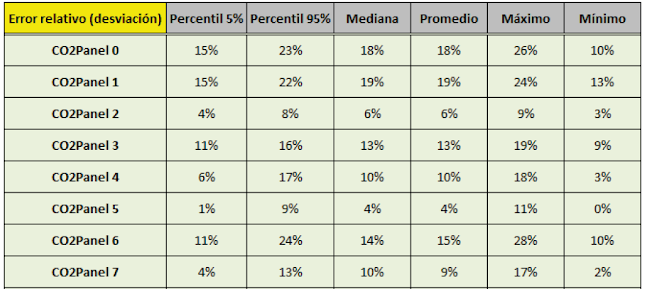
% Relative error: Average deviations between 4% and 19%. Maximum deviations of up to 28%.
SanisCO2 LITE versus Chauvin-Arnoux
The tests on SanisCO2 LITE meter have been carried out in various indoor spaces over the 400-1900 ppm range. As an example, two comparative tests are shown below. One performed between 600 and 900 ppm and the other one performed over the entire range mentioned above.
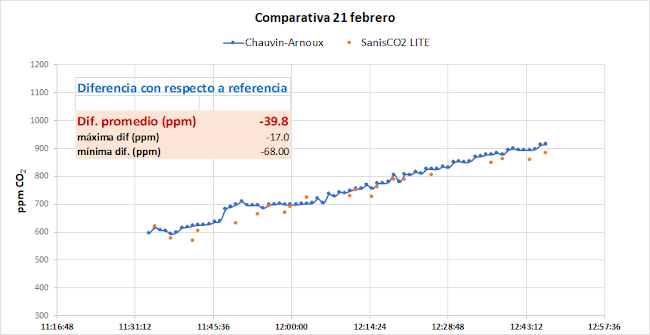
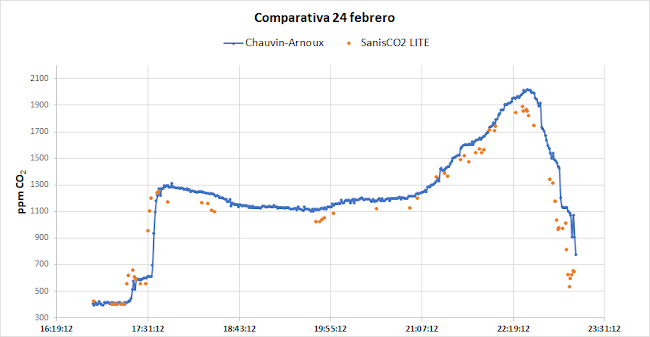
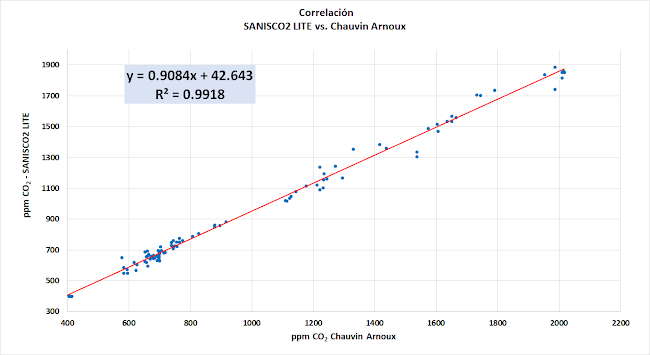
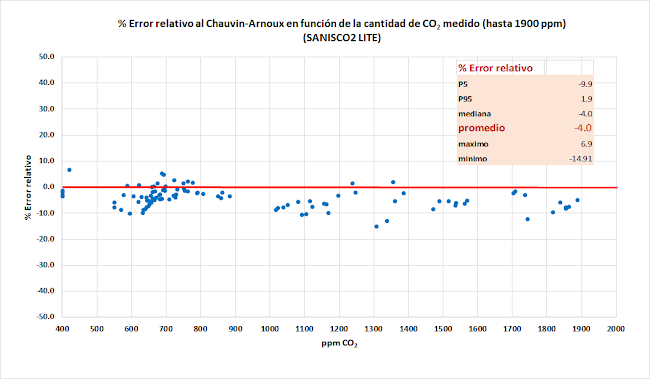
As can be seen, the CO2 measurements from the SanisCO2 LITE meter are slightly lower than the measurements from the reference CO2 meter. Although, as seen in the first graph, the average differences are about 40 ppm, at higher CO2 concentrations the differences are greater, but in percentage terms within the uncertainty of the equipment. In summary,
- The correlation obtained from all the tests carried out is quite good.
- The relative error in the CO2 measurement with respect to the reference meter is 4% (in absolute value) on average.
Inbiot MICA LITE versus several references
Chauvin-Arnoux
The CO2 measurements were continuously performed with the Inbiot MICA LITE for several days. An example of the temporal variation of the CO2 concentration relative to that of Chauvin-Arnoux is shown in the following figure. Measurements were done in the range of interest, that is, from outdoor CO2 levels to about 850 ppm - 150 ppm above the recommended CO2 level in an indoor space to reduce the risk of airborne diseases, such as COVID- 19. As can be seen, there is an excellent agreement between the MICA LITE measurements and the reference one, the correlation for this meter being quite good in the measured interval.
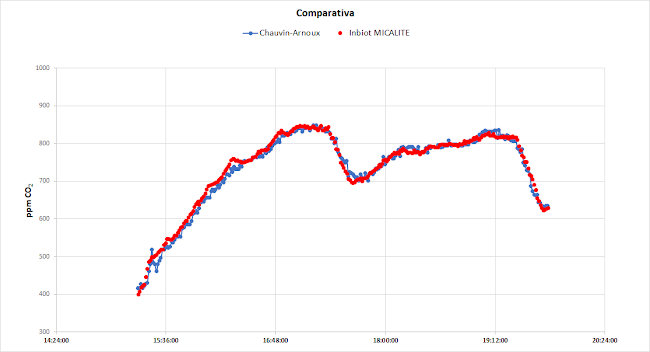
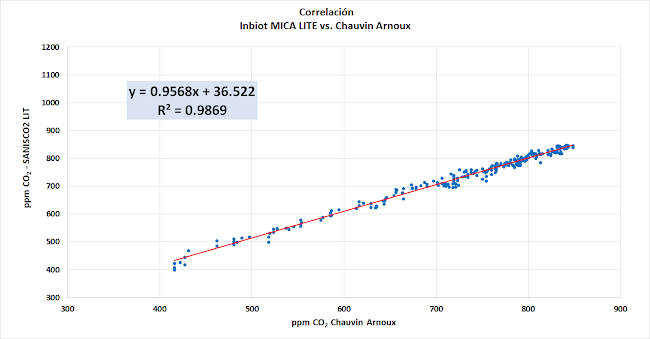
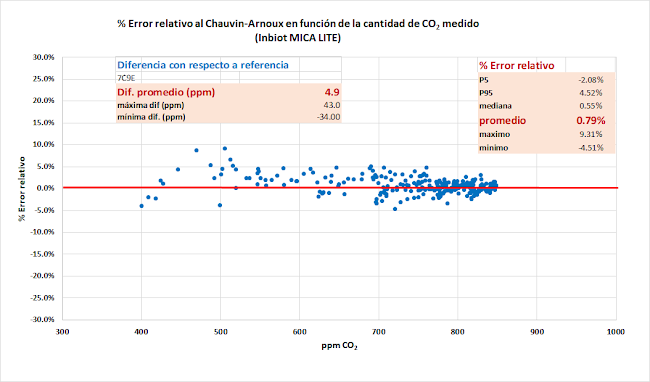
The small difference observed between both CO2 meters implies, on average, a relative with respect to Chauvin-Arnaux meter of 0.8%. The maximum and minimum deviations do not exceed 9.5% and -4.5%, respectively.
The average difference between both CO2 meters is 4.9 ppm, with a maximum value of 43 ppm and a minimum value of -34 ppm, but they are within the uncertainty of the sensor ± 30 ppm + 30% of the reading.
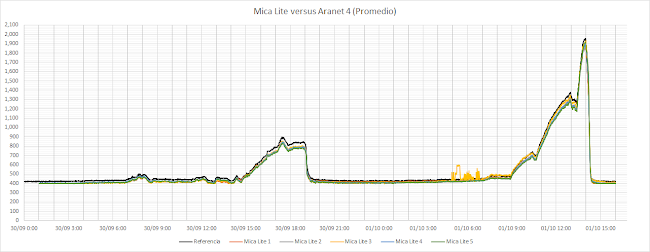
Averaged Aranet 4
This comparative campaign has been carried out in MESURA. Below the comparative graph of the 5 units tested of the MICA LITE meters is presented together with the reference one. As it can be seen, all CO2 meters respond to changes in CO2 in the same way. No big differences in the measurements of the MICA LITE were found.
Individually, the correlations for each MICA LITE meter are shown here.
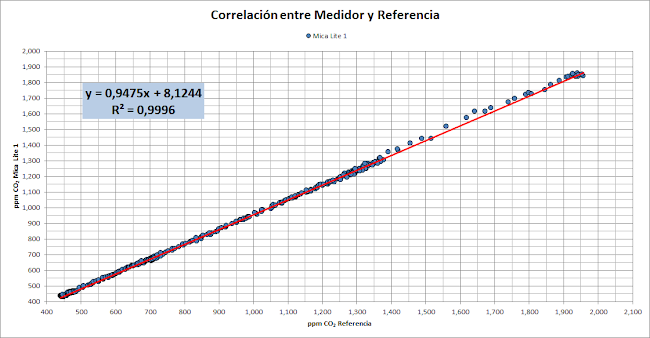
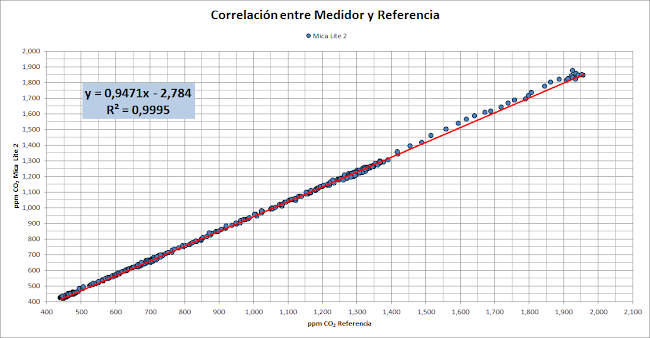
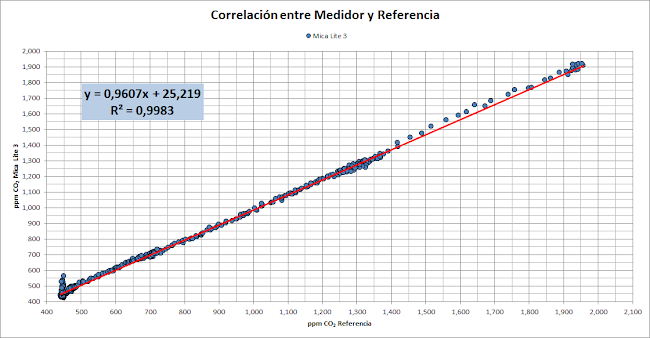

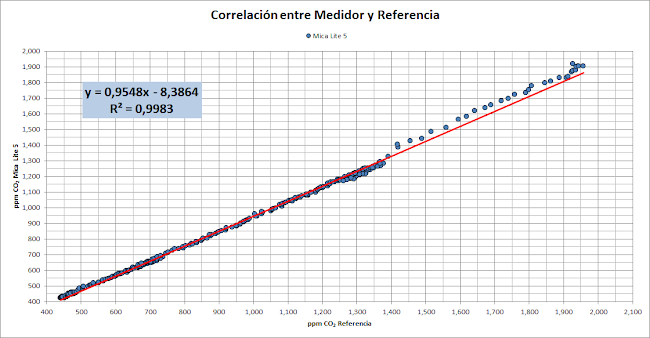
In summary, the correlation parameters obtained are the following ones:
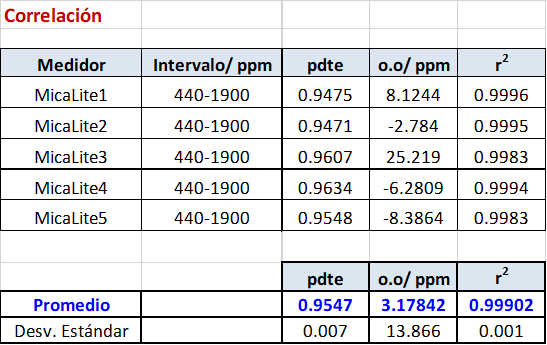
Regarding the relative error (in %) found in the measurement of the CO2 concentration with respect to the reference, it is observed that, in general, the measurements of the tested meters are always below the reference.
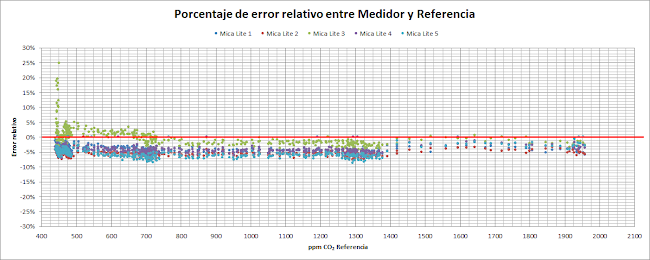
On average, it has been obtained that the measurements from MICA LITE devices are between 4% and 6% lower than the reference. In the case of the MICA LITE 3 meter, the average value of the relative error is 0% because there is a compensation of the measurements below 700 ppm, which are higher than the reference, with those made at higher concentrations, which are lower than the reference.

In summary these CO2 meters are very reliable. However, they cannot be considered low cost, since their price ranges between 300 and 400 euros.
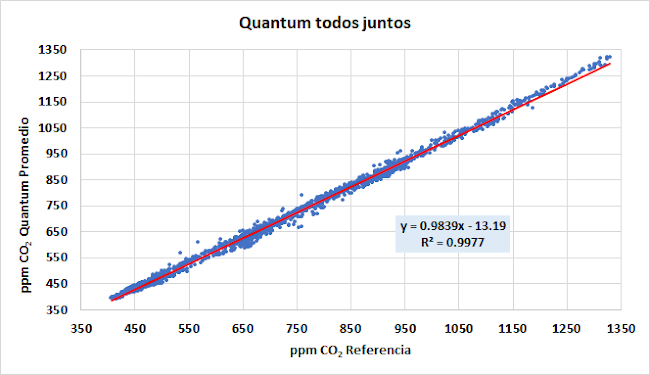
DIOXCARE versus Aranet 4 (average)
Five units of the Quantum Spain DIOXCARE CO2-meter have been tested using as a reference the average CO2 measurement from 10 different Aranet 4 meters. CO2 was continuously measured from March 9 (calibration day) to March 31. The correlation results presented below are an example of the average CO2 recorded simultaneously by the 5 DIOXCARE CO2-meters from 10 to 15 March compared to the average of the 10 Aranet 4. As it can be seen, the correlation is quite good and presents a very small scatter.
We observe:
- Before calibration, the reproducibility is lower (7% average of difference in CO2 measurement) than after calibration (1.4 %).
- Every 7 days it self-calibrates (and a jump is observed) and the data correlates better with the reference meter. Regarding correlation, the intercept of the plots shown earlier varies.
- The correlation parameters after 3 days from calibration (March 9) are:
- Slope: 0.9839 intercept: -13.19 r2: 0.9977.
- The deviation or accuracy in the measurement with respect to the reference CO2 meter is -4%.
- The correlation in 4-7 days after calibration is still very good:
- Slope: 0.99 intercept: 11.5 r2 0.996
- The deviation or accuracy in the measurement with respect to the reference CO2 meter is -7 %.
- The correlation just after the jump from day 7 to day 9 after calibration is:
- Slope: 0.976 intercept:-27.7 r2 = 0.993
- The deviation or accuracy in the measurement with respect to the reference CO2 meter is 0.7 %.
- The jump produced 14 days after calibration makes the meters adjust among them. The difference in the CO2 measurement is smaller than that observed in the first jump. The correlation is:
- Slope: 0.996 intercept: 3.78 r2: 0.99
- The deviation from the reference is 0.3% and the precision between them is 1.9%. So, it is not strictly necessary to calibrate the DIOXCARE meter every 7 days. A monthly calibration is recommended.
- After calibrating on March 29, the correlation is:
- Slope: 1.03 intercept: -15.78 r2: 0.997
- The deviation or accuracy in the measurement with respect to the reference CO2 meter is -0.12% (ranging from -17.7 to 18.8). La precisión entre ellos es del 1.1%.
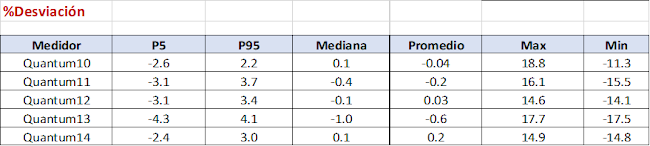
As an example, the following figure shows the % deviation in the CO2 measurements with respect to the reference obtained in the tests from March 29 to 31 for all DIOXCARE meters:
The statistical results for the % deviation of each meter is:
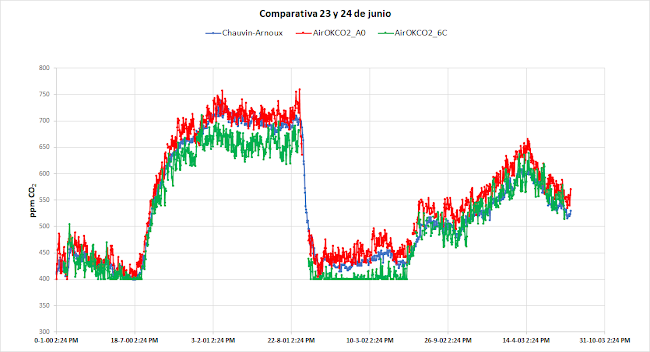
Airok CO2 versus Chauvin-Arnoux
Two CO2 meters have been compared during several days. These measurements, as can be seen in the figure, were carried out continuously every min. One of the meters measured systematically below the reference, but the measurements are within the uncertainty limits of the sensor: ± 30 ppm (+ 3% of reading). The observed difference between the measured CO2 concentration and that from the reference is, on average , -16.6 ppm (AirOKCO2_6C) and 19.6 ppm (AirOKCO2_A0) for this example.
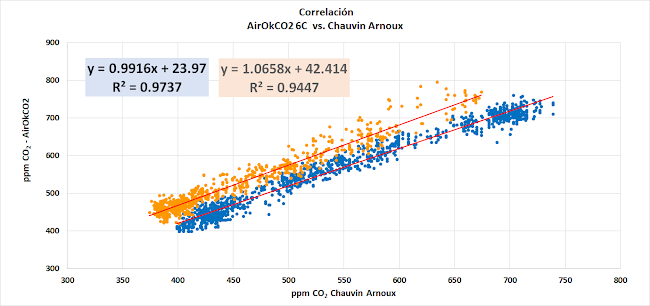
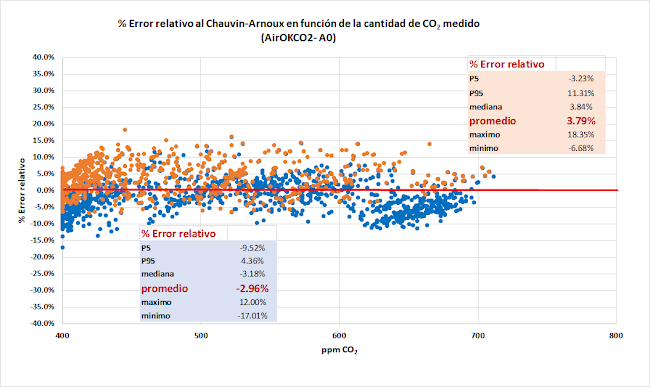
As an example, the correlation plot and the percentage deviation are shown for one of the meters on two different days. As can be seen, the correlation is very good, although an increase in the intercept of these plots of about 20 ppm was observed after one week. A weekly calibration is recommended. On average, the% relative error with respect to the Chauvin-Arnoux is 3-4% in absolute value.
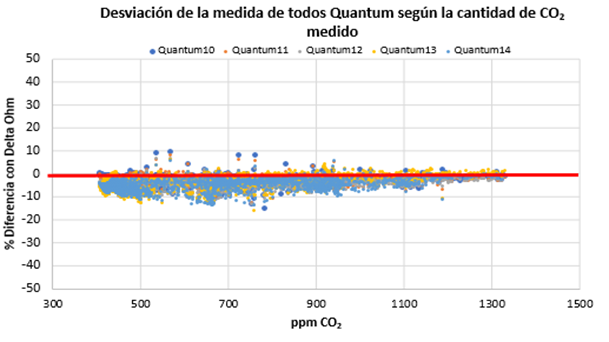
DM versus Aranet 4 (average)
This section shows the tests performed for the DM meters (DM72C, DM1306 and DM1307 - 5 units in total). The figure shows, as an example, the time evolution of the CO2 measurement for the DM 72C meter. As can be seen, at concentrations between 400 ppm and 1000 ppm both measurements agree quite well. However, at higher concentrations the difference between measurements starts to deviate. This is clearly reflected in the graph of % relative error, where there is no increase in the absolute value, but rather it varies towards more positive values of %relative error.

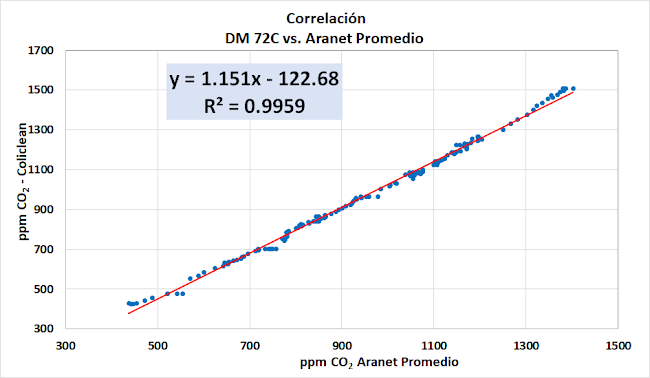
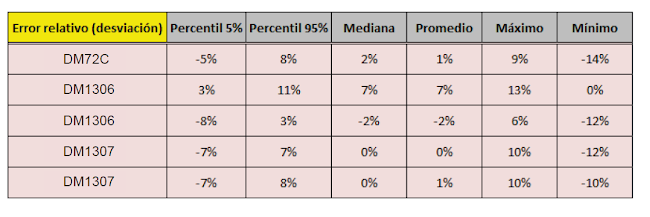
The correlation parameters are summarized in the following table for the meters tested:
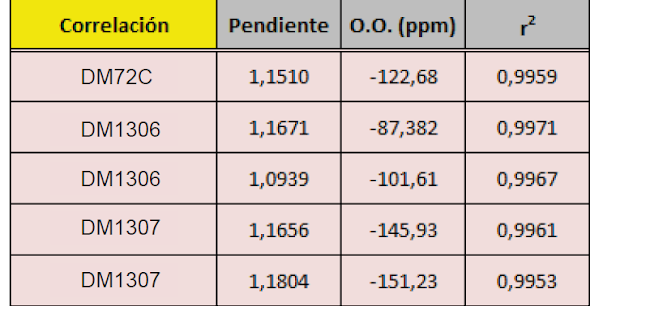
The same trend has been observed in %relative error for the DM 1306 and 1307 meters. The following graph represents the% relative error with respect to the Aranet4 (average) for all DM meters tested.

In summary:
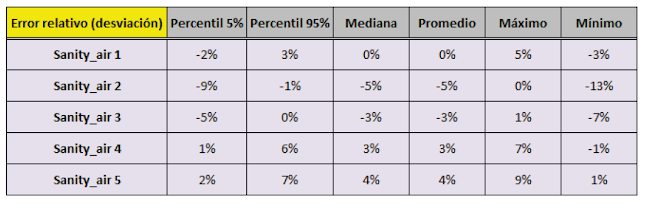
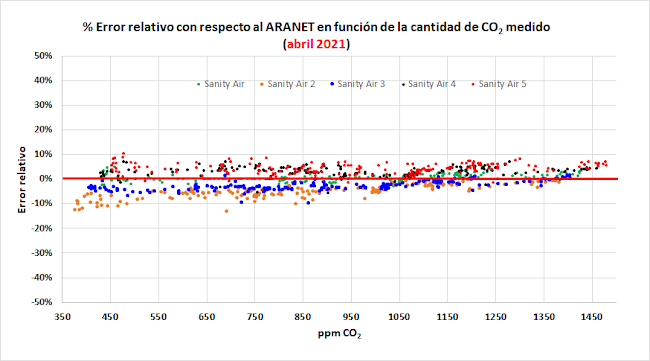
Sanity Air versus Aranet 4 (average)
Five units of the Sanity Air CO2 meter (Air Experience model) have been compared in this study. They work correctly. As shown in the examples given in the following figures, the response of the Sanity Air meter to CO2 changes is very similar to that of the reference CO2 meter.
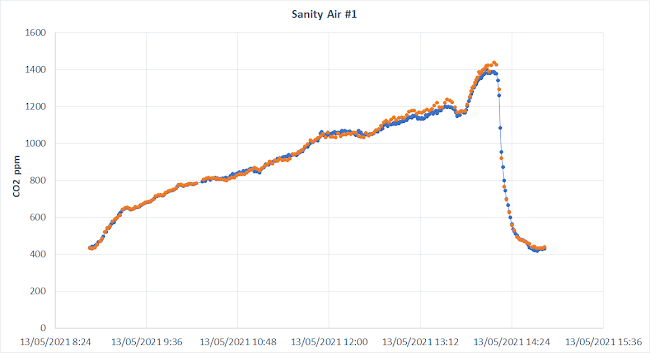
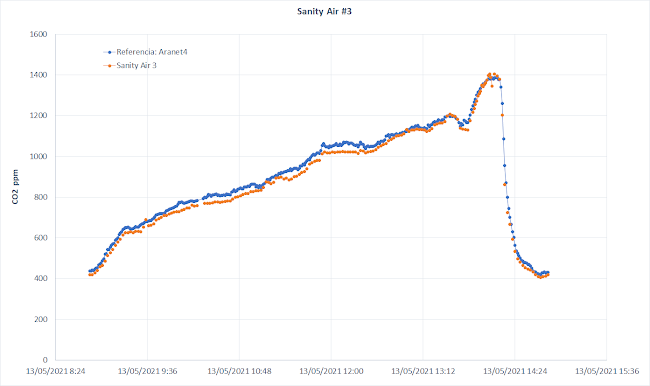
Very good correlation, with observed off-sets between -5 ppm and +60 ppm. The off-set could be corrected if this device had the manual calibration option.
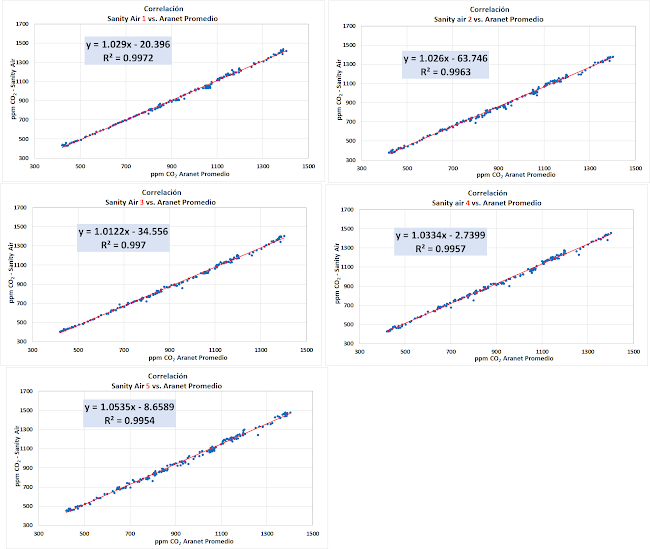
In general, the deviation in the measured CO2 level with respect to the reference (% relative error) lies around ±10%. On average, %deviation is between -5 and 4%.
CO2 panel MATRIX versus Aranet 4 (average)
In MESURA a CO2Panel MATRIX meter has been tested.
Time evolution of CO2: the response to changes in CO2 follow the same trend for the CO2Panel MATRIX and the reference meter.
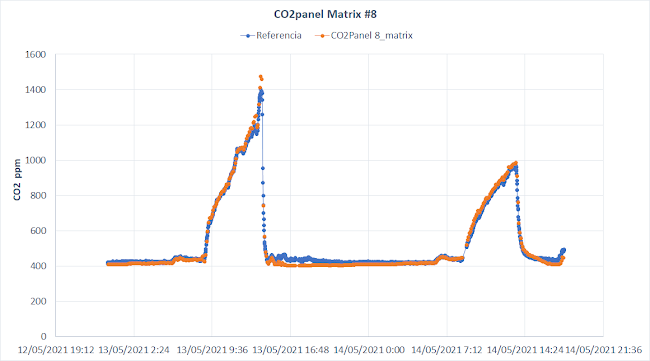
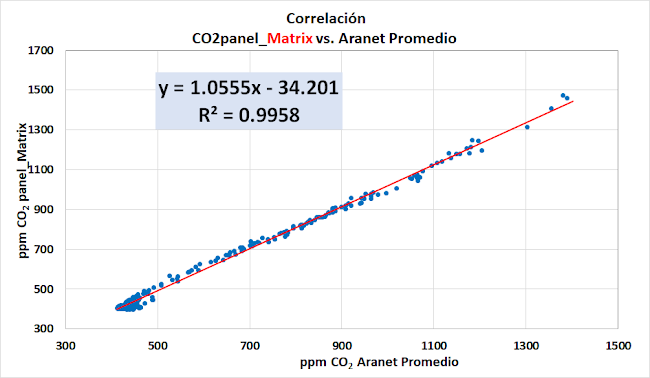
Correlation: Very good correlation with a slope of 1.055 and an intercept within the uncertainty of the sensor. R2=0.9958
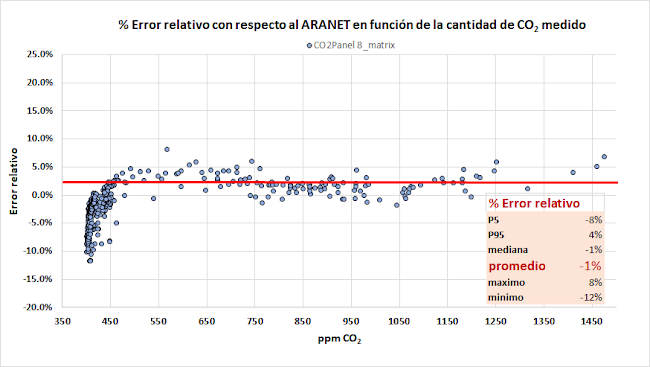
% Relative error: On average this device deviates 1% (in absolute value) with respect to the Aranet 4 measurement.
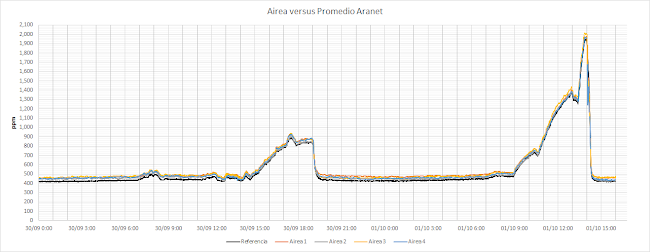
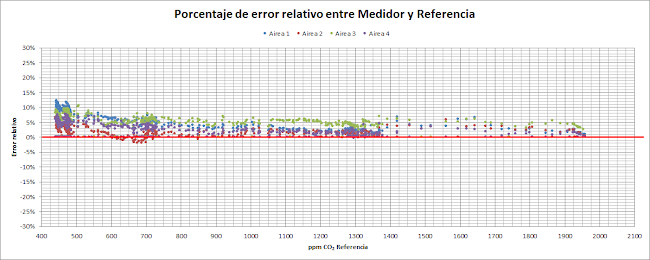
AIREA versus Aranet 4 (average)
These CO2 meters work very well. Continuous measurements have been made in MESURA for several days between 440 and 1900 ppm. The following graph shows the temporal evolution of the CO2 concentration recorded with the tested 4 devices. It is observed that there is a very good agreement with the reference CO2 meter.
For the AIREA devices, an excellent correlation with the reference meter was observed .
The following table summarizes the correlation parameters for the 4 devices tested in MESURA and the average value of the slope, intercept and r2.
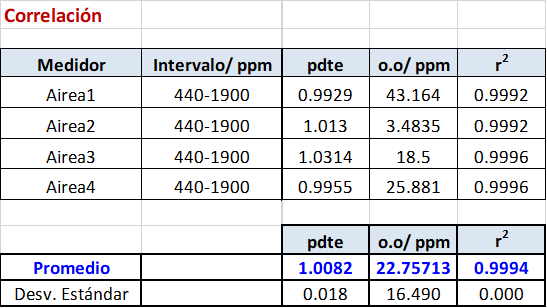
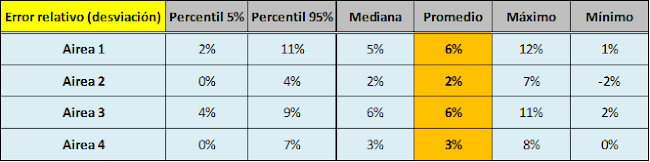
Regarding the percentage deviation of the AIREA measurements with respect to the average of the ARANETs, the following graph shows that all of them have a positive deviation, that is, they measure above the reference, but less than 10%.
The following table summarizes the statistical parameters (5%, 95% percentile, median, max and min values) and the averaged relative error, which is less than 6% in all cases.
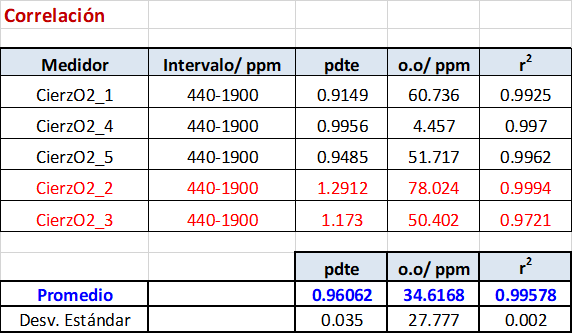
CierzO2 versus Aranet 4 (average)
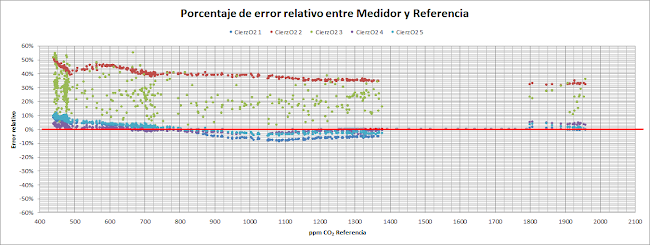
Several units of the CierzO2 CO2 meters have been tested. As it can be seen in the graph below, the temporal evolution of all of them follow the same trend as the reference meter. However, two of them (CierzO2_2 and CierzO2_3) present deviations indicating that the sensor failed and the measurements are very noisy with higher values than the rest.
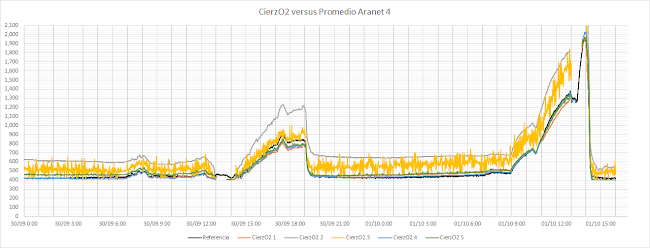
The correlation found between 440 and 1900 ppm is quite good (see below), except for the CierzO2_3 meter, previously mentioned, where the dispersion is much greater than the rest. As a consequence the results obtained from CierzO2_3 have not been included in the analysis of the correlation parameters.
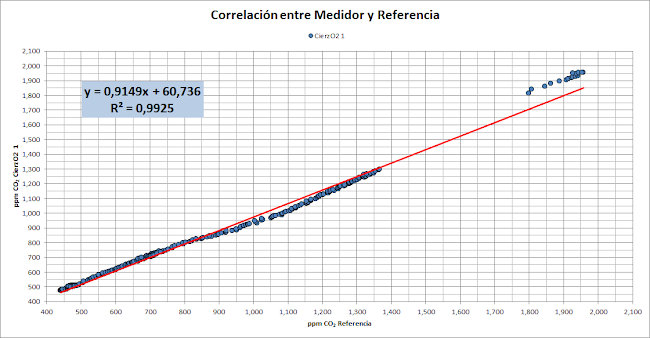
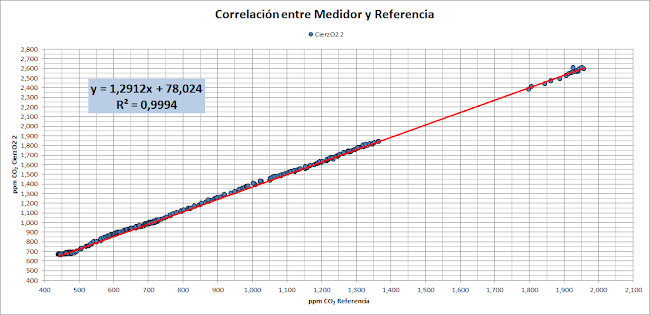
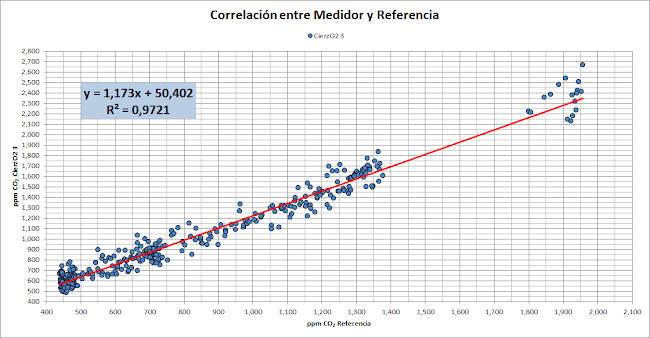
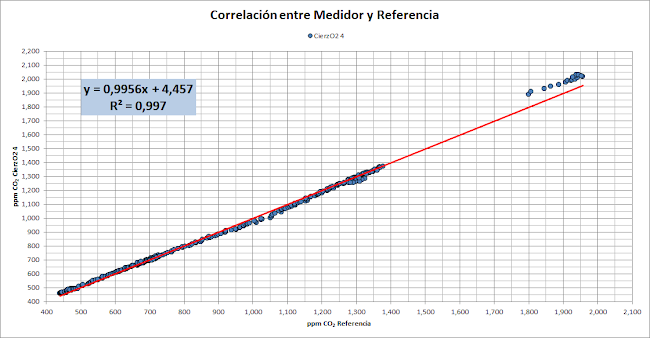

The values of the correlation parameters and their averages are summarized in the following table. The CO2 meters in red were not used to obtain the averages.
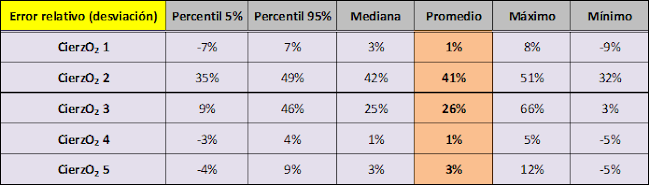
Regarding the relative error (in %) in each measurement with respect to the reference meter, it is clearly seen that the "noise" generated by the sensor of the CierzO2_2 and 3 meter makes the deviation parameters higher than the rest.
***************
5. SUMMARY OF STATISTICS AND CORRELATIONS
The following table summarizes some statistical parameters for the CO2 meter tested.
Tested Units | Tested Meter | % Deviation | Correlation | ||||||
REFERENCE: DELTA-OHM | |||||||||
| P95 | Median | Min. | Máx | Avg. | slope | intercep/ ppm | r2 | |
16 | Kkmoon o sim. | -3.7 | -11.3 | -1.9 | 0.0 | -10.1 | 0.88 | 8.9 | 0.962 |
21 | Aranet4 | 8.3 | 1.6 | -15.4 | 17.5 | 1.5 | 1.000 | 7.3 | 0.978 |
1 | Soulong o sim. | 2.4 | -5.3 | -14.6 | 4.4 | -5.0 | 0.905 | 29.3 | 0.988 |
1 | AZ775 | 4.2 | -1.2 | -7.7 | 7.7 | -0.9 | 0.971 | 11.3 | 0.984 |
1 | Chauvin-Arn. | 1.4 | -5.1 | -18.7 | 14.2 | -4.8 | 1.05 | 1.2 | 0.991 |
1 | Temtop M2000 | -3.4 | -14.4 | -35.9 | 2.9 | -15.0 | 0,878 | -39,1 | 0.96 |
REFERENCE: CHAUVIN-ARNOUX | |||||||||
1 | Temtop M2000C | -0.9 | -7.3 | -14.5 | 2.2 | -7.2 | 0.967 | -23.3 | 0.985 |
1 | Temtop M2000 | 0.3 | -8.3 | -18.1 | 7.7 | -7.7 | 0.655 | 161.0 | 0.841 |
1 | Nrpfell | 6.7 | 1.9 | -9.7 | 20 | 1.0 | 0.993 | 12.6 | 0.984 |
2 | EGVOC-165W-AQM | -4.7 | -21.6 | -33.0 | -1.6 | -23.3 | 1.015 | - 175.4 | 0.996 |
2 | Wöhler CDL 210P | 7.0 | 0.3 | -17.6 | 11.2 | -0.2 | 1.004 | -5.5 | 0.986 |
1 | SA 1200P | 8.8 | -3.6 | -15.9 | 14.2 | -3.0 | 0.969 | 0.34 | 0.984 |
1 | SignCO2 | 11.8 | -0.3 | -15.0 | 17.0 | -0.4 | 1.028 | -22.09 | 0.969 |
Continued...
Tested Units | Tested Meter | % Desviation | Correlation | ||||||
REFERENCE: DELTA-OHM | |||||||||
| P95 | Median | Min. | Máx | Avg. | slope | intercept/ ppm | r2 | |
REFERENCE: CHAUVIN-ARNOUX | |||||||||
1 | CO2 Panel Pi | 13.5 | -0.2 | -17.4 | 19.9 | 0.2 | 0.934 | 48.4 | 0.944 |
1 | SanisCO2 LITE | -9.9 | -4.0 | -14.9 | 6.9 | -4.0 | 0.908 | 42.6 | 0.992 |
2 | MICA LITE | 4.5 | 0.55 | -4.5 | 9.3 | 0.8 | 0.957 | 36.5 | 0.9869 |
2 | Airok CO2 | 9.4 | 3-6 | -7.7 | 15.4 | 3.8 | 0.9916 | 23.9 | 0.9737 |
REFERENCE: ARANET4 | |||||||||
5 | CO2 Panel Pi | See text | |||||||
5 | DIOXCARE | 3.4 | -0.17 | -17.5 | 18.8 | -0.12 | 1.03 | -15.8 | 0.9967 |
5 | DM 72C; 1306; 1307 | See text | |||||||
5 | Sanity Air (Air Experience) | See text | |||||||
4 | Airea | See text | |||||||
4 | CierzO2 | See text | |||||||
Acknowledgments: To people and companies that have sent us their CO2 meter so that we can compare it with ours as reference. To Paula Lucini, undergraduate student from UCLM, who helped us with some measurements.
ANNEX
REPORT on the evaluation of CO2 sensors at EUPHORE
1. Methodology
This report shows the results of the measurements carried out under controlled conditions for testing CO2 sensors against a reference instrument, Model LI-850 of LICOR Inc, performed at the EUPHORE chambers (http://www.ceam.es/WWWEUPHORE/home.htm) of the CEAM Foundation (www.ceam.es), in Valencia.
The different sensors were installed on two tables inside the chamber and CO2 from a calibration bottle was introduced to expose them to concentrations within the range between 400 and 3500 ppm.
This report shows sensor calibration data for different CO2 concentration levels. The analysis of the data has followed the same approach as that used in the Guide on CO2 meters available in Spain (https://bit.ly/monitorsCO2). The statistical parameters used here are those already defined in section 4.1 of this guide. More details can be found in the document (Results-EUPHORE.docx), while a deeper study, including results of their dependence on different relative humidity (HR) values and performance in the presence of other contaminants are detailed in a Technical Note that is under preparation.
Table 1 details the list of sensors evaluated and some of their characteristics. Since information about the sensor model used by some of the manufacturers is not available, the results are displayed grouped according to the brand of the meters.
Table 1. Types of sensor
Company /Particular | N. Sensors (Identifier) | Website | Brand (Sensor models) | Battery | Approx. Price (€) | Data access | Other parameters | Background calibration |
Neuer Weg | 2 (NEU_INDOOR, NEU_OURDOOR) | https://www.neuerweg-group.com/ | NW Virus Risk Alert NW Outdoor AQ monitor | X | - | + PC | PM, T, HR | + |
Sequopro | 2 (SEQ_215, SEQ_217) | ? | + | - | + PC | PM, T, HR | + | |
Winix | 1 (KKMOON_W) | Dioxcare (Cubic CM1106) | + | 95 | + PC, PDF format | T, HR | + | |
Redexia | 1 (REDEX) | www.redexia. com | SenseAir LP8 | + | 200 | + PC | - | X |
CO2Panel | 3 (CO2PAN_DA1… CO2PAN_DA3) | https://co2panel.shop/ | CO2Panel Pi (MHZ19B) | X | 129 | + PC | - | + |
| 1 (ANAIRE_A) | anaire.org | Anaire (SCD30 Sensirion) | X | The user can buy the parts (~65€) and build the meter with instructions | + PC | T, RH | + |
Anaire | 1 (ANAIRE_B) | Anaire (SCD30 Sensirion. Calib. Forzada) | ||||||
| 1 (ANAIRE_D) | Anaire (MHZ14A) | ||||||
| 1 (ANAIRE_E) | Anaire (MZH19C) | ||||||
Mesura | 9 (ARANET_0 .. ARANET_8) | https://www.aranet4.es/ | Aranet (Sensirion Sunrise) | + | 200 | + Smart Phone | T, RH | + |
10 (KKMOON_0 .. KKMOON_9) | Kkmoon (SensAir S8) | + | 95 | + PC, formato PDF | T, RH | + | ||
5 (CO2PAN_0.. CO2PAN_4) | https://co2panel.shop/ | CO2Panel Pi (MHZ19A) | X |
| + PC | - | + | |
F. CEAM | 1 (FC_1) | (EE893) | X | - | + PC | T, RH | X |
2. Results and discussion
This section shows CO2 measurements by different sensors tested and compares them to the reference meter, discussing the results. When assessing the results, it should be noted that, depending on the model, the error of the sensors according to the manufacturer is ±30-50 ppm plus 3-5% of the reading. This implies that, for instance:
- at 500 ppm of CO2, such error is 45 – 75 ppm, i.e., an error of 9% - 15%,
- at 700 ppm of CO2, such error is 50 – 85 ppm, i.e., an error of 7% - 12%.
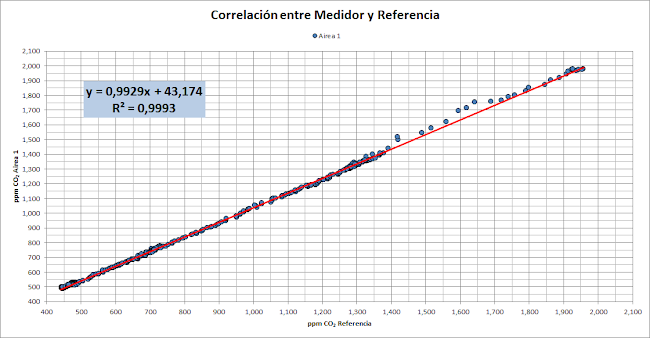
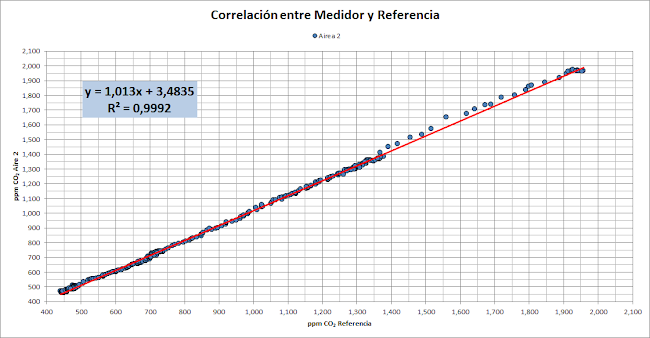
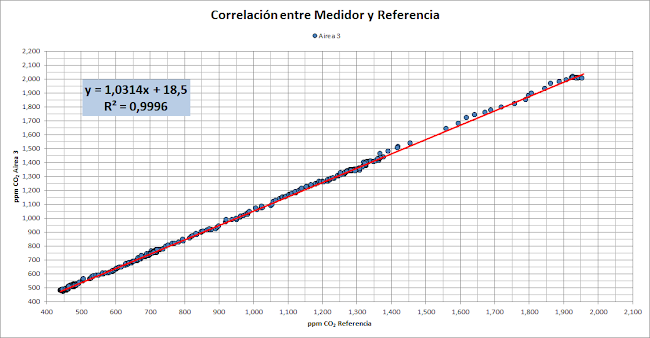
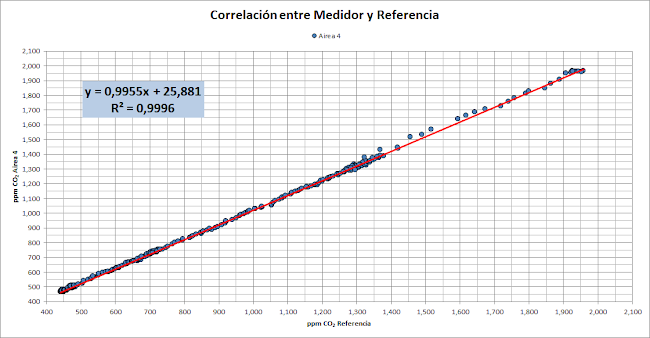
2.1 ARANET
Next figure represents the time profile of the Aranet sensors along with the reference meter in red color. Low sensor variability and high measurement accuracy are observed, where the average deviation rate against LICOR is (-3.01 ± to 1.81)% and the average slope is 0.984 ± 0.003. On the other hand, at both low and high concentrations, CO2 data are accurate.
Figure 1. Comparative measurement of CO2 concentration. ARANET
2.2 KKMOON
High measurement accuracy is observed, where the average deviation percentage versus the reference meter is (-2.56 ± to 2.86)% and the average slope is 1.00 ± 0.03. The % deviation of the sensors versus the reference are lower than 5% and not significant. The variability between sensors is small and within the manufacturer's error.
The value of the standard deviation (σ) of % deviation in the overall data set, 2.86 %, denotes that the variability among sensors is very small and there are nearly no differences between their response.
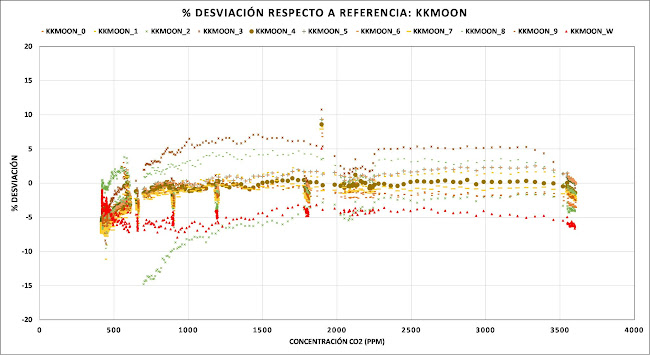
Figure 2. Percentage deviation of KKMOON meters versus reference as a function of the amount of CO2 measured.
.
2.3 CO2PANEL
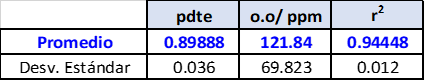
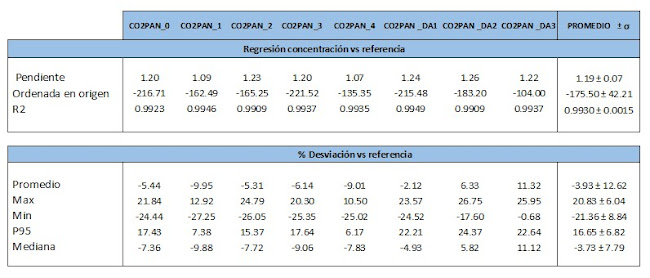
La media de las pendientes es cercana a 1.2, aunque la R2 es de 0.99, es decir, los medidores siguen muy bien las variaciones de concentración de CO2 pero requieren una mejor calibración. Consultado el fabricante, ha explicado que se realizó una calibración como parte del proceso inicial del desarrollo del medidor, y que posteriormente se ha mejorado al método de calibración, siendo los valores actuales más cercanos a los valores de referencia que los mostrados aquí (ver guía). El valor del promedio del % de desviación frente a la referencia es de (-3.93 ± 12.62)%.
Average slopes are close to 1.2, although R2 is 0.99, i.e. the sensors follow CO2 concentration variations very well but require a better calibration. Regarding this, the manufacturer explained that a calibration was performed as part of the initial process of the development of the systems, and that subsequently the calibration method has been improved, the current values being closer to the reference values than those shown here (see guide). The average value of the % deviation versus the reference is (-3.93 ± 12.62)%.
Table 2. Regression parameters and statistical analysis of differences (in %) of CO2 measurements, with CO2PANEL sensors.
2.4 Other sensors
The analysis shows that in all cases, R2 is nearly 1, showing that all of them perfectly follow CO2 concentration variations.
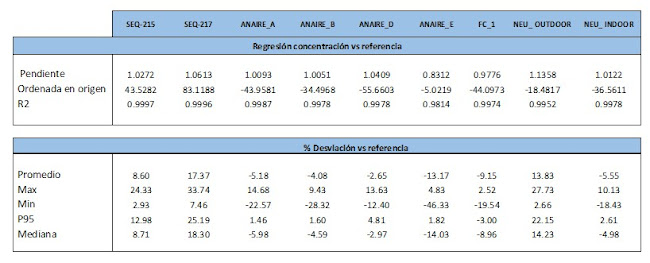
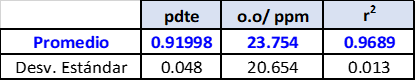
With respect to the Anarie CO2 meters, both those using the SCD30 sensor (Anaire_A and B) and the MHZ19A sensor (Anarie_D) are very accurate, with slopes very close to 1.0, low intercept values and % deviations between -2.65% and -5.18%. However, the meter used by the MHZ19C sensor is not that accurate.
Slopes of 1.02 and 1.06 are found for the Sequopro sensors, with the first sample having a very good behavior since the intercept is 43 ppm. The average %deviation of the two units tested is 8.6 and 17.4%, being lower at high concentrations. The FC sensor has a slope of 0.98 with an average deviation of 9.15%. Regarding NEU, the indoor model shows better response than the outdoor one, with slope of 1.01 and low intercept, -36 ppm, and -5.5% deviation, being therefore a very precise meter.
Tabla 3. Regression parameters and statistical analysis of differences (in %) of CO2 measurements, with the sensors tested.