Newberg School District School Improvement Plan
Chehalem Valley Middle School
2021-2024
SCHOOL DIRECTION | ||||||||||||||||||||||||||||||||||||||||||||||||||||||||||||||||||||||||||||||||
VISION Newberg School District students will graduate with the knowledge and skills needed to be successful, contributing citizens of the 21st Century. MISSION In partnership with parents and our community, the Newberg School District will educate all students to achieve their full potential as knowledgeable, self-assured citizens ready for college and/or careers. VALUES
BUILDING MISSION/VISION/VALUES STATEMENT At Chehalem Valley Middle School we focus our work in three areas:
| ||||||||||||||||||||||||||||||||||||||||||||||||||||||||||||||||||||||||||||||||
GUIDING QUESTIONS AND EQUITY LENS
2021-2022 Between the June and September 2021 Site council meetings our team reviewed a wide range of data including:
In examining our Smarter Balanced Data for ELA, in the spring of 2021 42% of our students overall were at a level 3 or 4 with 28% at a level 3 and 14% at a level 4. Only 6th and 7th grade students were required to complete the ELA assessment due to COVID restrictions (it was optional for 8th graders). This represents a slight dip from previous years (ranging between 55% and 65% between 2015 and 2019). In 2020-21, 30 students with disabilities completed the ELA assessment. 3 students (13% earned a score of 3 or higher. % of students by demographic with score of 3 or 4 on ELA Assessment
In examining our Smarter Balanced Data for Math, in the spring of 2021, 30% of our students overall were at a level 3 or 4. The OSAS math test was a required test for 7th and 8th grade students and was an optional test for 6th graders. In total, 161 of 509 CVMS students completed the math test. Of these students, 33% were at a level 3 or 4 with 12% earning a 3 and 11% earning a score of 4. 19 students with disabilities completed the OSAS math assessment. 3 students (5%) earned a score of 3 or higher. % of students by demographic with score of 3 or 4 on Math Assessment
In the 2020-21 school year we focused on student grades (specifically 8th graders) as one measure for student success. Throughout the year, we had between 3% and 9% of our students failing all 3 of their core classes (ELA, Math and Science). During the same period, between 68% and 72% of students were passing all of their classes. In reviewing attendance data from the 2020-21 school year, it is essential to take into account the fact that the first portion of the year, up until March, was online. During this time we tracked student attendance by period but were not able to track engagement effectively. Because students were marked present if they logged in, it was often unclear how many students were actually actively participating in a class on any given day.
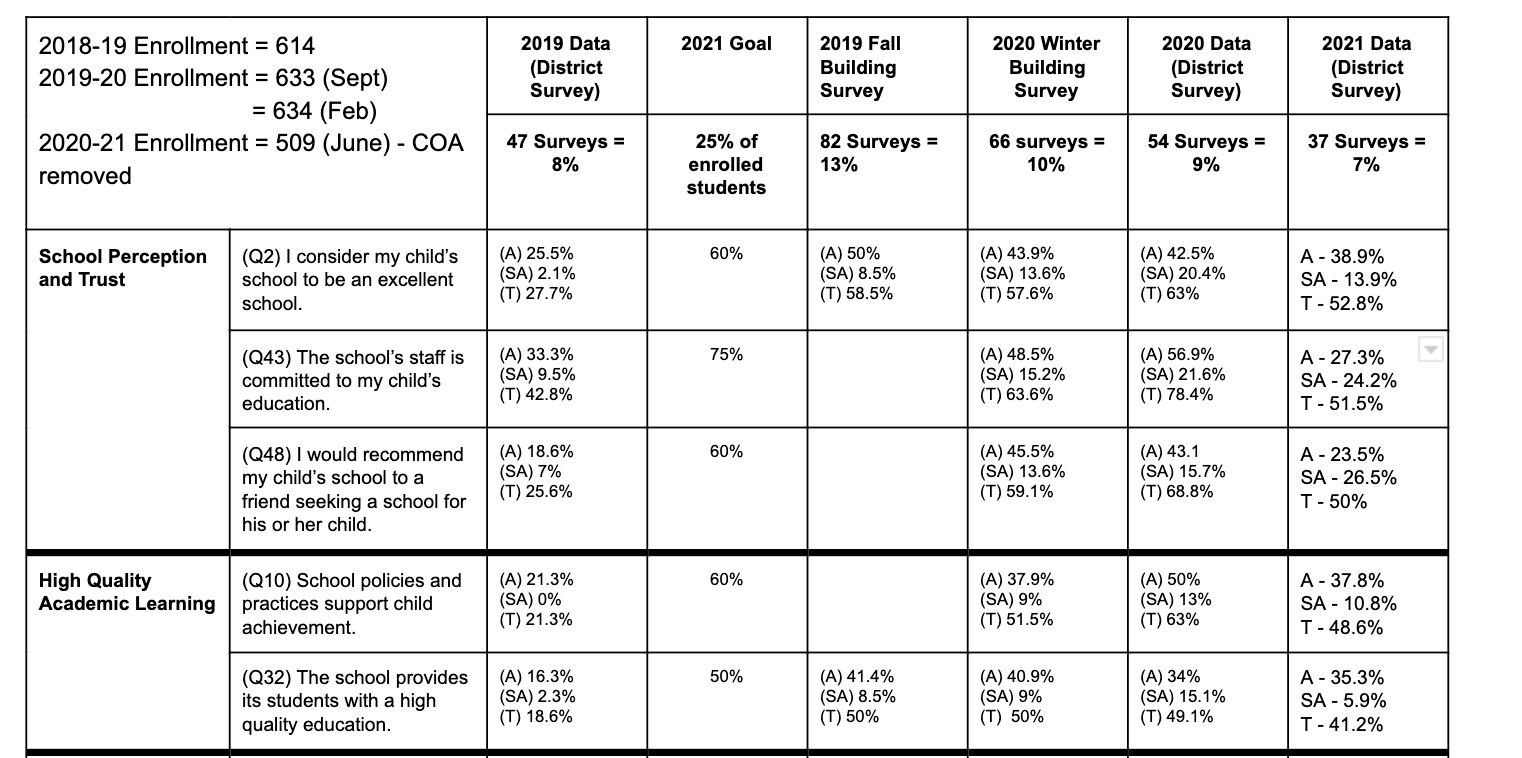
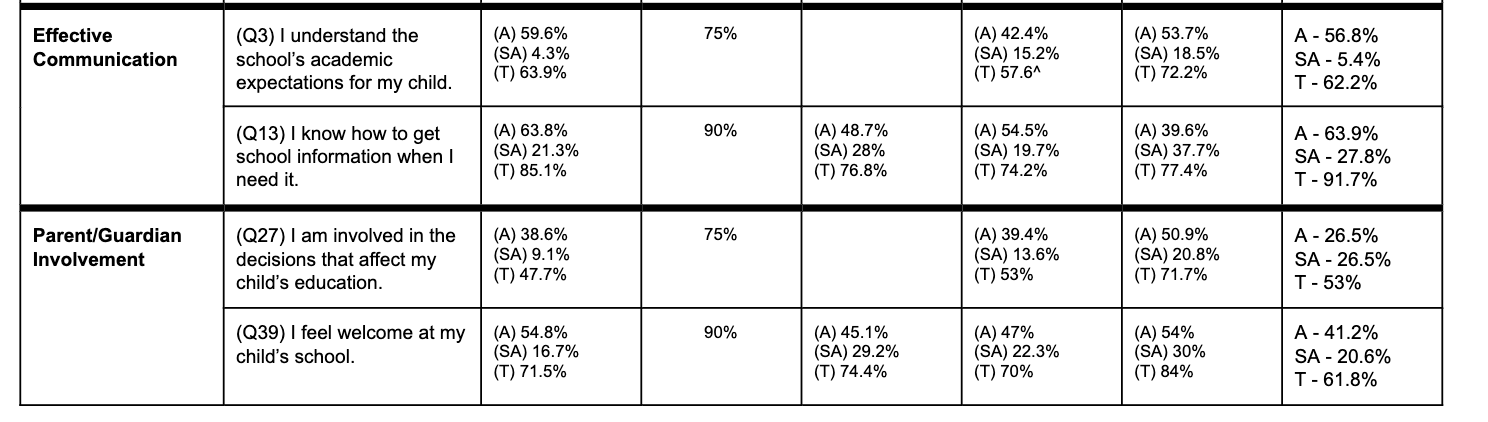
Our team also reviewed District Climate and Culture Survey data for both staff and families. Our priority from 2019-21 was to increase parent and family perception in four key areas. Over three data points (end of 2019, 2020 and 2021 school years) we saw an increase in most areas between 2019 and 2020 but a drop in 2021 (see table below). This corresponded with a decrease in survey participants.
Needs our data review elevated: Our students have significant needs coming out of two disrupted school years in academics, social emotional/ mental health and behavior. With all of the discussion taking place throughout our community regarding equity and support for all students, we have embraced Superintendent Joe Morelock’s statement that “we are continuing to focus on the needs of all students in our community”. This can be challenging, though, when needs are perceived differently or needs and wants/beliefs are in conflict. To move forward, we need to balance our goal of helping all students feel seen, heard and welcomed at CV with the misunderstanding that this means comfortable. Discomfort is going to be a part of the work. Priority Areas: Reading
Math
School Culture
Social Emotional/Behavioral/Mental Health
2022-2023 Team is deciding to keep the academic goals the same. Team is still revisiting the behavior and attendance data for the culture and climate goal. 2023-2024 In order to make them attainable, goals have been changed in ELA and Math SBAC sections. Teachers have written a school-wide goal of academic vocabulary acquisition by department and a specific department goal to improve teaching and learning within their subject.
| ||||||||||||||||||||||||||||||||||||||||||||||||||||||||||||||||||||||||||||||||
LONG TERM SCHOOL GOALS AND METRICS | ||||
| ||||
Goal 1: Reading CVMS students across grade levels will be at or above grade level in reading as measured by district and state assessments. Baseline data for iReady is the fall 2021 iReady diagnostic. Baseline data for the Oregon State Assessment is the Spring, 2021 assessment. For Spring 2021, 8th graders were not required to take the ELA assessment. | ||||
Metric(s) Students are at or above grade level in reading as measured by the Spring iReady Assessment. | Baseline Data | By 2022 | By 2023 | By 2024 |
42% of all students 37% of 6th Graders 43% of 7th Graders 43% of 8th Graders 8% of students on IEPs 2% of English Language Learners | 48% of all students 42% of 6th Graders 50% of 7th Graders 50% of 8th Graders 15% of students on IEPs 8% of English Language Learners | 58% of all students 55% of 6th Graders 60% of 7th Graders 60% of 8th Graders 27% of students on IEPs 15% of English Language Learners | 70% of all students 70% of 6th Graders 70% of 7th Graders 70% of 8th Graders 30% of students on IEPs 20% of English Language Learners | |
Students are at or above grade level (level 3 or 4) as measured by the Oregon State ELA assessment (previously SBAC) | 42% of all students. 47% of 6th Graders 39% of 7th Graders ____% of 8th Graders 19% of students on IEPs. 6% of English Language Learners. | 52% of all students. 50% of 6th Graders 55% of 7th Graders 45% of 8th Graders 20% of students on IEPs. 10% of English Language Learners. | 62% of all students. 60% of 6th Graders 63% of 7th Graders 63% of 8th Graders 25% of students on IEPs. 15% of English Language Learners. | 58% of all students. 58% of 6th Graders 58% of 7th Graders 58% of 8th Graders 30% of students on IEPs. 20% of English Language Learners. |
Goal 2: Math Students across grade levels will be at or above grade level in mathematics as measured by district and state assessments. Baseline data for iReady is the fall 2021 iReady diagnostic. Baseline data for the Oregon State Assessment is the Spring, 2021 assessment. For Spring 2021, 6th graders were not required to take the Math assessment. | ||||
Metric(s) Students are at or above grade level in math as measured by the Spring iReady Assessment. | Baseline Data | By 2022 | By 2023 | By 2024 |
22% of all students. 17% of 6th Graders 24% of 7th Graders 25% of 8th Graders 1% of students on IEPs. 4% of English Language Learners | 35% of all students. 30% of 6th Graders 37% of 7th Graders 38% of 8th Graders 10% of students on IEPs. 10% of English Language Learners | 48% of all students. 45% of 6th Graders 50% of 7th Graders 50% of 8th Graders 20% of students on IEPs. 15% of English Language Learners | 60% of all students. 60% of 6th Graders 60% of 7th Graders 60% of 8th Graders 30% of students on IEPs. 25% of English Language Learners | |
Students are at or above grade level (level 3 or 4) as measured by the Oregon State Math assessment (previously SBAC) | 30% of all students ____% of 6th Graders 27% of 7th Graders 22% of 8th Graders 15% of students on IEPs 0% of English Language Learners | 40% of all students 35% of 6th Graders 35% of 7th Graders 35% of 8th Graders 20% of students on IEPs 7% of English Language Learners | 50% of all students 48% of 6th Graders 48% of 7th Graders 48% of 8th Graders 25% of students on IEPs 15% of English Language Learners | 50% of all students 50% of 6th Graders 50% of 7th Graders 50% of 8th Graders 30% of students on IEPs 25% of English Language Learners |
Goal 3: SEL/Mental/Behavioral Health All students at CVMS will have access to support needed to effectively engage in the learning environment. Focusing specifically on behavioral, social-emotional and mental health needs, students will get what they need to get to school, to get to and stay in class and to focus on academic learning. “Get to school” is measured by overall attendance percentage (by school and grade) and students considered chronically absent. Behavior is measured by total behavior referrals and students who have repeated behavior, 10+ referrals within the school year (minor and major). Academic learning is measured by the percentage of students earning a C (70%) or better in all classes and, more specifically, in all core classes (Math, Science, Humanities). | ||||
Metric(s) Attendance | Baseline Data from the end of Q1 | By 2022 | By 2023 | By 2024 |
School wide - 93.1% 6th - 94% 7th - 93% 8th - 92% 33 students had attendance <80% 2018-19 (last full in-person school year). School wide: 93.9% 6th: 94% 7th: 93% 8th: 94% 11 students had attendance <80% | 94% attendance school wide and by grade level. Fewer than 10% of students below 80% | 95% attendance school wide and by grade level. Fewer than 7% of students below 80% | 96% attendance school wide and by grade level. Fewer than 5% of students below 80% | |
Behavior Measured in the quantity of behavior referrals for major or minor behavior incidents. | 2021-22 September - November 153 total. 21 for September, 52 for October and 80 for November. 44 - 6th grade 54 - 7th grade 55 - 8th grade 2018-19 (last full in-person school year) 1,434 total incidents 6th: 444 7th: 652 8th: 338 | Updated baseline data, Spring 2022. | ||
Academic Learning Measured by the number of students passing all courses (core and elective) with a C or better and also students passing core classes (math, science and humanities) with a C+ | S1 Data C+ in all classes 6th - 7th - 8th - Total - C+ in core classes 6th - 7th - 8th - Total - | Updated baseline data, Spring 2022. | ||
Goal 4: School Culture CVMS staff will increase opportunities for student voice to influence their practice. Students will report an increase in opportunities to use their voice to work for change within the school community and an increase in feeling valued and connected at school. | ||||
Metric(s) Students report having an influence on what their school experience is like through surveys. | By 2022 | By 2023 | By 2024 | |
*Revisit Fall 2022, draft goal based on survey results. | Review Survey Results | Review Survey Results | Review Survey Results | |
Students report feeling valued and connected at school. | *Revisit Fall 2022, draft goal based on survey results. | Review Survey Results | Review Survey Results | Review Survey Results |
Staff can identify specific ways student voices have impacted decision making from the classroom to the school level. | *Revisit Fall 2022, draft goal based on survey results. | Review Survey Results | Review Survey Results | Review Survey Results |
INITIATIVE ALIGNMENT TO SUPPORT SCHOOL GOALS | ||||
What district and building initiatives or programs will support the school in meeting the goals outlined above? Examples: Co-teaching, RTI, Chronic Absenteeism, CTE, Restorative Practices | ||||
Initiative/Program | How this initiative/program supports the school to meet goals. | |||
RTI Implementation Year | Using the RTI model, the CVMS building implementation team is collaborating on the roll out to staff. This model includes having all students participate in a reading benchmark assessment 3x per year. All teachers have access to and are actively using this data to identify key focus strategies. Humanities teachers are utilizing the instructional components of iReady to provide targeted instruction for students to fill potential gaps in their learning. | |||
Co-teaching w/ ELD | The ELD teacher is collaborating with one humanities teacher per grade level through co-teaching to provide active English Learners with ELD support. This also allows for all students to benefit from targeted language instruction in a general education classroom. | |||
PLC model | CVMS teachers meet monthly as content teams to discuss team goals, collaborate on student data and review instructional needs. Throughout the school year, cross-building opportunities are also available. | |||
Advisory w/ Character Strong | Through the Character Strong curriculum, students have access to one lesson (approx. 40 min) per week. Lesson topics focus on character skills, stress management and relationships. | |||
ANNUAL EVIDENCE BASED STRATEGIES, MEASURES, AND ACTIONS | |||||
What strategies will your team implement to support this goal? Consider what actions your team will take, what measures of evidence you will use to monitor effectiveness, who will be responsible for each action and when each action will be completed. |
Goal 1: Reading - 2022-2023 School Year | ||||
What are we going to do? | Strategy 1.1 Written as a theory of action and reflects evidence-based practices | If we support student reading through school-wide implementation of a Response to Intervention (RTI) model, then adults will have both an increased skill and will to support reading throughout the school day and students will become more skilled readers. | ||
How will we know the plan is working? | Measures of evidence for adult actions (“then” statements) | Fall School-wide focus of vocabulary identified based on fall data. Content teams identify vocabulary strategies to support throughout the school day. Humanities teachers implement iReady “my path” lessons into classroom instruction. | Winter Review winter iReady data as grade-level teams to identify school-wide, grade-level and individual needs. Content teams identify vocabulary strategies to support throughout the school day. Humanities teachers implement iReady “my path” lessons into classroom instruction. Humanities teachers will continue to implement Amplify curriculum. | Spring Review end of year iReady data school-wide, grade-level and sub-groups. Set priorities for next year. |
Measures of evidence for students (“and” statements) | Fall All students have access to vocabulary strategies throughout their school day. All students have access to targeted iReady lessons in their humanities class. Identified students have access to small group reading interventions. | Winter All students have access to vocabulary strategies throughout their school day. All students have access to targeted iReady lessons in their humanities class. Data shows growth for students across demographic groups. Identified students have access to small group reading interventions. Students needing more targeted support moved to reading support class. Student have access to after school instructional help by a lisenced teacher. Staff will implement new AMPLIFY curriculum. | Spring Data shows growth for students across demographic groups. Identified students have access to small group reading interventions. Students needing more targeted support moved to reading support class. | |
How will we get the work done? | Person or Team responsible | Action steps to be completed | Due Date | |
Admin/RS | Reading idea of the week | Ongoing | ||
Admin/RS | I-Ready diagnostic schedule | End of September | ||
Admin/RS | Fall Diagnostic and data review | October | ||
Fox | Fall interventions | October - December | ||
Staff/Admin | Staff PD- vocab acquisisiton | November | ||
RTI team | Winter assessment and data review | February | ||
Admin/RS | Review winter assessments, add additional students to reading support, small group interventions | February | ||
Admin | Spring diagnostic and data review | TBD | ||
Admin/RS | Revisit school-wide focus, determine effectiveness and plan for following year | June | ||
Admin/RS, Counseling | Plan for reading support for 2022-23 school year | June/August | ||
Admin/RS | Share out end of year data, focus for the upcoming year with all staff. | June | ||
Goal 2: Math - 2022-23 School Year | ||||
What are we going to do? | Strategy 2.1 Written as a theory of action and reflects evidence-based practices | If we provide targeted, skills-based support to all students in their math class, then adults will have both an increased skill and will to support math skills for all students and students will become more skilled math learners. | ||
How will we know the plan is working? | Measures of evidence for adult actions (“then” statements) | Fall Math teachers implement iReady “my path” lessons into classroom instruction. | Winter Math teachers implement iReady “my path” lessons into classroom instruction. Math teachers use small group instructional strategies to meet the needs of diverse learners. Math teachers collaborate with math TOSA to support learning. | Spring Review spring iReady data, focusing on student growth. Use strategic data to review current math course offerings and pathway. |
Measures of evidence for students (“and” statements) | Fall All students have access to targeted iReady lessons in their math class. | Winter All students have continued access to targeted iReady lessons in their math class. Data shows growth for students across demographic groups. | Spring Data shows growth for students across demographic groups. | |
How will we get the work done? | Person or Team responsible | Action steps to be completed | Due Date | |
Math teachers | Implement iReady lessons within their daily/weekly lessons | Ongoing | ||
Math teachers | Provide after school math help sessions for all students | Ongoing | ||
Math TOSA | Math teachers support for small-group instruction | Ongoing | ||
Math TOSA | Begin weekly support of CVMS math teachers | March - June | ||
Math team | Review diagnostic data, themes and needs for 2022-23 school year | June | ||
Goal 3: SEL/Mental/Behavioral Health - 2022-23 School Year | ||||
What are we going to do? | Strategy 3.1 Written as a theory of action and reflects evidence-based practices | If we focus on the SEL/Mental/Behavioral health of all students then adults will demonstrate an increased awareness of and willingness to support student needs and we will see increased student attendance, decreased behavioral referrals (both total numbers and quantity per student) and an increase in students passing courses with a grade of C or higher (both academic and elective courses. | ||
How will we know the plan is working? | Measures of evidence for adult actions (“then” statements) | Fall Lessons around expectations in Advisory, Assemblies and in classrooms Implement “See something, Say Something” Attendance team weekly meetings to set interventions Create inverventions for students in tier 2 and tier 2 of the behavior chart Promote and advertise student successes with: -Student of the Month - Wolf Bucks - Leadership Lolibucks - Positive Behavior Referrals | Winter PD- ACES training | Spring |
Measures of evidence for students (“and” statements) | Fall Students reporting when they “See Something, Say Something” All students will understand the expectations All students will have the opportunity to earn rewards | Winter | Spring | |
How will we get the work done? | Person or Team responsible | Action steps to be completed | Due Date | |
Staff | 1. Reteach Expectations | Ongoing | ||
Admin | 2.Training on SEL components | Ongoing | ||
Attendance Team | 3. Monitor, create interventions | Ongoing | ||
CARE team | 4.Identify students for supports | Ongoing | ||
Goal 4: School Culture - 2022-23 School Year | ||||
What are we going to do? | Strategy 4.1 Written as a theory of action and reflects evidence-based practices | If we actively seek out student voices to influence our work then adults will change their practices based on student feedback and students will feel empowered to work for change within our school community and more connected and valued at school. | ||
How will we know the plan is working? | Measures of evidence for adult actions (“then” statements) | Fall | Winter | Spring |
Measures of evidence for students (“and” statements) | Fall | Winter | Spring | |
How will we get the work done? | Person or Team responsible | Action steps to be completed | Due Date | |
Counseling | 1. Advisory lessons | Ongoing | ||
2. | ||||
3. | ||||
4. | ||||
SCHOOL SELF-MONITORING PLAN | |||||||||||||||||||||||||||||||||||||||||||||||||||||||||||||||||||||||||||||||||||||||||||||||||||||||||||||||||||||||||||||||||||||||||||||||||||||||
Please describe the plan to review and monitor progress with the Site Council and building staff on a quarterly basis.
| |||||||||||||||||||||||||||||||||||||||||||||||||||||||||||||||||||||||||||||||||||||||||||||||||||||||||||||||||||||||||||||||||||||||||||||||||||||||
The CVMS site council will meet monthly from September through June. Throughout the process, information will be shared with the CVMS staff through surveys, staff meetings, email updates and other communication processes. | |||||||||||||||||||||||||||||||||||||||||||||||||||||||||||||||||||||||||||||||||||||||||||||||||||||||||||||||||||||||||||||||||||||||||||||||||||||||
Year 1 | Results | Attendance
385 of 529 students included in our data had attendance of 90% or better. For a student enrolled for the full year (172 days) this meant 17 or fewer days of absence. Students fell below the 85% goal when they missed 26 or more days of school. 60 students were in this range, with 9 students missing 50 or more school days. Our team meeting structure has been data focused on students not meeting expectations. Historically it involved weekly meetings to review data, tiered interventions that eventually led to a citation. The negative consequences have been removed, but we haven’t effectively changed how we are addressing the needs of both students and families. This carries over to academic concerns as well, interrupted learning is a challenge for both students and staff. How do we help students who missed core instruction to make up for missed learning? This impacts grading and feedback, teacher workload, student morale and more. Support for student mental health (Lutheran Community Services). The district implemented MS Options (alternative program) that won’t continue next year. We have students who are struggling to stay in class without causing disruption - how do we help build skill and meet their needs. Loose PBIS model - positive behaviors, examine green/yellow/red (align with RTI tiered system). Behavior
Looking over our data, there was a spike in “violation of school rules” discipline - primarily mask violations in the first and second quarter of the school year. In the second half, discipline data increased for electronic misuse after we implemented a no phone policy. Throughout the year, defiance of authority and disrespectful behavior were high areas of discipline. Overall we disciplined boys over three times as often as girls. This disparity was highest in seventh grade at nearly 4 times the discipline rate for boys. In our end of year discussion, the CV site council recommended continued support for reframing behavior as skill-based (what skill is lagging? What is the motivation behind the behavior). The data suggests that while we have some behavior support for students on IEPs (that aren’t entirely effective), we also must allocate staff to support this outside of SpEd. The team wondered what this could look like, what the structure would be and what the measurement of success would be. Reading
This will need a lot of support next year - the RTI team is shifting due to staff changes. Also, we’re adopting a new ELA curriculum (Amplify) which will impact our core instruction. We’re planning to start in the fall with a full-time reading specialist who teaches 3 periods of a reading support class and 3 periods of consultation. Use iReady reports to dig into student data in an ongoing way to support differentiation (this will align with the differentiation capabilities within the new curriculum). Math -
Math will continue to use iReady, support from our math TOSA and the EdGems curriculum. Focus on differentiated small-group instruction. Student Voice - Examples: Library asking students what books to order, elective programs (drama and what it looks like, for example), Leadership class, makerspace survey, adults showing, through example, that student voice is important - listening when they have ideas, responding to emails, etc. We will have beginning of year data (school surveys) and end of year (climate and culture data) to compare. This connects with how students feel about school and student agency. Ways to report concerns - SafeOregon, connected to an adult. Ideas for next year - how do we make this more explicit, give teachers support in what this could look like, how to respond, etc. Carrie - science mindset survey. Asked about teachers caring about success, being listened to, etc. Overall, students felt positive about this. Scores decreased as the year went on (this aligned with overall scores). Carrie shared her goal with the survey to gauge student overall perspective on school, work habits, etc. It would be interesting to do a survey like this at the start of the year through advisory to get an idea of where all students were at. Use this to build trust with students. | |||||||||||||||||||||||||||||||||||||||||||||||||||||||||||||||||||||||||||||||||||||||||||||||||||||||||||||||||||||||||||||||||||||||||||||||||||||
Year 2 | Attendance:
Comments: We will keep this goal at 96%. We do very well at finding ways to get our students in the tertiary (red) zone here, but we are struggling to make any movement on the students in the yellow zone. These are students between the 70-80%. Behavior:
Comments: We went from 1,434 incidences in 18-19 and reduced that considerably last year. Looking at current discipline data, we feel like we could reduce from approximately 500 referrals to 250. Tardy policy, training for CPS, change in phone policy, setting expectations to start the year will increase our teaching and expectations. Reading:
SBAC - ELA
Comments: The team feels like a move to a 60% goal will be more attainable, especially due to: More control over chromebooks Better understanding of curriculum Extra intervention classes Examine studetn testing data for strengths and weaknesses Math -
SBAC - MATH
Comments: More control over chromebooks Better understanding of curriculum Extra intervention classes Examine testing data for student strengths/weaknesses Culture Climate: (Student Voice) - Positive Behavior Referrals (as of 6/12) - 303 given out Wolf Bucks (as of 6/12) - 944 submitted by students Lolibucks (leadership-driven) student reward system | ||||||||||||||||||||||||||||||||||||||||||||||||||||||||||||||||||||||||||||||||||||||||||||||||||||||||||||||||||||||||||||||||||||||||||||||||||||||
Year 3 | Attendance: 2023-2024, Goal 96%
Comments: We will keep this goal at 96%. We do very well at finding ways to get our students in the tertiary (red) zone here, but we are struggling to make any movement on the students in the yellow zone. These are students between the 70-80%. Behavior: 2023-2024, 250 Referrals
Comments: We went from 1,434 incidences in 18-19 and reduced that considerably last year. Looking at current discipline data, we feel like we could reduce from approximately 500 referrals to 250. Tardy policy, training for CPS, change in phone policy, setting expectations to start the year will increase our teaching and expectations. Reading:
SBAC - ELA
Comments: The team feels like a move to a 60% goal will be more attainable, especially due to: More control over chromebooks Better understanding of curriculum Extra intervention classes Examine studetn testing data for strengths and weaknesses Math -
SBAC - MATH
Comments: More control over chromebooks Better understanding of curriculum Extra intervention classes Examine testing data for student strengths/weaknesses Culture Climate: (Student Voice) - Positive Behavior Referrals (as of 6/12) - 303 given out Wolf Bucks (as of 6/12) - 944 submitted by students Lolibucks (leadership-driven) student reward system | ||||||||||||||||||||||||||||||||||||||||||||||||||||||||||||||||||||||||||||||||||||||||||||||||||||||||||||||||||||||||||||||||||||||||||||||||||||||