Tutorial for the Staking calculator and projection tool in Cardano.
- Introduction:
- Disclaimer: This tool allows the user to make future projections of the crypto and Cardano markets. It is important to understand that these are projections only and their accuracy cannot be assumed or guaranteed.
- This is a Cardano-focused tool that allows users to make projections with a macroeconomic approach of the general crypto market for the next 2 decades as well as ADA price projections for the same period as a direct consequence of the percentage of dominance within the market.
- After watching hundreds of videos of ADA price predictions, most of them without any fundamental or macro backing, only based on TA, we decided to develop this tool for users to make their own projections focused on basic macroeconomic analysis with the intention of keeping them real. It also helps us analize, from the perspective of % of market dominance, price projections for ADA that make sense, especially when compared with the current market dominance of Ethereum since it is a blockchain within the same category as Cardano (Smart Contract Platform).
- This tool works with updated information from the website www.coinmarketcap.com and from Google Finance financial functions. The current values of the crypto market used in the calculator are updated every hour and a new record is added to the history dominance table of BTC, ETH and ADA on a daily basis with the information for each day.
- This tool will be maintained and updated as changes are required. For example, when the year 2022 begins, a new line will be added to the historical market performance table and the necessary changes will be made so that the tool continues to work properly.
- Purposes:
- Identify the size of the crypto industry in a macroeconomic context.
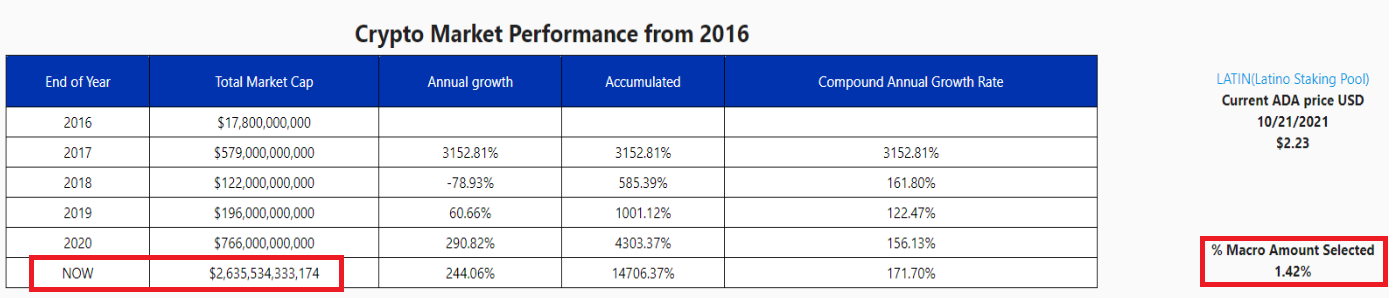
The value shown in the lower right corner represents the percentage of the value of the current crypto market compared to the macroeconomic amount chosen in the first section of the tool:
- Highlight the real performance of the crypto market during the last 5 years.
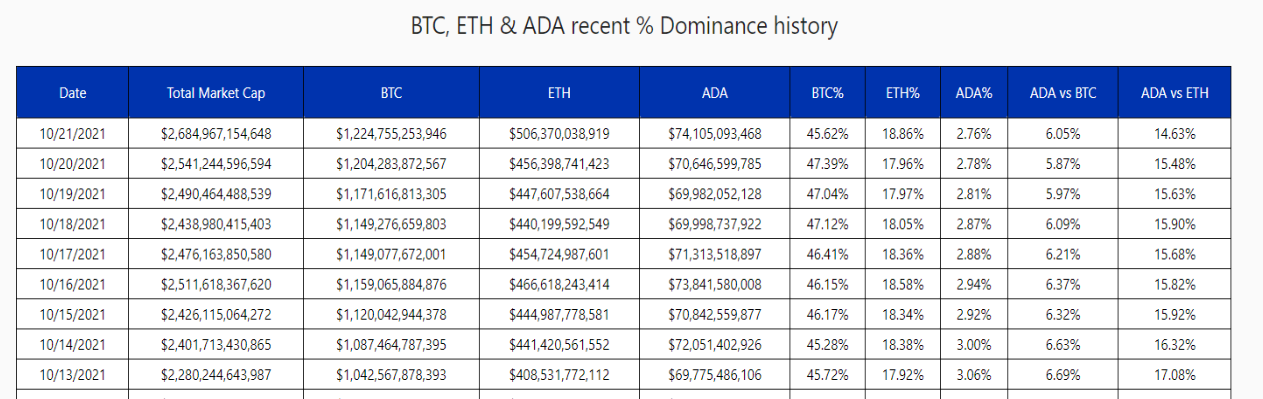
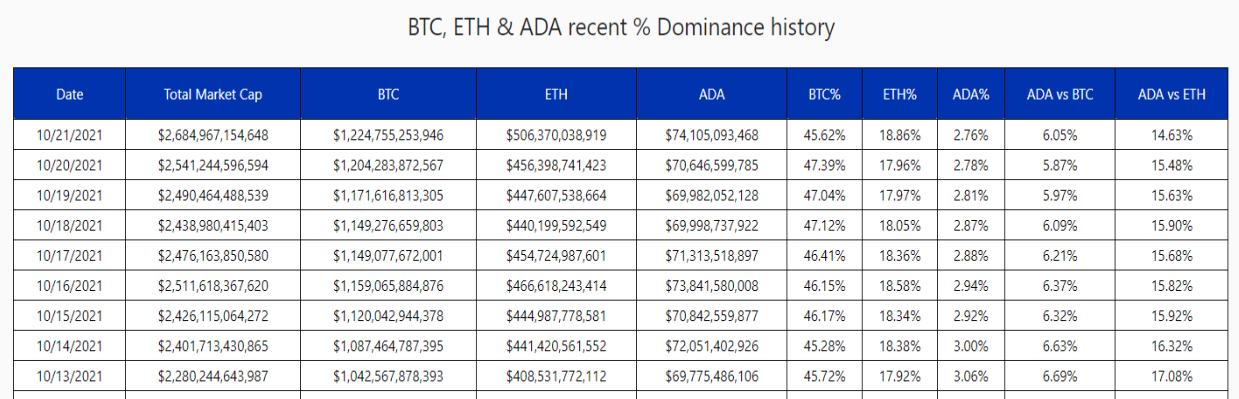
- Identify the dominance percentages of Bitcoin, Ethereum, and Cardano over the past few months.
- It allows the user to make their own projections of the crypto market for the next 2 decades.
We allow 2 different percentages to be entered for 2021 to 2030 and for 2031 to 2040. That way we can calculate assuming that adoption in the next decade will be different from the next.
- It allows the user to make their own projections of Cardano's dominance or market penetration for the next 2 decades.
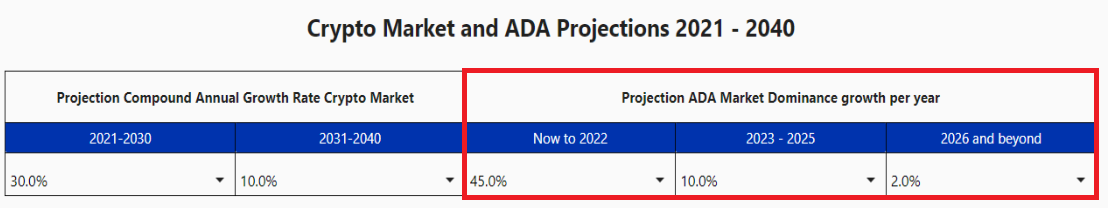
We allow 3 different percentages to be entered: from now to 2022, from 2023 to 2025 and from 2026 to 2040. Because we are at the beginning of the Goguen era, for the next few months Cardano's potential of rapid adoption and growth can generate an exponential increase. Over the next 3 years, a slightly less explosive adoption trend is likely to continue and we assume that by 2026 growth will potentially be even slower. You can adjust these percentages according to your own criteria.
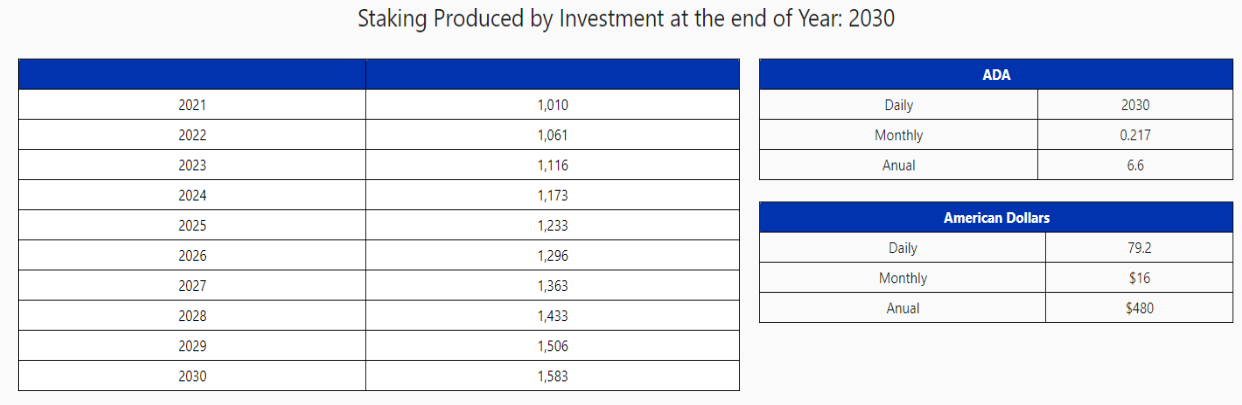
- Based on these projections, the Cardano Staking Calculator allows the user to estimate the monthly amount of money in the selected fiat currency that could be produced passively by the end of the selected year (from 2022 to 2040) according to the number of ADAs entered. (Option A).
- Alternatively, and based on the same projections, the Cardano Staking Calculator helps the user to project the amount of ADAs to invest now and the equivalent cost in the selected currency, to receive the amount of monthly money entered as a result of staking by the end of the selected year (from 2022 to 2040). (Option B).
Note: The Staking Calculator assumes an initial investment with no additional deposits or withdrawals during the Staking period.
- Components:
The tool originally loads with projections that we think make sense. We suggest first familiarizing yourself with the different components by analyzing the information presented at the beginning:
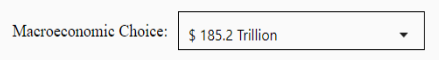
- Selection section of the macroeconomic quantity to be used.
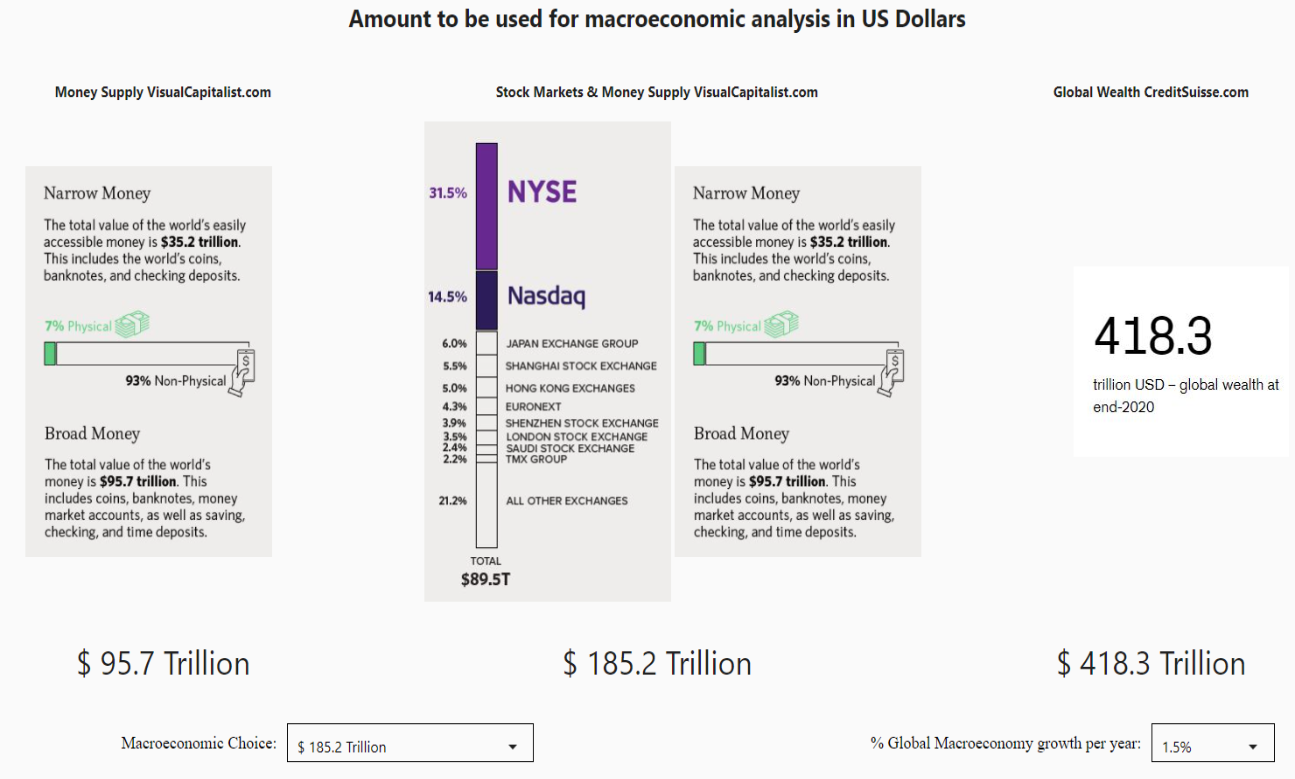
- The 3 images of the macroeconomic quantities can be clicked to navigate to the sources of the information.
- The idea of this section is that according to the current trend of adoption of cryptocurrencies, part of the world's money will continue to migrate to the crypto industry in the coming decades. If the first option of 95.7 Trillion is chosen, you would be using the money in the banks of the world by mid-2020. If the second option is chosen, you would be using the money that was both in the banks and in the stock markets of the world and if the third option is chosen, you would be using the global wealth by the end of 2020.
- Based on our research, we think that a projection of the annual growth percentage of the macroeconomy of 1.5% is adequate, but you can change this value according to your criteria.
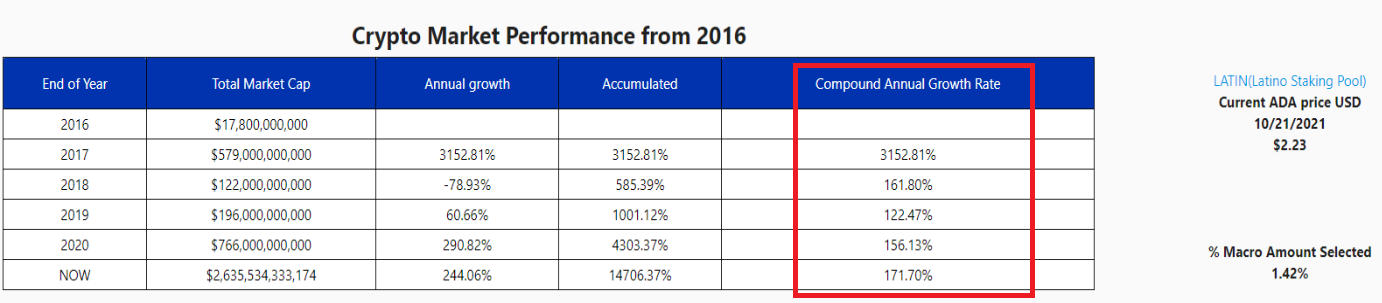
- Section of Historical performance of the crypto market since 2016.
Pay special attention to the column “Compound Annual Growth Rate”. By the end of 2020 this rate was 156.13% growth of the crypto market year over year from 2016 to 2020. When comparing this performance with the Standard and Poor 500 Index of the United States market, which is approximately 8% a 10% during the last decades, it’s easy to understand the growing interest of this industry. In this section we also appreciate the percentage of the current crypto market compared to the macroeconomic amount selected in the first section. This helps us to realize how small this industry still is.
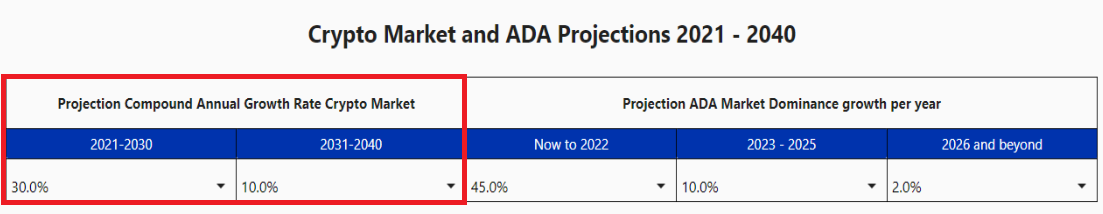
- Section to enter the percentages to project the Compound Growth Rate of the crypto market and the annual growth of ADA dominance in the market.
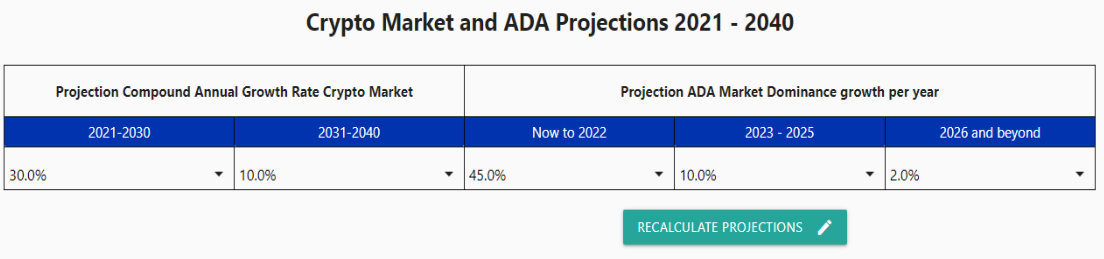
This section includes the button to recalculate the projections each time the percentages in the previous sections are changed. The initially uploaded values represent projections that make sense in our view and we consider to be very conservative when compared with the historical results of the last 5 years of 168% at the time of recording this video compared to 30% for the next decade and 10% for the next one. In the same way, due to the historical moment that Cardano is experiencing at the end of 2021, in which its technology is about to explode, we think that a dominance percentage growth of 45% per year until the end of 2022, 10% from 2023 to 2025 and 2% from 2026 to 2040 are very conservative projections that would put Cardano with a maximum dominance in 2040 of 10.51%. This is even more evident when compared to Ethereum's recent highest dominance of around 20%.
- Table of crypto and Cardano market valuation projections from 2021 to 2040.
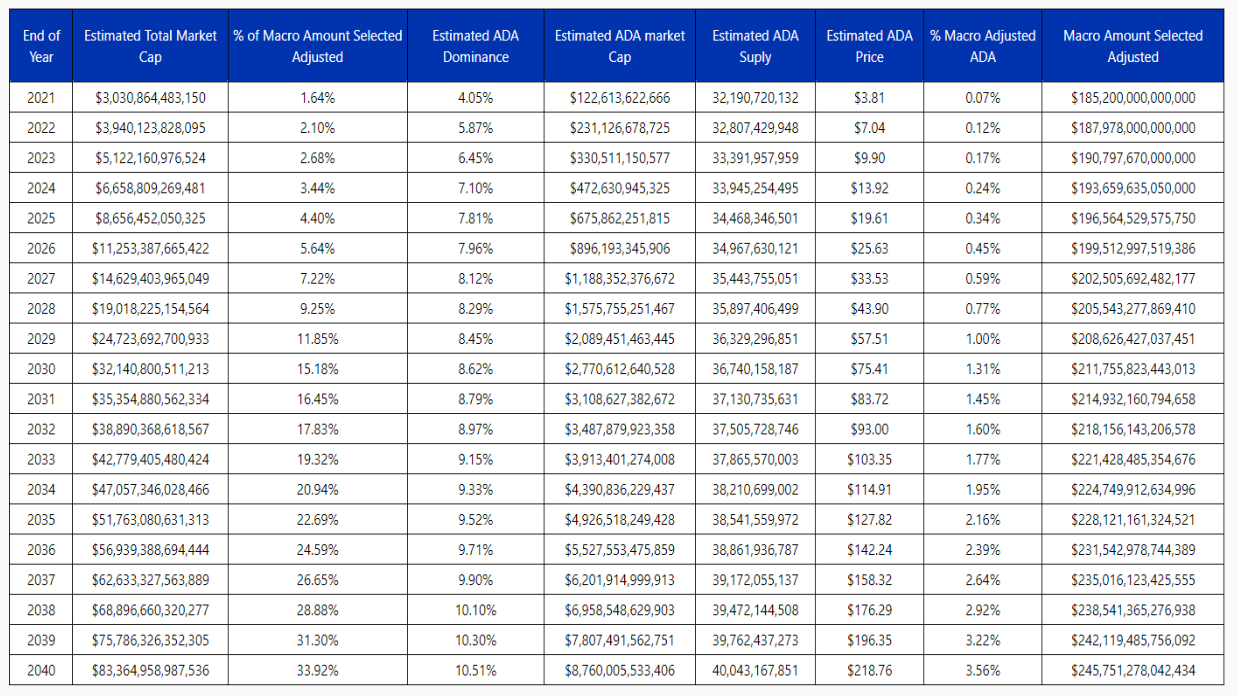
This table is calculated according to the percentages entered in the previous sections after pressing the "recalculate projections" button. Pay special attention to the third column as it helps analyze how aggressive or conservative our projections are since it calculates the percentage of the projected valuations of the crypto industry compared to the selected macroeconomic values, displayed in the last column, for each year. One of the main functions of this tool is to make projections of the ADA price for the next 2 decades, so the column of the estimated ADA price and the “ADA Adjusted Macroeconomics percentage” are very important as well. Once you are satisfied with your projections of future market value and ADA price projections for the years of interest generated by the projection tool, the calculator will help you visualize what kind of passive income would be possible thanks to the “compound interest” generated by staking and the valuation of ADA due to market growth and the dominance of Cardano.
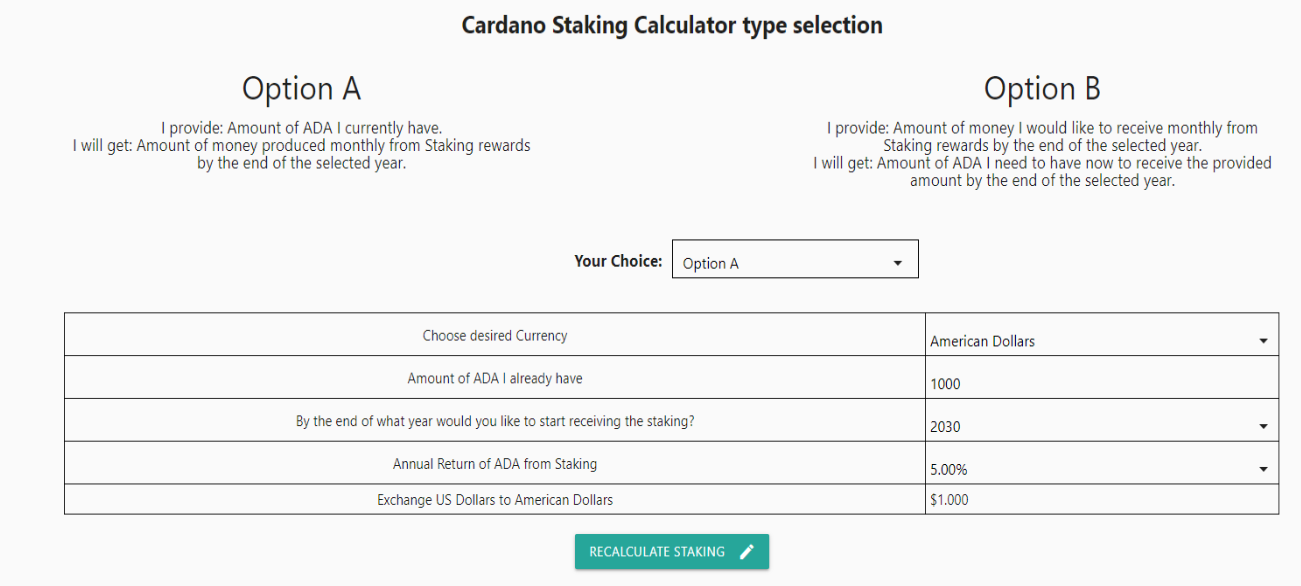
- Section to select the type of calculator to be used.
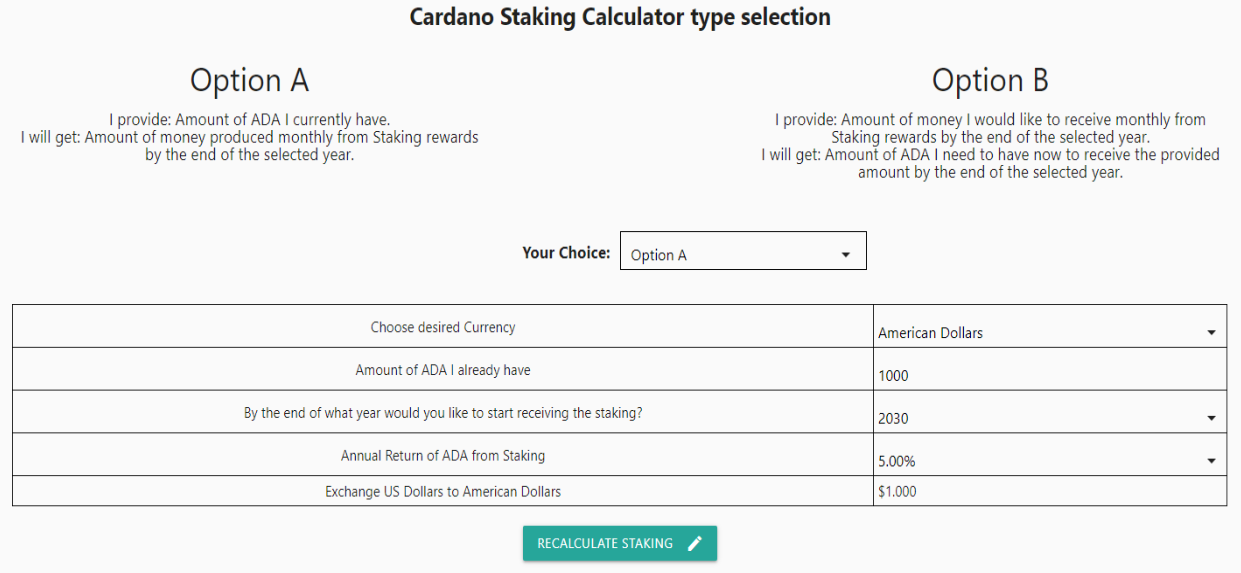
The calculator can be used in two different ways:
- Option A: The user enters the amount of ADAs they currently have and the calculator returns the monthly amount of money, in the fiat currency of their selection, that they will receive at the end of the entered year for Staking.
- Option B: The user enters the monthly amount of money in the fiat currency of his choice that he would like to receive by the end of the selected year, and the calculator gives him the amount of ADAs he should have now and the cost in the same fiat currency for acquire that many ADAs.
- In addition to the type of calculator to be used in this section, the user must select the desired fiat currency, the year for which he wants to obtain the results and the Staking rate of return (ROS). The current exchange rate of the currency entered into US dollars is also automatically presented in this section.
- At the bottom of this section is the "Recalculate Staking" button which must be pressed every time the user makes changes to any of the variables in this section to update the calculator results. It should be noted that any change made in the projections section when pressing the button above "Recalculate Projections", automatically updates the results of the calculator.
- Calculator results section. This section provides the calculator results in a readable way. It is divided into 4 paragraphs:
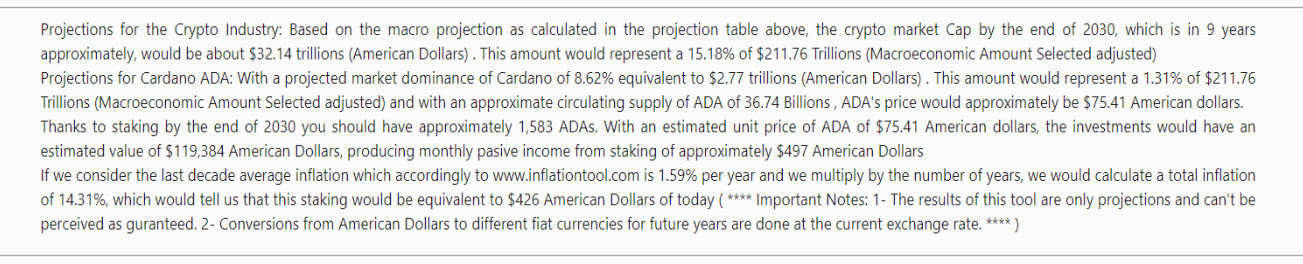
- The first paragraph refers to the results of the crypto market for the selected year.
- The second paragraph refers to the ADA results for the selected year.
- The third paragraph refers to the Staking results and is where you mainly find what users want to know.
- The fourth paragraph includes an inflation component of the different fiat currencies that helps the user to compare the projected future value in relation to the current value due to the inflation of each currency.
- This section also includes Staking tables that allow the user to view the same information in a different way and also allow them to see how their ADAs grow year after year due to Staking.
- The last section is an automatically maintained table showing daily entries of individual and crypto market valuations for Bitcoin, Ethereum and Cardano. It also shows the dominance percentages of these three cryptocurrencies and the size of Cardano compared to Bitcoin and Ethereum. This table shows the recent history of the last 4 months.
- Instructions for use:
- Select the macroeconomic quantity that you want to use with the tool.
- Analyze the percentage of annual macroeconomic growth and adjust it according to your criteria.
- Analyze the table of performance of the crypto market since 2016, paying special attention to the compound annual growth rate at this time and the percentage of the current value of the crypto market compared to the selected macroeconomic amount.
- Analyze the projection table and make the corresponding changes to both, the 2 percentages to project the compound annual growth rate of the crypto market and the 3 percentages to project the annual growth of ADA dominance, according to your own criteria.
- Every time you change a variable in the previous steps, you must press the "Recalculate Projections" button to update the projections table.
- Analyze the projections table paying special attention to the 2nd and 3rd columns to evaluate that the projections are not too aggressive according to the adjusted macro quantity reflected in the last column. We invite you to familiarize yourself with the tool and analyze the implications of changing each of the variables. Once you obtain projection values that you can relate to in terms of the total market value for the next 2 decades and the projected price of ADA as a consequence of the percentage of Cardano dominance for each of the years, we recommend that you save these values as every time you start the tool it will start with the standardized percentages.
- Starting with projections that make sense to you, proceed now to Cardano's Staking calculator if you wish. All calculator results are based on the values in the projection table.
- Select the type of Calculator you want to use:
- Option A: In this calculator you must enter the amount of ADA that you have or the amount of ADA with which you would like to do the calculations.
- Option B: In this calculator you must enter the monthly amount of money in the fiat currency of your choice, that you would like to receive by the end of the selected year.
- The rest of the fields to enter are the same for the 2 types of calculator:
- Select the fiat currency you want to work with.
- Select the year for which you would like to calculate the results (Results are assumed at the end of the year entered).
- Select the Staking Annual Return rate (Cardano's protocol offers an approximate 5% sustainable annual return, but a return between 4.5% and 5.5% is considered a normal range of return). You can use this variable to discover results at different annual returns. This variable would allow you, for example, to look at the repercussions of starting to take part of your returns from Staking and leave the other part as compound interest, increasing the principal.
- If you change the fiat currency to be used by the tool, you must press the "Recalculate Staking" button to obtain the updated exchange rate, and recalculate all the variables.
- When you have entered all the above variables, press the "Recalculate Staking" button and after a few seconds you can proceed to read the results in the next section. Analyze the results issued by the calculator and we invite you to do the exercise of looking at the results with different years, which will show you the enormous importance that in our way of seeing patience has since the more time the market passes very surely and Cardano will have more adoption (especially during the next two decades) and also compound interest (Staking ROS) is a magic whose results are directly proportional to the longevity of the investment.
- Estimates of the impact of inflation are also included in the calculator according to information obtained from www.inflationtool.com for each of the fiat currencies, assuming that the same inflation trend continues in the future.