How to access Attendance Information using ATP401 in Synergy |
This report can be used to pull information for your entire school. This report is most ideal for Secondary Schools that use Period Attendance. |
Steps and notes for generating the report: |
Step | ScreenShot | Considerations |
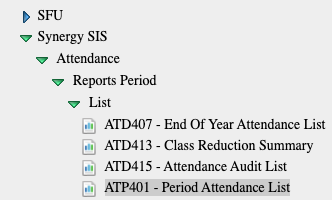
Navigation | Use the following navigation tree or the quick launch to open ATP401 Bookmark the report as needed | |
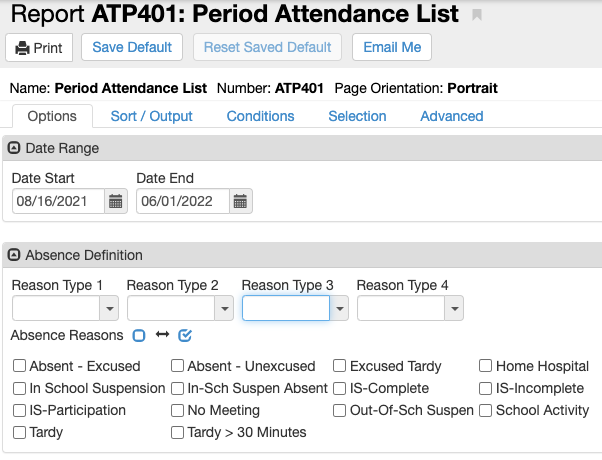
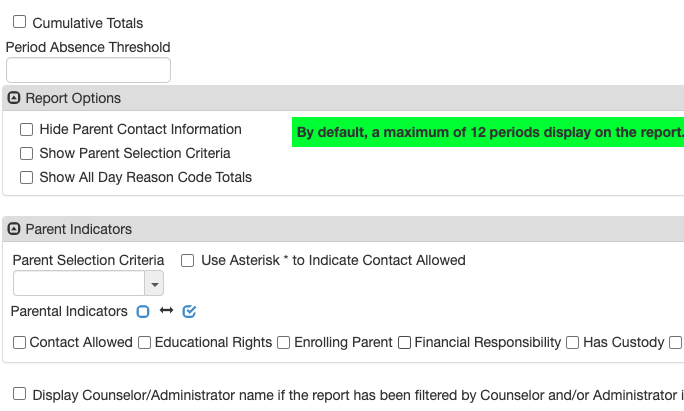
Options tab | You can pull information by certain date ranges or attendance marks. Clear the reason type drop downs and select what types of attendance marks you would like to see. Finally, the options and parent indicators areas can be used to add additional information to your report. | |
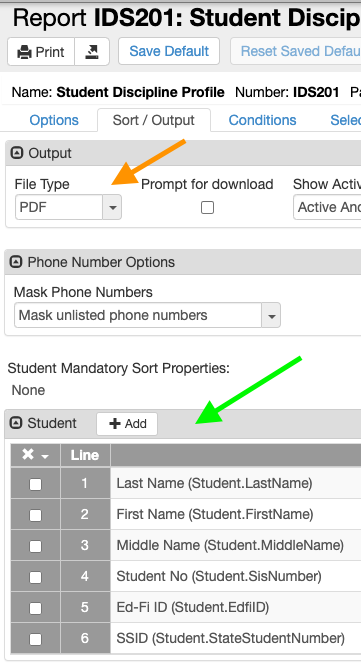
Sort / Output tab | You can select various file types for the report to generate, including PDF or Excel (orange arrow) You can also use the add button in the Student area to add additional information to your report, including ethnicity. For more information on these steps see below If you are not adjusting the file type or adding additional information you can click print at this point for the report to generate. | |
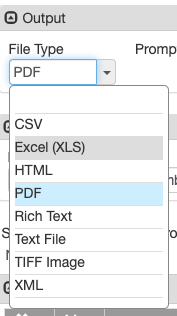
Adjusting the file type | Click the drop-down field as shown to access various file types for the report to generate in. PDF and Excel are both commonly used. Note that when generating in Excel some formatting and removal of excess information will be required. Using graphs and pivot tables can be useful for reviewing data. | |
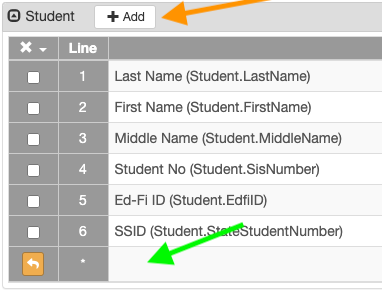
Adding Student Information Fields | Click the add button (orange arrow) to add a row for additional information (green arrow). If you click into the open space a menu will appear with additional options. Race and ethnicity are not available in this report. | |
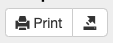
Generate the Report | Press the print button and the report will generate using the options you selected. Try generating this report in a few different formats to see what works best for you and your Coordinated Care Team. | |
Excel or Google Sheets results | Review the ATP 401 overview and demonstration video for a look at how this report functions when pulled into Google Sheets and used with a pivot table. | |
Questions?Reachout to sflink@sfusd.edu for more information on Coordinated Care Team Structures |