User Guide and Manual
Cambodia M&EDashboard
Production by SERVIR Mekong

Cambodia Biophysical Monitoring and Evaluation Dashboard
User Manual
Version 1.0
© 2021, SERVIR-Mekong
DISCLAIMER
The User Manual is the property of SERVIR-Mekong. The information contained in this document is meant for the intended recipient and shall not be used, published or redistributed without the prior written consent of Asian Disaster Preparedness Center
Table of Contents
1. Introduction to Cambodia Biophysical M&E Dashboard 1
3. Components of the Biophysical M&E Dashboard 7
4. Steps to access the Biophysical Monitoring and Evaluation data portal. 9
4.2.1 Biophysical monitoring 14
Acronyms and Abbreviations
BACI | Before and After Control Impact |
CEMIS | Cambodia Environment Management Information System |
EVI | Enhanced Vegetation Index |
GEE | Google Earth Engine |
GPL | Greening Prey Lang |
M&E | Monitoring and Evaluation |
MOE | Ministry of Environment |
NASA | National Aeronautics and Space Agency |
NFMS | National Forest Management System |
PPAM | Provincial Protected Area Management |
REDD+ | Reducing Emissions from Deforestation and Forest Degradation |
RLCMS | Regional Land Cover Monitoring System |
RS | Remote Sensing |
SAR | Synthetic Aperture RADAR |
SFB | Supporting Forests and Biodiversity |
SV-SM | SERVIR-Mekong |
TCC | Tree Canopy Cover |
TCH | Tree Canopy Height |
UNDP | United Nation Development Program |
USAID | U.S. Agency for International Development |
List of Figures
Figure 1.Launching page of the Biophysical Monitoring and Evaluation Dashboard 1
Figure 2. The infrastructure for spatial application . 4
Figure 3. Schematic overview of the BACI framework.. 4
Figure 4. The tool structure and data inputs 7
Figure 6. General interface of the tool 10
Figure 7. The Dashboard control 12
Figure 8. Users can customize the Area of interest. 13
Figure 9. Biophysical monitoring component 14
Figure 10. Map and charts of Biophysical change 15
Figure 11. Map and charts of Land cover change 16
Figure 12. The forest monitoring component 17
Figure 13. Map and chart in forest monitoring panel 18
Figure 14. Exported report of forest monitoring component 19
Figure 15. The forest alert component 20
Figure 16. The exported report of forest alerts 21
Figure 17. The Sentinel -1 forest alert examiner for REDD+ 21
Figure 18. The Fire hotspot component panel 22
Figure 19. Other Map layers 23
Executive Summary
Ensuring ecological stability and biological productivity over large areas is critical for landscape management and conservation policy, USAID/Cambodia, along with other stakeholders, require insight and reports on the effectiveness of biodiversity and conservation-related project interventions. SERVIR-Mekong’s Biophysical M&E Dashboard tool was developed in response to those needs. The Cambodia Biophysical M&E Dashboard is the tool that can monitor performance of landscape-scale efforts and biophysical conditions on-the-ground. SERVIR-Mekong developed the Biophysical M&E tool to meet the request from the USAID mission in Cambodia. Development of the tool designed for project monitoring and evaluation, enabling the identification of changes in biophysical conditions on-the-ground to support USAID-funded biodiversity and conservation projects.
This manual provides information about the framework and approach that has been applied to build the Cambodia Biophysical Monitoring and Evaluation Dashboard, and the structure of components in the tool. The tool leverages the power of cloud computing and open satellite data on Google Earth Engine for data processing and monitoring the change of biophysical condition and forest cover in Cambodia due to conservation project intervention and support for sustainable landscape management. This User Manual therefore, contains all essential information for the user to make full use of the Cambodia Biophysical M&E Dashboard tool by providing stepwise information on visualizing and exploring the platform and step-by-step procedures for information access and use.
Introduction to Cambodia Biophysical M&E Dashboard
https://me-dashboard-servir.adpc.net/
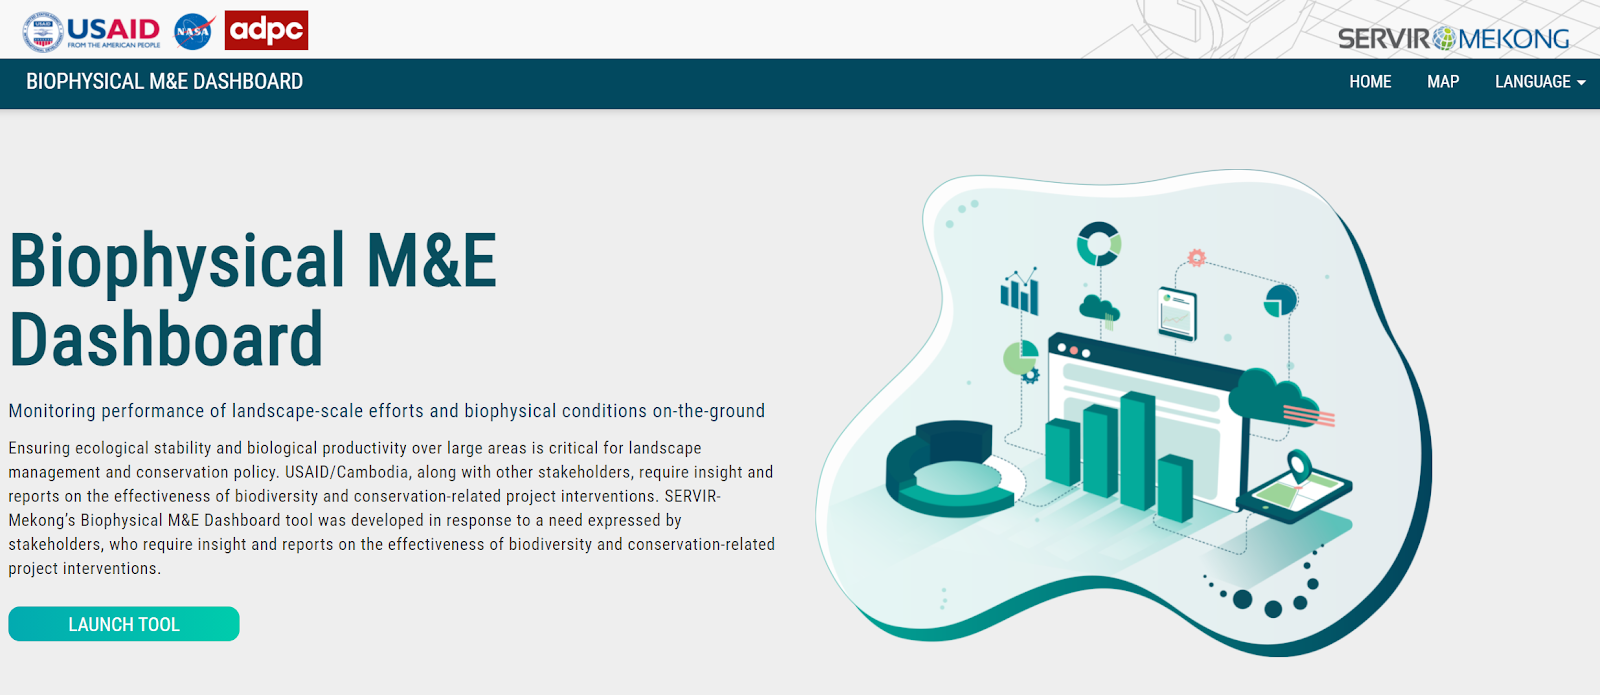
Figure 1.Launching page of the Biophysical Monitoring and Evaluation Dashboard
Cambodia is home to around 50 protected areas and a number of biodiversity corridors, which cover an area of approximately 7.5 million hectares - equating to 41% of the country’s total land area. Cambodia’s protected area system contributes positively to the country’s economy and sustainable development through the sustainable use of its biological, natural, and cultural resources. Through implementation of USAID’s Supporting Forests and Biodiversity (USAID SFB) projects in Cambodia, there have been numerous meaningful results that have improved the conservation and governance of Cambodia’s forest landscapes.
Ensuring ecological stability and biological productivity over large areas is critical for landscape management and conservation policy, USAID/Cambodia, along with other stakeholders, require insight and reports on the effectiveness of biodiversity and conservation-related project interventions. SERVIR-Mekong’s Biophysical M&E Dashboard tool was developed in response to those needs. The Cambodia Biophysical M&E Dashboard is the tool that can monitor performance of landscape-scale efforts and biophysical conditions on-the-ground.
SERVIR-Mekong developed the Biophysical M&E tool to meet the request from the USAID mission in Cambodia. Development of the tool designed for project monitoring and evaluation, enabling the identification of changes in biophysical conditions on-the-ground to support USAID-funded biodiversity and conservation projects, according to the USAID indicators outlined below:
- Indicator EG.10.2-1: Number of hectares of biologically significant areas showing improved biophysical conditions as a result of USG assistance. Area of improved or degraded biophysical condition in the project area.
- Indicator EG.10.2-2: Number of hectares of biologically significant areas under improved natural resource management as a result of USG assistance. Annual area of deforestation (ha) and/or reforestation (ha).
Therefore, the Biophysical M&E Dashboard tool builds upon SERVIR-Mekong’s existing Eco-Dash platform and consists of four key components. The default ‘biophysical monitoring’ layer evaluates changes in broad-scale biological productivity using the Enhanced Vegetation Index (EVI), a measure of relative biomass particularly suited to high-biomass areas of the globe, derived from MODIS multispectral data. The other three components are Forest monitoring (forest gain/loss, derived from Landsat); Forest alerts (threat alerts, derived from Landsat); and Fire hot spot monitoring (hotspots and burned area, derived from MODIS). The user interface leverages the power of Google Earth Engine (GEE), a cloud computing platform that links extensive data archives with substantial processing power. With the continuous time-series feature, the user is able to select a baseline and evaluation period for each of the components as well as an identified area of interest which allows for easy comparisons between ‘before’ and ‘after’ intervention timeframes (Poortinga, 2018). The results can be exported in report-style format enabling decision-makers and non-technical users alike to directly use this analysis and information. These components of the tool were selected based on the needs of USAID/Cambodia and their specific M&E indicators, with carbon and biomass estimations to be incorporated in the future.
Application Purpose
Aside from monitoring performance of landscape-scale efforts and biophysical conditions on-the-ground, the Biophysical M&E Dashboard Tool can provide valuable insights into the possible drivers of change such as climate change, urban expansion and infrastructure development.
Application Uses
The Biophysical M&E Dashboard tool is currently being used by USAID/Cambodia to track performance and report on landscape-scale efforts and biophysical conditions on-the-ground in accordance with the project performance indicators, including quantifying areas of biological improvement and improved natural resource management.
Tool Approaches and framework
The Biophysical Monitoring and Evaluation Dashboard tool was developed by applying the framework to quantify and monitor the change of biophysical condition and forest cover using two common remote-sensing data products that incorporate the Before and After Control Impact (BACI) design (Upton,2014 and Carpenters, 1989). This approach is used in ecology and environmental studies as an experimental design to evaluate the impact of an environmental change on an ecosystem (Carpenters, 1989). The framework is based on repeated measurements of several vegetation variables at various times over an observational period. Measurements were taken at a location which was known to be unaffected by vegetation change (control location) and at another location which potentially would be affected by this same change (be explicit) (treatment location) for each time step (Upton,2014). The framework is based on the Google Earth Engine cloud computing platform, which is a technology that is able to rapidly deliver information derived from remotely sensed imagery in near-real time.
Recent technological advances have greatly enhanced computational capabilities and facilitated increased access to the public. In this regard, Google Earth Engine (GEE) is an online service that applies state-of-the-art cloud computing and storage frameworks to geospatial datasets.
The framework processes as request data, perform spatial calculations, and serve the information in a browser is shown in Figure 2.
The front-end relies on Google App engine technology. Code developed from either the JavaScript or Python APIs are interpreted by the relevant client library (JavaScript or Python, respectively) and sent to Google as JSON request objects. Results are sent to either the Python command line or the web browser for display and/or further analysis. Spatial information is displayed with the Google Maps API and other information is sent to a console or the Google Visualization API.

Figure 2. The infrastructure for spatial application development provided by Google. The Google Earth Engine consists of a cloud-based data catalogue and computing platform. The Django web server framework is used to host the Earth Engine application.
Methods and data input
Method
A common method for evaluating the impact of environmental and ecological interventions that applied in this tool development is the BACI (Before-After, Control-Impact) method (Smith, 1993). Figure 3 provides a schematic overview of the BACI framework. For the intervention area, the before and after variables of interest are measured. These are compared with the before and after measures of the same variables at a control site. The differences between the intervention and control sites determine the impact generated by the interventions (Conquest, 2000 and Underwood, 1992).

Figure 3. Schematic overview of the BACI (Before-After, Control-Impact) framework. For both the control and impact sites the before and after situations are evaluated. The difference between the two after situations defines the impact of the measures.
Together with recent advances in cloud-based remote sensing and geo-computational platforms, these technologies have led to greater open scientific data for use by policy makers and practitioners outside of academia. The hybridization and simplification of these technologies also allow scientists to provide policy-makers, international donors, NGOs, and other development partners with tailor-made products to monitor and value their ecosystems in near real-time, and requiring less advanced technical expertise than in the past.
In this tool development, we applied a near real-time method for quantifying vegetation using cloud computing technology and remote-sensing data. We developed a novel custom indicator to monitor vegetation on a planetary scale, and then combined this with remote-sensing data for near real-time customized quantification of vegetation change. We demonstrate how new cloud-based geo-computational technology can be used to temporally, geographically and adaptively filter data collections.
Input data
All data input for the Biophysical Monitoring and Evaluation Dashboard are opened and available data on the Google Earth Engine (GEE) that listed below,
- Enhanced Vegetation Index: The biophysical monitoring layer uses the Enhanced Vegetation Index (EVI) which is calculated using MODIS multispectral data (MOD13Q1) with a pixel resolution of 250 x 250m. The algorithm chooses the best available pixel value from all the acquisitions from the 16 day period. EVI is a measure of relative biomass and is particularly well-suited for high-biomass areas of the globe
- Tree canopy cover and Tree canopy height: The forest monitoring layer primarily uses annual forest cover time series data. This data is created using Tree Canopy Cover (TCC) and Tree Canopy Height (TCH) layers, which was collated and delivered by the Global Land Analysis & Discovery of University of Maryland (GLAD/UMD) team for the Mekong region (Potapov et al. 2019). The data was taken from time-series analysis of Landsat images characterizing forest extent and change. Using Food and Agriculture Organization (FAO) forest definition with TCC is equal or greater than 10% and TCH is higher or equal 5m, and the minimum mapping unit is 0.5ha.
- 'Forest loss' is defined as a stand-replacement disturbance, or a change from a forest to non-forest state, during the period 2000-2019.
- 'Forest cover gain' is defined as the inverse of loss, or a non-forest to forest change entirely within the period 2000-2019.
- Forest alert: The forest alert layer uses the GLAD Alert product from UMD, based on the definition of ‘forest’ being - ‘5-m tall trees with a canopy closure exceeding 30%’. An alert is defined as any Landsat pixel that experiences a canopy loss in excess of 50% cover. The alert system is designed to complement a current annual global forest cover loss product that is based on a calendar year update.
- Forest alert from the SAR Alert System (SARAS): is a near real time forest alert system using Synthetic Aperture Radar (SAR) the Sentinel-1 satellite image. The system relies on the newest technologies in the field of cloud computing and deep learning classification to identify forest disturbance and deforestation.
- Forest fire: The information shows the active fire / hotspot of the Fire Information for Resource Management System (FIRMS). This system was developed to provide near real-time active fire locations to natural resource managers that faced challenges obtaining timely satellite-derived fire information. Data displayed in this tool is the Earth Engine version of the Fire Information for Resource Management System (FIRMS) dataset containing the LANCE fire detection product in rasterized form. The near real-time (NRT) active fire locations are processed by LANCE using the standard MODIS MOD14/MYD14 Fire and Thermal Anomalies product. Pixel displayed as a fire hotspot in this tool achieves 90% confidence of the LANCE fire detection model.
- The Cambodia national Land Cover time series (2000 - 2020) was developed through a collaborative effort led by SERVIR-Mekong using the Regional Land Cover Monitoring System approach (Saah et al. 2020). The maps were developed under the auspices of the REDD+ task team and the FCPF project in Cambodia to support the FREL. For this purpose, RLCMS was customized to meet Cambodia's land cover typologies. An uncertainty assessment was integrated in the assemblage process. These maps were developed using Landsat annual composites and training data collected by MOE.
Components of the Biophysical M&E Dashboard
The Biophysical Monitoring and Evaluation (M&E) Dashboard tools has four components which provides information related to change of biophysical condition and the change of forest cover on the ground, that indicated the area of improved or degraded biophysical condition in the project area; and Annual area of deforestation (ha) and/or reforestation (ha) as the M&E indicator of USAID project requirements. Four components of the tool included: Biophysical monitoring; Forest monitoring, Forest alerts, and Fire monitoring as in the Figure 4 below.

Figure 4. The tool structure and data inputs
Biophysical monitoring
The Biophysical monitoring component provide information about the change of biophysical productivity of the landscape – scale, uses the Enhanced Vegetation Index (EVI), which was calculated using MODIS multispectral data (MOD13Q1) with a pixel resolution of 250 x 250m. The algorithm chooses the best available pixel value from all the acquisitions from the 16-day period. EVI is a measure of relative biomass and is particularly well-suited for high-biomass areas of the globe
The map result was obtained by calculating the difference between vegetation growth (positive trend) and vegetation decline (negative trend) over any given area according to the baseline and evaluation period. Negative numbers indicate a net negative trend whereas positive numbers indicate net greening. By tracking changes of the Enhanced Vegetation Index (EVI) user can track the performance of landscape-scale efforts to maintain biological productivity.
A time series of Cambodia national land cover map from 2000 – 2020 is included in this component, that helps users to track the change of vegetation productivity with the land cover change during the evaluation period quantitatively.
Forest monitoring
The forest monitoring component provides information about the annual forest cover and forest cover change during the evaluation period. The map of annual forest cover and map of forest gain and loss during the evaluation period was created using the annual layers of Tree Canopy Cover (TCC) and Tree Canopy Height (TCH) from GLAD lab of University of Maryland (UMD) for Mekong region, using Landsat data with the forest definition of FAO (10% of TCC and TCH above 5m). In this component, users can access a time series data set of annual forest cover and forest cover change, with total area of forest gain and loss comparison between baseline and evaluation period. These data can help users to track the result of the landscape enhancement activities, and provide quantitative information about the area of forest change.
Forest alert
The forest alert component provides information about map of forest disturbance alerts with both SAR alert and GLAD alert data by year. SAR Alert system is developed using Sentinel-1 data applied deep learning method in TensorFlow. The system is operated as part of the Cambodia Protected Area Monitoring Platform (PAMP) which can monitor near real-time forest changes and external threats including deforestation, forest fires and floods within the extended Prey Lang Wildlife Sanctuary. Which integrates ground-based and remotely sensed data to improve the efficiency and effectiveness of law enforcement and conservation activities.
Fire hotspot
The Fire hotspot component provides information and a map of fire hotspots of the defined area or landscape by year. The information shows the active fire / hotspot of the Fire Information for Resource Management System (FIRMS) data. This system was developed to provide near real-time active fire locations to natural resource managers that faced challenges obtaining timely satellite-derived fire information.
Data displayed in this tool is the Earth Engine version of the Fire Information for Resource Management System (FIRMS) dataset containing the LANCE fire detection product in rasterized form.
Steps to access the Biophysical Monitoring and Evaluation data portal
This section will give instructions that users can follow all steps to interact with the tool to display the data and export information as reports for M&E purposes.
To start using the tool, users will first see the Quick guide window popup with a summary of four main steps to work with the Biophysical M&E Dashboard tool, and a link to the video demonstration on how to use the tool.
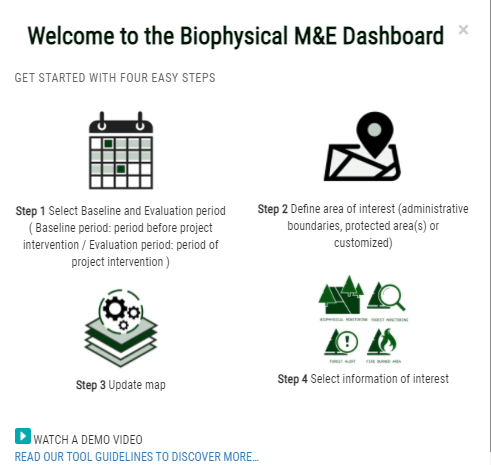

Figure 5. Quick guide panel
1. Select Baseline and Evaluation period (Baseline period: period before project intervention and Evaluation period: The period of project intervention)
2. Define area of interest
3. Update map
4. Select information of interest
5. Watch a demo video
Overall interface and front end design of the tool is displayed in the figure below.
- Dashboard control: to setup the requirements for monitoring and evaluation (period and place) that user need to explore the information
- Components panel: Where user can choose component to
- Information panel : Display list of layers and information which correspondent with the component. User can turn on and off layers to be displayed, and export result in data format or report in PDF format.
- Map display : Main screen to display map of visualized layers at selected AOI and defined period.
- Legend: Display the legend of the visualized layers
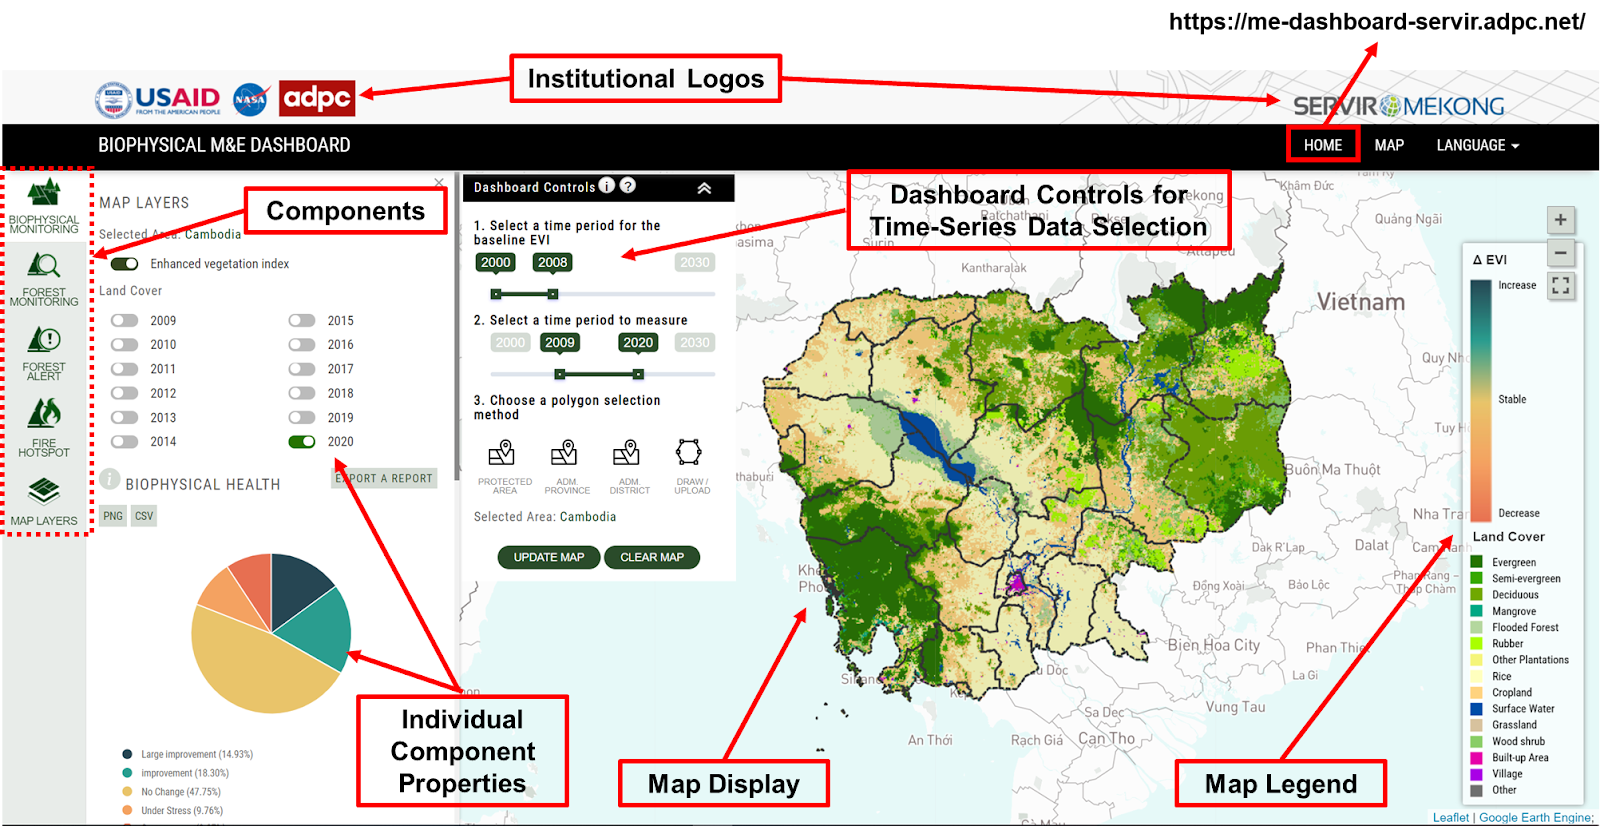
Figure 6. General interface of the tool
4.1. Dashboard control
The tool allows users to monitor and evaluate the change of the biophysical condition using the vegetation monitoring framework which is applicable at a regional and landscape scale, and is based on the BACI (Before-After, Control-Impact) design.
Users use the Dashboard control to set up the period and area to get information for monitoring. On the Dashboard control panel, users can define:
- The baseline period is the period before project intervention, the number of years should be similar to the number of evaluation periods, which is the evaluation period below.
- The evaluation period is the period of project intervention, which is the number of years of project implementation and operation.
- Define area of interest. The Area of Interest (AOI) will identify areas for data calculations in all components of the tool. Users can identify areas of interest by selecting administrative boundaries (province or district), by selecting protected areas or customize their own area of interest by drawing polygons or uploading the boundaries from their computer.
Figures bellows will guide you step by step to setup and interact with the Dashboard control
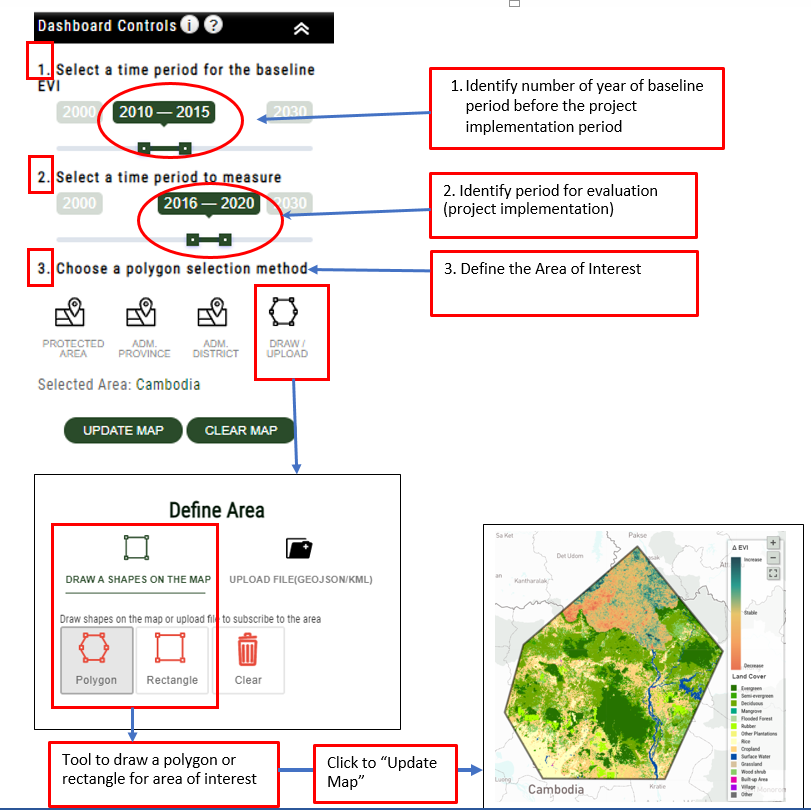
Figure 7. The Dashboard control
To customize the area of interest, users can choose options to draw polygon, rectangle or uploading the existing boundaries from their computer in the format of KML or GEOJSON
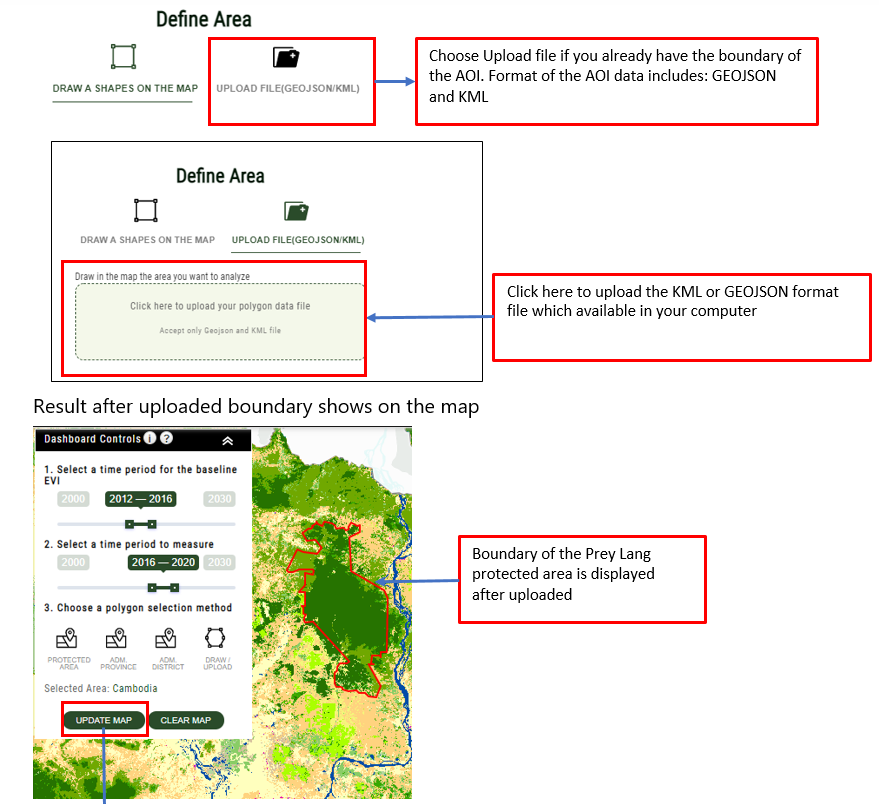

Figure 8. Users can customize the Area of interest
4.2. Component panel
4.2.1 Biophysical monitoring
The Biophysical monitoring component, provides information about the change of the biophysical value between the baseline period and the evaluation period by showing the change of cumulative anomaly value of Enhanced Vegetation Index (EVI) in the area of interest.
Beside the change of EVI, users can also see and access the annual Cambodia national land cover map by years which was indicated in the evaluation period. User can turn on and off the layers to see the land cover change which was associated with the change of EVI value in that period.
Figure below explain about available functions of each component, follow the number to interact with the tool.


Figure 9. Biophysical monitoring component
- 1 - Turn on and off the button to display the layer of biophysical change which is the change of Enhanced Vegetation Index due to comparison between baseline period and evaluation period.
- 2 - Turn on and off the button to display the layers of Cambodia land cover map by year
- 3- Display the Information about the Biophysical health layer
- 4 - To export the monitoring report in PDF format
- 5- The map of biophysical condition change which is calculated based on the change of EVI data between the evaluation period and baseline period.
- 6 – legend of the Biophysical condition change layer, where darker green means increased of the biophysical condition and darker read means decreased of biophysical condition
- 7- Download data: Click the download button on each year in the panel to save the data which is displayed on the map in image format (TIF file). User will be asked to save the Metadata.csv file, and the Data file in Zip format. Data received has a resolution of 100m.
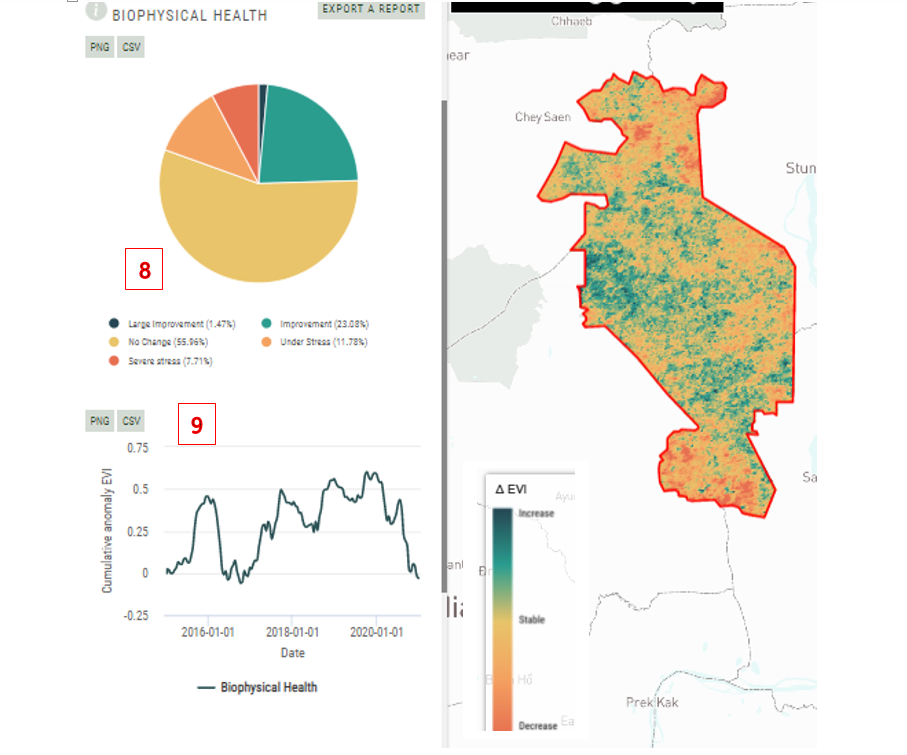
Figure 10. Map and charts of Biophysical change
- 8 - Pie chart to show percentage of area that was categorized based on the condition of the vegetation health (biophysical condition) during the evaluation period. 5 categories of change include: Large improvement; Improvement, No change; Under stress; Severe stress.
These data and chart can be downloaded for report in the CSV format and pie chart in picture format (PNG)

- 9: The line chart shows the trend of biophysical condition change during the evaluation period, calculated under the AOI area. Value is the average of cumulative EVI anomaly for all pixels in the AOI area. These data of the chart can be downloaded for reporting in the CSV format and chart in picture format (PNG)
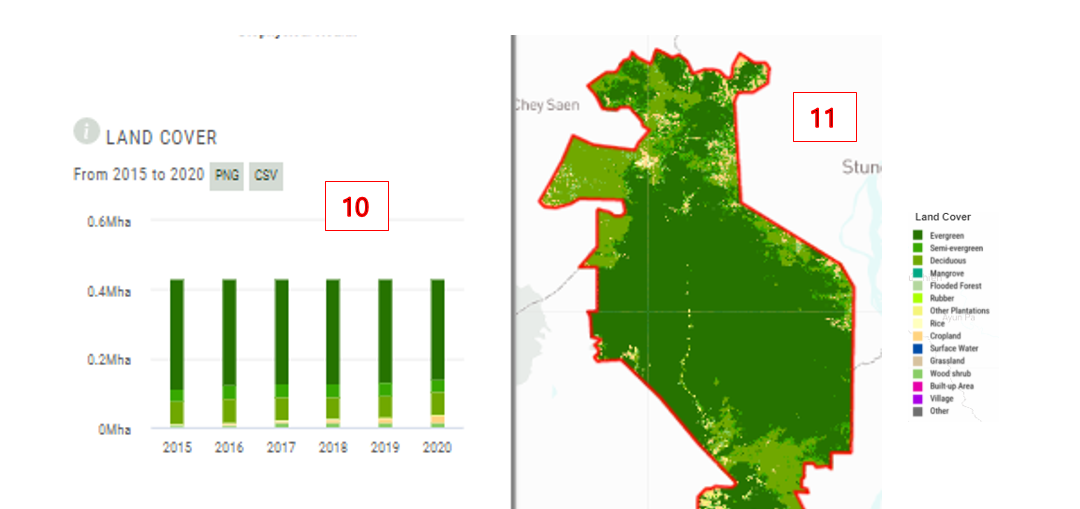
Figure 11. Map and charts of Land cover change
- 10 – Column chart shows the change of land cover types over the evaluation period.

Click to CSV to download the table of change area of each land cover types in the GPL boundary and PNG to download the graphic of the chart
- 11 –Display map of land cover by selected year and the legend of land cover categories (according to the Cambodia national land cover map)
4.2.2. Forest monitoring
The forest monitoring component provides information about forest change at the selected area of interest by the evaluation period. Figure 12 below explains the available information that users can explore and extract from the tool.

Figure 12. The forest monitoring component

- Turn on and off the button to display layers of forest gain and forest loss during the evaluation period for selected areas.
- Map area showing the layers which was selected to be displayed on the information panel (area of forest gain and loss over the evaluation period and forest cover by year)
- Turn on and off the button to display the forest cover by year of the evaluation period.
- Download data: Click the button to download the data of forest cover and forest gain and loss available in the information panel. download data is in image format (TIF file). Users will be asked to save the Metadata.csv file, and the Data file in Zip format. Data received has a resolution of 100m.
- The column chart showing area (in million hectare) of forest cover by year during the evaluation period by the selected area of interest.

Figure 13. Map and chart in forest monitoring panel
- 6. The chart shows the area in hectares of forest (green) and non- forest (Grey) categories by year in the evaluation period. Click to CSV to download the data of the chart, and download the picture of the chart by click to PNG button
- 7. The chart shows the Change of total area in hectares of forest gain and forest loss, as the difference between the baseline period and evaluation period. The difference in area of forest gain and forest loss in between 2 periods can explain the improvement of the forest monitoring ability on the ground.
All information and map that displayed on the screen can be exported to a template report by click to “Export a Report”
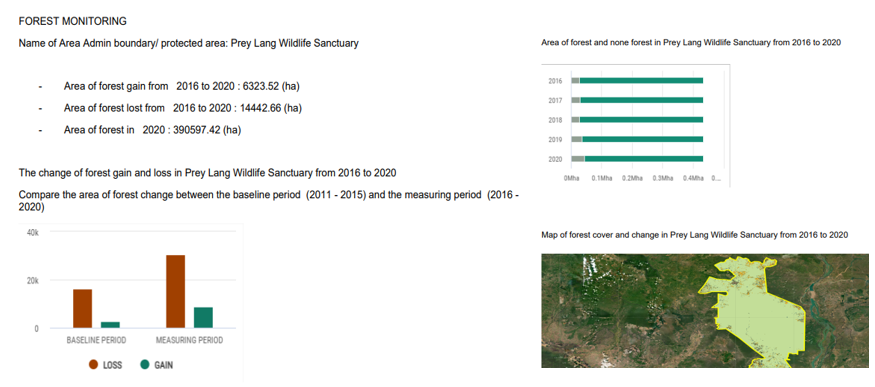
Figure 14. Exported report of forest monitoring component
4.2.3. Forest Alerts
The Forest alert component shows the location and total area of forest disturbance or deforestation area by year. The component included forest alerts from two systems which included GLAD Alert (alert derived by Landsat image) and SAR Alert (forest alert derived by SAR Sentinel 1 image). Figure 15 below explains the available information and data and interaction with the forest alert component.

Figure 15. The forest alert component
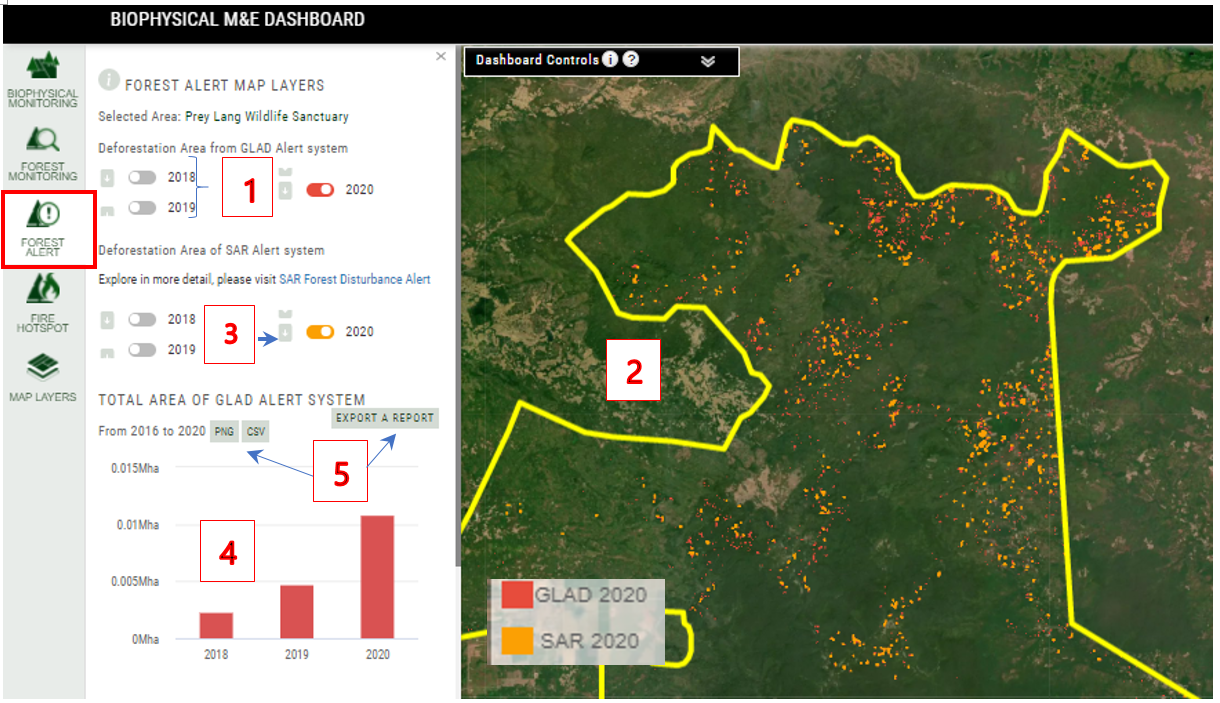
- 1. Turn on and off the button to display the layer of deforestation alert by year, Forest alerts data was generated by the GLAD system and SAR alert system. Alert area is compiled annually. Please note that data of the GLAD alert system and SAR alert system are only available from 2018 until now
- 2. Map displayed the forest disturbance alerts by year from GLAD and SAR Alert system
- 3. Download data: Click to download button to get images of forest alert
- 4. Column chart showing the total deforestation area has been recorded each year with the GLAD system and SAR Alert system. This information can inform the speed of deforestation in each AOI over the year.
- 5. Data can be exported to CSV format and the map of Alert distribution can be exported to PDF format (click and save the file as shown below.


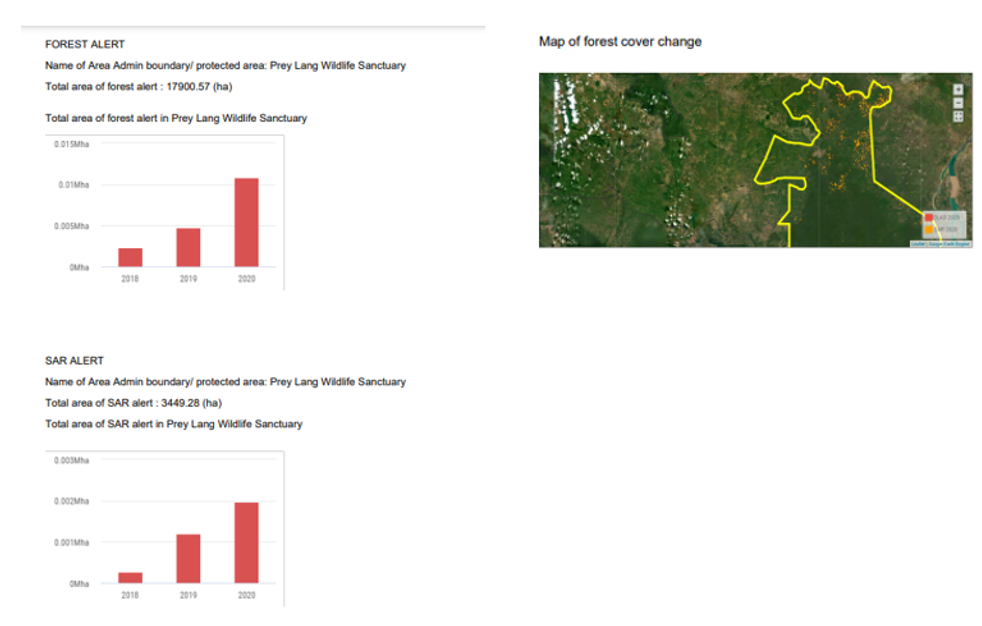
Figure 16. The exported report of forest alerts
The SAR alert system allows users to access the App Engine platform to export the near real time forest disturbance and deforestation by identifying dates and areas that could be used for the validation process.
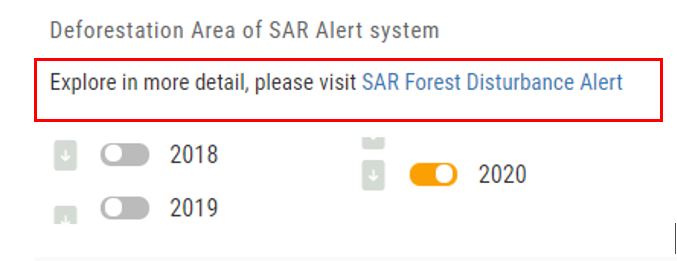
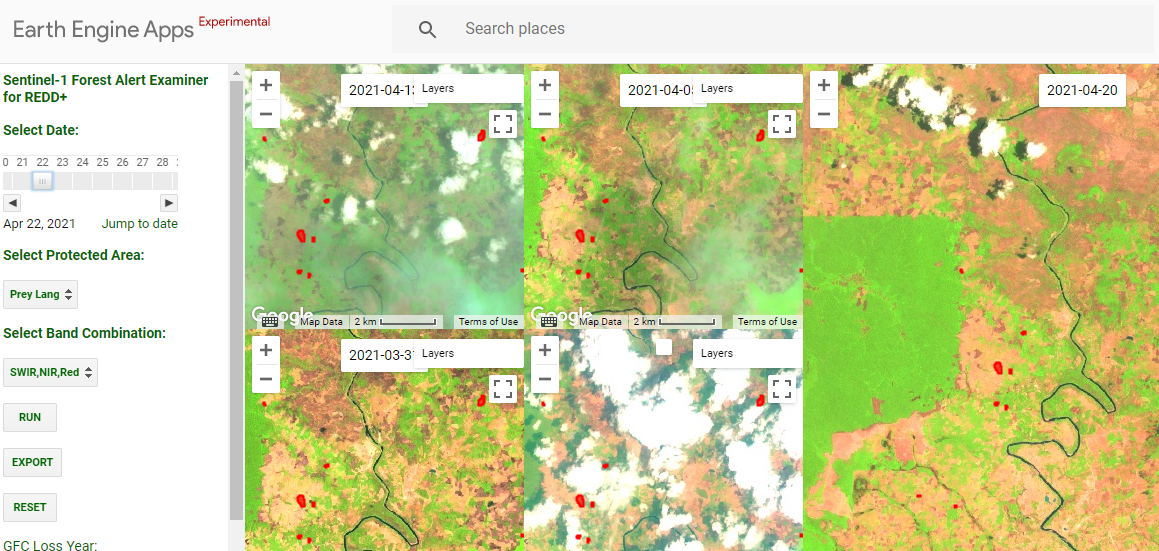
Figure 17. The Sentinel -1 forest alert examiner for REDD+
4.2.4. Fire hotspot
The fire hotspot component provides information and a map of fire hotspots of the defined area or landscape by year. Figure below explains the available information on the component and interact with the tool

Figure 18. The Fire hotspot component panel

- 1. Turn on and off the button to display the layers of fire hotspot distribution in each year in the evaluation period.
- 2. Summary total number of fire hotspots was detected by year and displayed in the column chart.
- 3. Data about the number of fire hotspot detection can be exported to CSV format and the map of fire hotspot distribution can be exported to PDF format (click Export a Report and save the file.
- 4. Download data layer of fire alert by year: Click to download button to get images of fire hotspots, the image resolution is 100m
- Provide information about data sources and reference information related to the fire hotspot layer

4.2.5. Other map layers
In this tool, users can also display other GIS layers such as infrastructures, road networks, and community forest management to help better understand the change of biophysical condition on the ground for better visualization and interpretation of information provided by the Biophysical M&E Dashboard tool. Figure 19 below explains about the available GIS layers in this component.
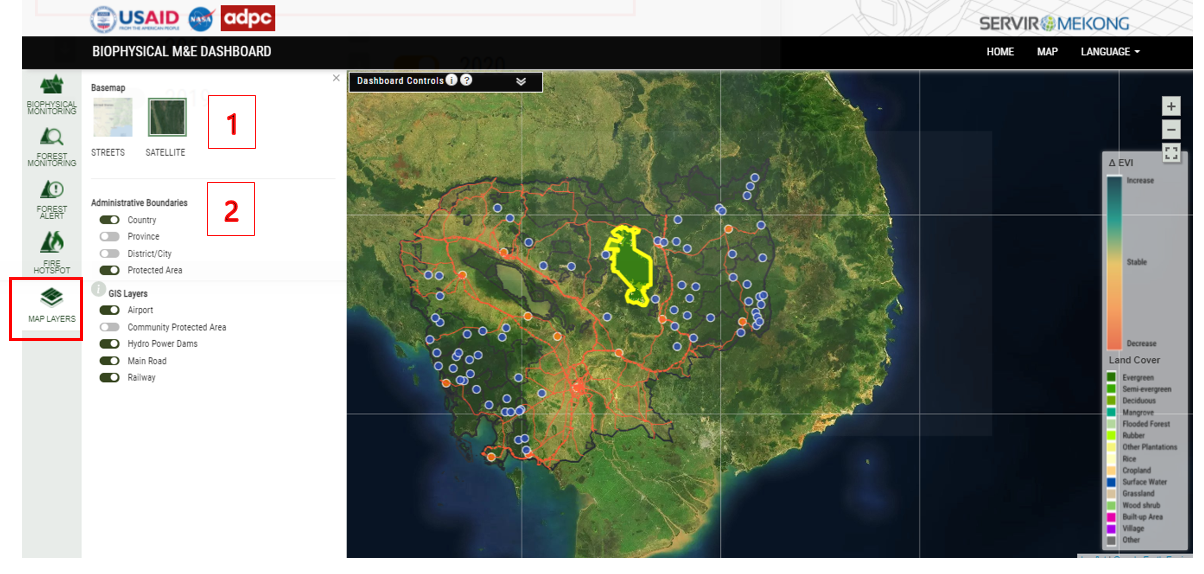
Figure 19. Other Map layers
This part of the tool consists of 2 main content
- 1. Option to change the background of the map into Base map or satellite image
- 2. List of additional available GIS layers in Cambodia, which included: administrative levels in Cambodia; infrastructure system such as airports, main road, railway and hydropower dams. Move the mouse over the object to see more detailed Information of that object.
Annex 1. Information about data uses in the tool
Biophysical Monitoring layer
- Overview: The biophysical monitoring layer uses the Enhanced Vegetation Index (EVI) which is calculated using MODIS multispectral data (MOD13Q1) with a pixel resolution of 250 x 250m. The algorithm chooses the best available pixel value from all the acquisitions from the 16 day period. EVI is a measure of relative biomass and is particularly well-suited for high-biomass areas of the globe.
- Resolution: 250m
- Geographic Coverage: Greater Mekong region
- Data Source: https://lpdaac.usgs.gov/products/mod13q1v006/
- Frequency updates: 16 days
- URL link to tool: http://ecodash-servir.adpc.net/
Forest Monitoring layer
- Overview: The forest monitoring layer primarily uses annual forest cover time series data. This data is created using Tree Canopy Cover (TCC) and Tree Canopy Height (TCH) layers, which was collated and delivered by the Global Land Analysis & Discovery of University of Maryland (GLAD/UMD) team for the Mekong region (Potapov et al. 2019). The data was taken from time-series analysis of Landsat images characterizing forest extent and change. Using Food and Agriculture Organization (FAO) forest definition with TCC is equal or greater than 10% and TCH is higher or equal 5m, and the minimum mapping unit is 0.5ha.
- 'Forest loss' is defined as a stand-replacement disturbance, or a change from a forest to non-forest state, during the period 2000-2019.
- 'Forest cover gain' is defined as the inverse of loss, or a non-forest to forest change entirely within the period 2000-2019.
- Resolution: 30m
- Geographic Coverage: Greater Mekong region
- Data Source: https://www.landcovermapping.org/en/about/
- Frequency updates: Annually
- URL link to tool : https://www.landcovermapping.org/en/forest-monitor/
Forest Alert
- Overview: The forest alert layer uses the GLAD Alert product from UMD, based on the definition of ‘forest’ being - ‘5-m tall trees with a canopy closure exceeding 30%’. An alert is defined as any Landsat pixel that experiences a canopy loss in excess of 50% cover. The alert system is designed to complement a current annual global forest cover loss product that is based on a calendar year update, first prototyped using Landsat-7 data (2000-2019), annually updated thereafter. Source: http://www.globalforestwatch.org/ and http://earthenginepartners.appspot.com/science-2013-global-forest.
Included in this system, the SAR Alert System (SARAS) is a near real time forest alert system using Synthetic Aperture Radar (SAR). The system is developed by SERVIR-Mekong in partnership with the USAID Greening Prey Lang Project and the Applied Science Team from Oregon State University. The system relies on the newest technologies in the field of cloud computing and artificial intelligence.
- Resolution: 30-m
- Geographic Coverage: Global
- Data Source: https://glad.umd.edu/dataset/glad-forest-alerts
- Frequency updates: 16 days
- URL link to tool : https://www.globalforestwatch.org/map/
Fires Hotspot
- Overview: The information shows the active fire / hotspot of the Fire Information for Resource Management System (FIRMS). This system was developed to provide near real-time active fire locations to natural resource managers that faced challenges obtaining timely satellite-derived fire information.
Data displayed in this tool is the Earth Engine version of the Fire Information for Resource Management System (FIRMS) dataset containing the LANCE fire detection product in rasterized form. The near real-time (NRT) active fire locations are processed by LANCE using the standard MODIS MOD14/MYD14 Fire and Thermal Anomalies product. Pixel displayed as a fire hotspot in this tool achieves 90% confidence of the LANCE fire detection model.
- Resolution: 1000-m
- Geographic Coverage: Global
- Data Source: https://earthdata.nasa.gov/earth-observation-data/near-real-time/firms
- Frequency updates: NASA's Fire Information for Resource Management System (FIRMS) distributes Near Real-Time (NRT) active fire data within 3 hours
- URL link to tool: https://firms.modaps.eosdis.nasa.gov/
Land Cover
- Overview: The Cambodia national Land Cover time series (2000 - 2020) was developed through a collaborative effort led by SERVIR-Mekong using the Regional Land Cover Monitoring System approach (Saah et al. 2020). The maps were developed under the auspices of the REDD+ task team and the FCPF project in Cambodia to support the FREL. For this purpose, RLCMS was customized to meet Cambodia's land cover typologies. An uncertainty assessment was integrated in the assemblage process. These maps were developed using Landsat annual composites and training data collected by MOE.
- Resolution: 30m
- Geographic Coverage: Cambodia
- Data Source: USGS Landsat 8 Surface Reflectance Tier 1
- Frequency updates: Annually
- URL link to tool: https://landcovermapping.org/
Additional GIS Layers.
Cambodia Protected Area
- Published by: Cambodia Ministry of Environment
- This dataset contains data of boundary of protected areas in Cambodia with issuing dates starting from 1993 to 2020. The data was collected from government agencies and provided to SERVIR-Mekong by USAID mission in Cambodia. Geographic data is encoded in the WGS 84, Zone 48 North coordinate reference system.
Cambodia Airports
- Published by: Open Development Cambodia
- This dataset shows the point location of airports both international and national airports in Cambodia. The points also have additional information including attributes (name, type, ICAO and IATA code). The data was extracted from Open Flights database via Environment Operations Centre.
- URL link to data source: https://data.opendevelopmentcambodia.net/en/dataset/airports-of-cambodia
Community protected areas in Cambodia (2006-2019)
Published by: Open Development Cambodia
- Published by: Open Development Cambodia
- This dataset contains data of community zones in the natural protected areas such as the national park, biodiversity conservation corridor, wildlife sanctuary, and protected landscape with issuing dates starting from 2006 to 2019. Due to the lack of publicly available spatial information on zoning and degazettement, a number of community zones are represented in pin-points on the map. The data was collected from government agencies in hardcopy and PDF format and manually digitized. Geographic data is encoded in the WGS 84, Zone 48 North coordinate reference system.
- URL link to data source: https://data.opendevelopmentcambodia.net/en/dataset/community-protected-areas-2006-2019
Hydropower dams in Cambodia (1993-2014)
- Published by: Open Development Cambodia
- This dataset describes the information of transmission lines for each of Cambodia’s province from 1993 to 2014. The data was collected from many sources by ODC’s mappers such as government agency, and final reports of Electricité du Cambodge (EDC) in pdf format. Geographic data is encoded in the WGS 84, Zone 48 North coordinate reference system.
- URL link to data source: https://data.opendevelopmentmekong.net/en/dataset/hydropower-2009-2014?type=dataset
Road and railway networks in Cambodia (2012- 2020)
- Published by: Open Development Cambodia
- Road networks are produced by Open Street Map. ODC's map and data team extracted the data in vector format. Moreover, the polyline data of railway given by Save Cambodia's Wildlife's Atlas Working Group in Cambodia for two statuses such as existing, proposed new lines in Cambodia.
- URL link to data source: https://data.opendevelopmentmekong.net/en/dataset/road-and-railway-networks--in-cambodia?type=dataset
References
- Carpenter, S.R.; Frost, T.M.; Heisey, D.; Kratz, T.K. Randomized intervention analysis and the interpretation of whole-ecosystem experiments. Ecology 1989, 70, 1142–1152.
- Conner, M.M.; Saunders, W.C.; Bouwes, N.; Jordan, C. Evaluating impacts using a BACI design, ratios, and a Bayesian approach with a focus on restoration. Environ. Monit. Assess. 2016, 188, 555.
- Conquest, L.L. Analysis and interpretation of ecological field data using BACI designs: Discussion. J. Agric. Biol. Environ. Stat. 2000, 5, 293–296.
- Didan, K.; Huete, A. MODIS Vegetation Index Product Series Collection 5 Change Summary; TBRS Lab, The University of Arizona: Tucson, AZ, USA, 2006
- Gorelick, N.; Hancher, M.; Dixon, M.; Ilyushchenko, S.; Thau, D.; Moore, R. Google Earth Engine: Planetary-scale geospatial analysis for everyone. Remote Sens. Environ. 2017, 202, 18–2
- Poortinga, A.; Clinton, N.; Saah, D.; Cutter, P.; Chishtie, F.; Markert, K.N.; Anderson, E.R.; Troy, A.; Fenn, M.; Tran, L.H.; et al. An Operational Before-After-Control-Impact (BACI) Designed Platform for Vegetation Monitoring at Planetary Scale. Remote Sens. 2018, 10, 760.
- Smith, E.P.; Orvos, D.R.; Cairns, J., Jr. Impact assessment using the before-after-control-impact (BACI) model: Concerns and comments. Can. J. Fish. Aquat. Sci. 1993, 50, 627–637.
- Underwood, A. Beyond BACI: The detection of environmental impacts on populations in the real, but variable, world. J. Exp. Mar. Biol. Ecol. 1992, 161, 145–178.
- Upton, G.; Cook, I. A Dictionary of Statistics 3e; Oxford University Press: Oxford, UK, 2014.
