
Mekong X-ray
User Manual
Version 1.0
© 2022, SERVIR Mekong
ADPC - Asian Disaster Preparedness Center
SM Tower 979/66 70 Phahonyothin Rd
Bangkok, Thailand
INTRODUCTION
The Mekong X-Ray is an open-source web application for a multidimensional flood vulnerability assessment, including mapping physical, social, economic, and environmental dimensions to support flood risk management.
The tool translates big earth data by applying the state-of-art from Google Science and technologies such as Google Earth Engine (GEE), Google Data Analytics with Big Earth Data including Earth Observation, Social Networks, IoT and Miscellaneous data to flood vulnerability information across different spatial and temporal scales. The application aims to improve flood risk assessment and provide people with insightful information for better flood preparedness and response.
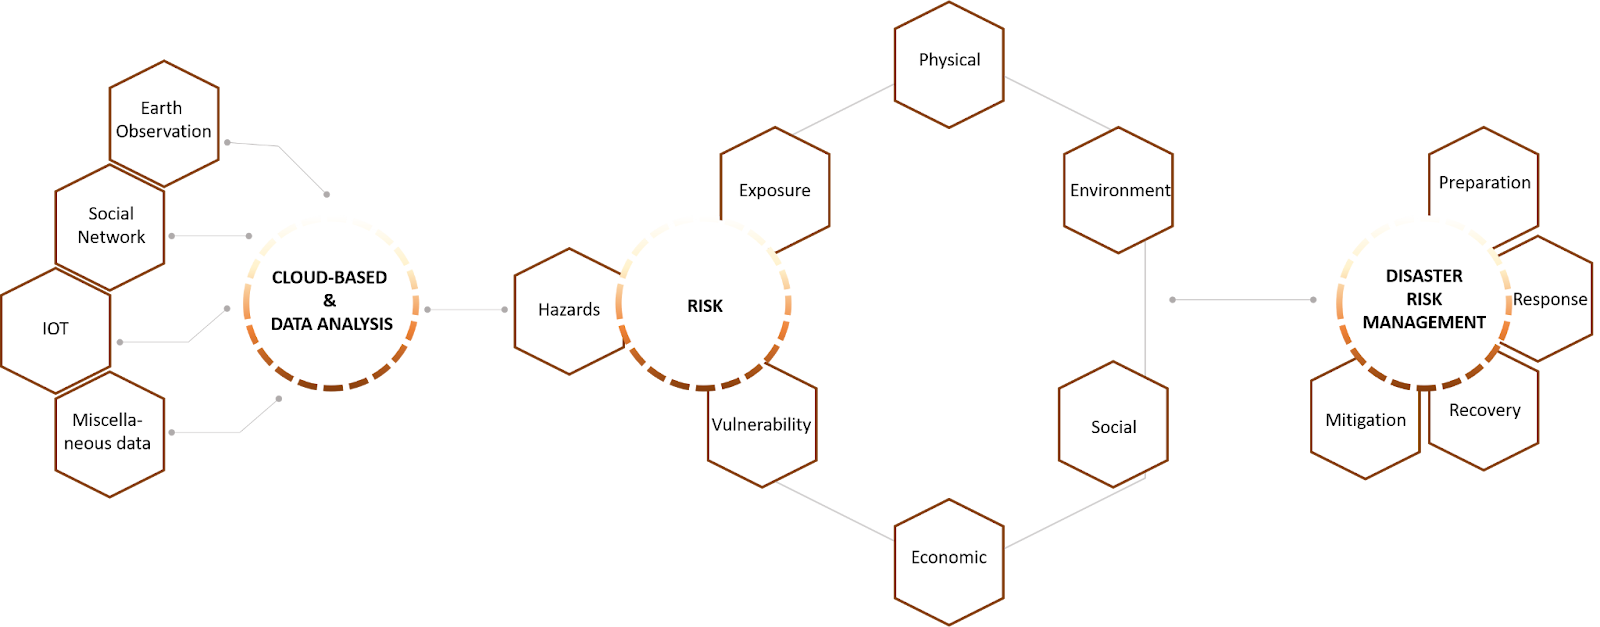
The application applied a conceptual framework for disaster management using big earth data and the different components of the disaster risk assessment framework. Big Earth Data has four components of earth observation, social networks, IoT and miscellaneous data for data collection. Various data sources can be used to feed this data into the risk components of hazard, exposure and vulnerability. The exposure component has the physical, environmental, social and economic components. The translation of data is done in the risk assessment part where the three components are calculated. This information can then be used in the disaster risk management cycle to support the decision-making throughout preparation, response, recovery and mitigation.
Overview of Web Portal
Home page
Interactive Map
Admin User Guide
1. Home page
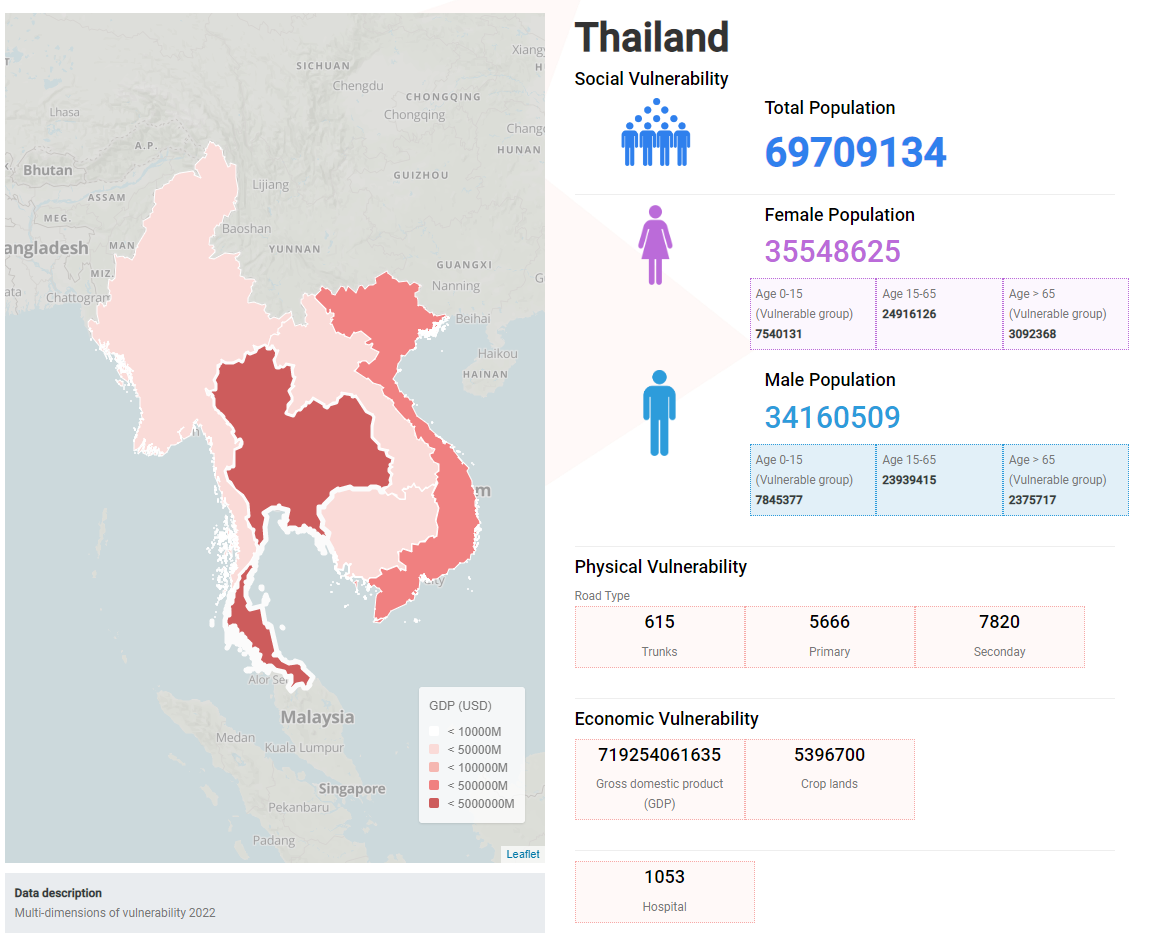
- Users can click on country boundary to see the detail of multi dimension of vulnerability, i.e., social vulnerability, physical vulnerability and economic vulnerability.
- Selecting one country on the map activates the infographic information on the right side of the page.
- Changing visualization by country level.
Vulnerability chart visualization
Interactive graph displaying vulnerability information in Mekong countries
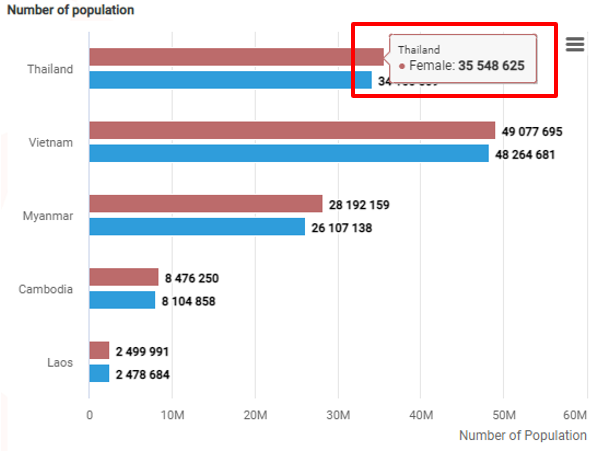
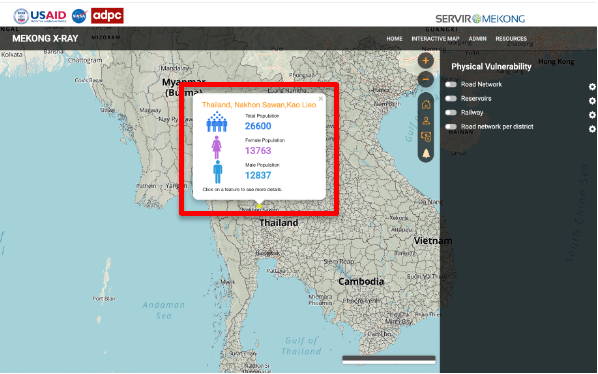
Number of population
- Popup details show the gender of population in the area where the cursor is pointing.
- You can switch to other areas by hovering your cursor.
- Chart’s area displays in a bar chart. Each bar chart shows a selected area.
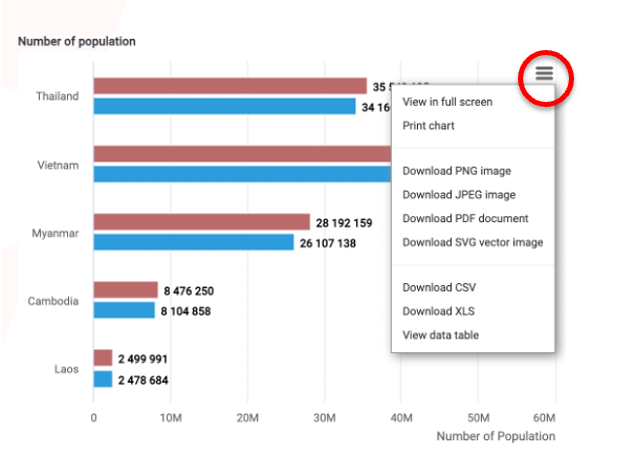
- After clicking at the chart’s menu, the list of options will be displayed. You can view it in full screen, print chart, download (PNG image, JPEG image, PDF document, SVG vector image, CSV and XLS) and view data in table.
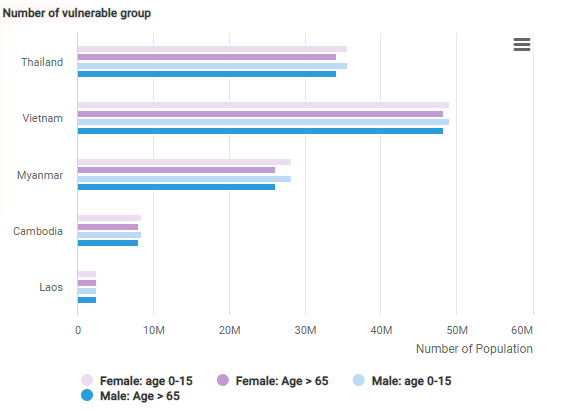
Number of vulnerable group
- Popup details show the vulnerable group (age 0-15 and age >65) by gender in the area where the cursor is pointing.
- You can switch to other areas by hovering your cursor.
- Chart’s area displays in a bar chart. Each bar chart shows a selected area.
- You can view it in full screen, print chart, download (PNG image, JPEG image, PDF document, SVG vector image, CSV and XLS) and view data in table.
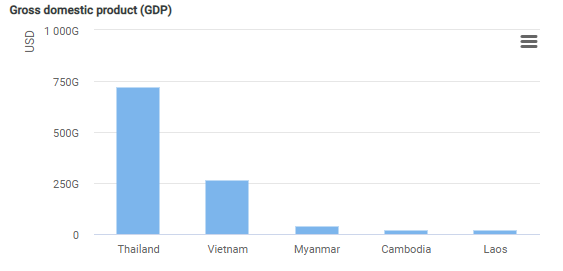
Gross domestic product (GDP)
- Popup details show GDP of Mekong countries in USD.
- You can view it in full screen, print chart, download (PNG image, JPEG image, PDF document, SVG vector image, CSV and XLS) and view data in table.
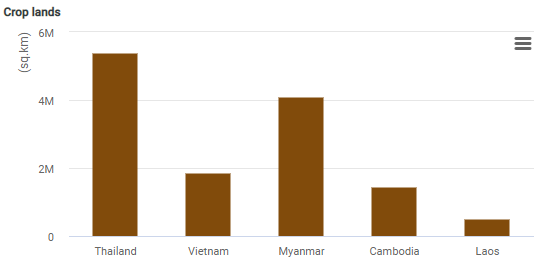
Crop lands
- Popup details show Crop lands of Mekong countries in square kilometer units.
- You can view it in full screen, print chart, download (PNG image, JPEG image, PDF document, SVG vector image, CSV and XLS) and view data in table.
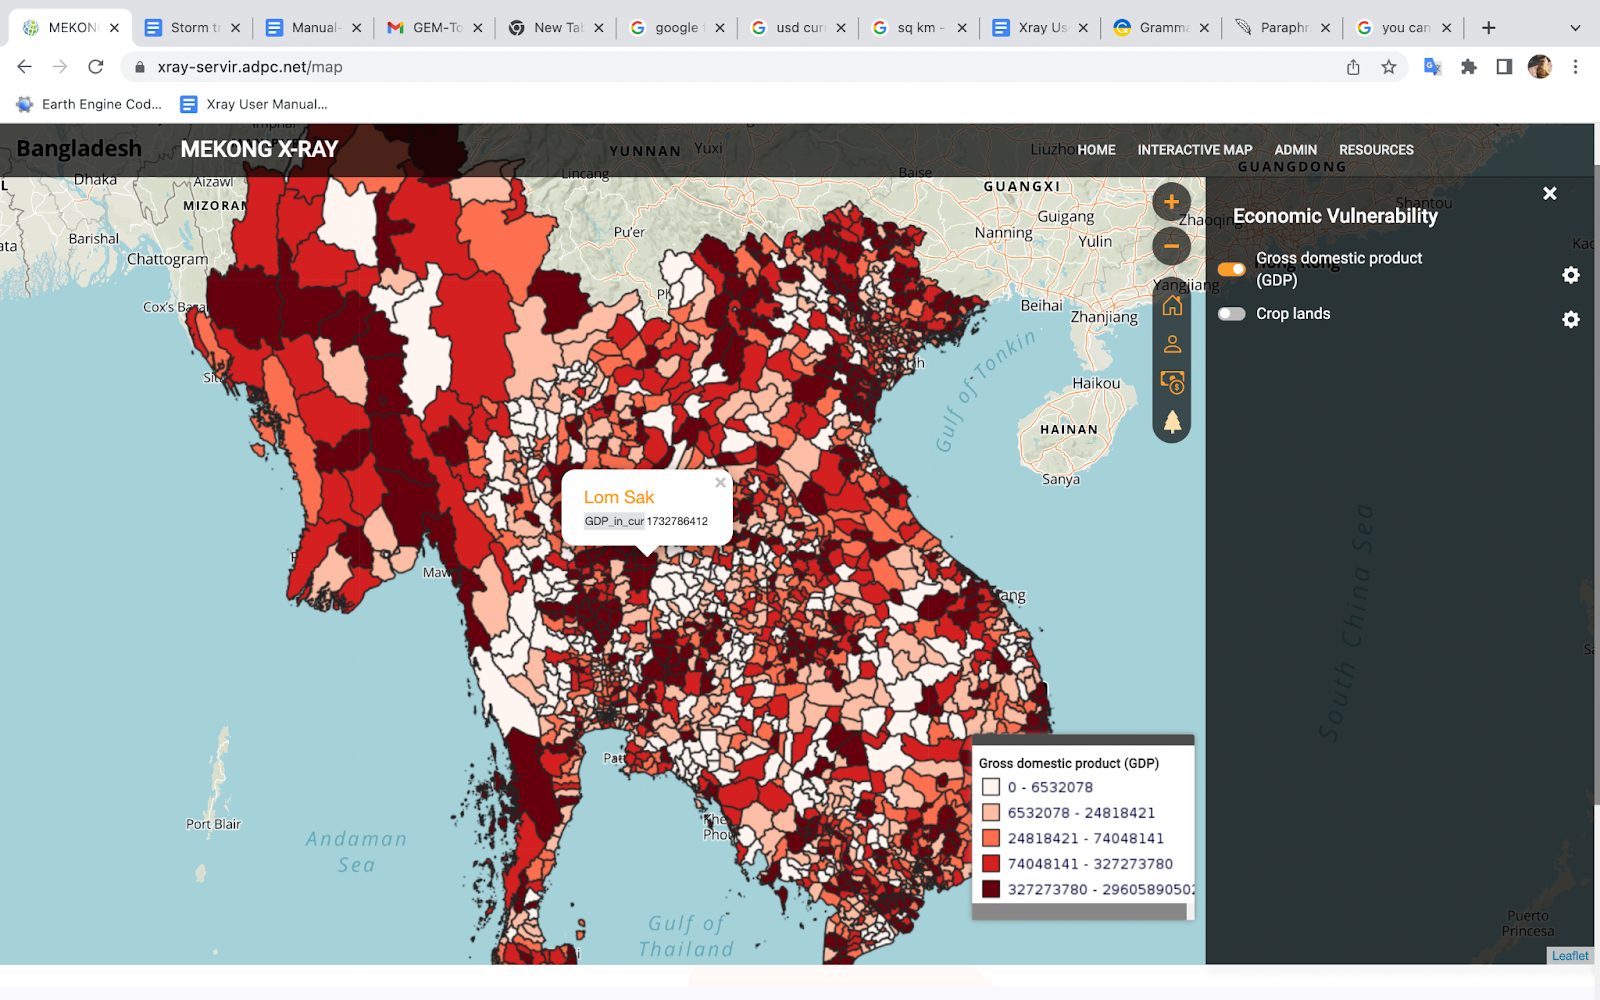
2. Interactive Map
The Mekong X-ray tool ‘s interface uses interactive maps to provide multidimensional vulnerability data within the Mekong countries, including mapping physical, social, economic, and environmental dimensions to support flood risk management. The data are divided into three main parts: Physical Vulnerability, Social Vulnerability, and Economic vulnerability. In the future, Environmental Vulnerability will be available on the Mekong X-ray tool.
Users can interact with maps and select data to be visualized.
In this section, users will find step-by-step instructions on how to use the tool to display and export information.
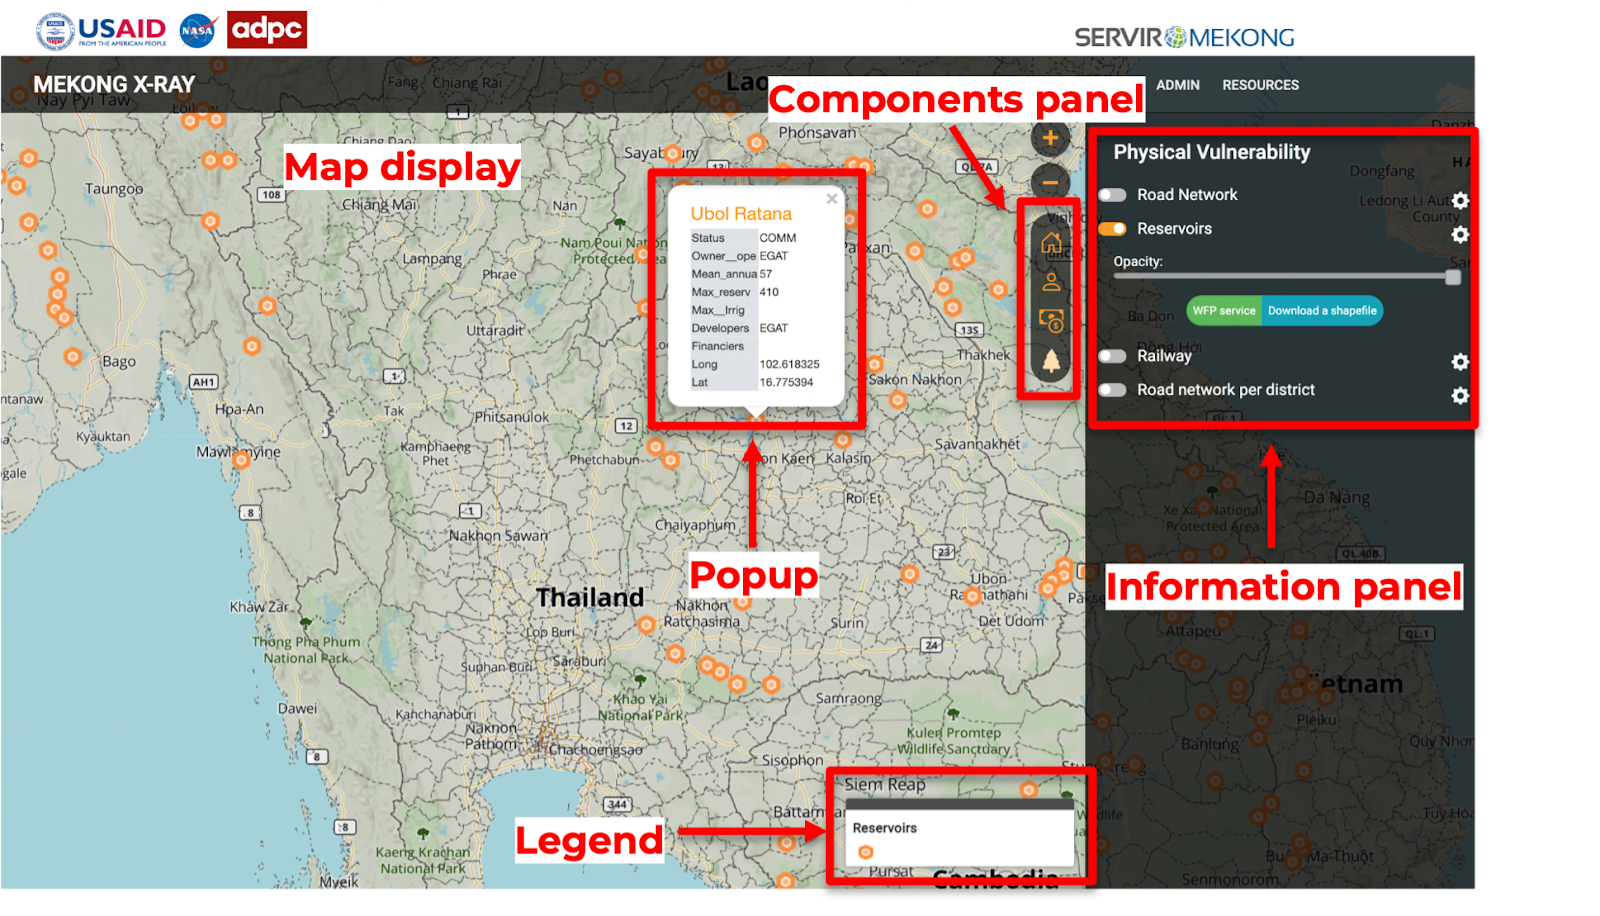
Overall interface of the tool is displayed in the figure below.
- Components panel: Where the user can select component for
- Information panel: Display list of layers and information which correspondent with the component. User can turn on and off layers to be displayed, adjust layer opacity and export information in data format.
- Map display: Main screen to display map of visualized layers at selected features.
- Popup: Show the details the information where the cursor is pointing.
- Legend: Display the legend of the visualized layers.
- To start using the tool, users will first see the main screen.
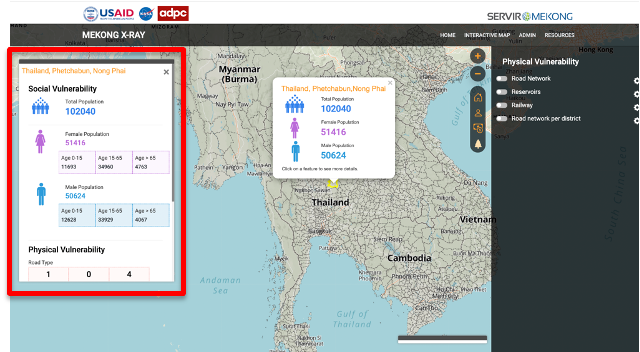
- Popup details show the vulnerability data in the district level where the cursor is pointing. You can switch to other areas by hovering your cursor.
- Users can see more details by clicking on the feature.
Component panel
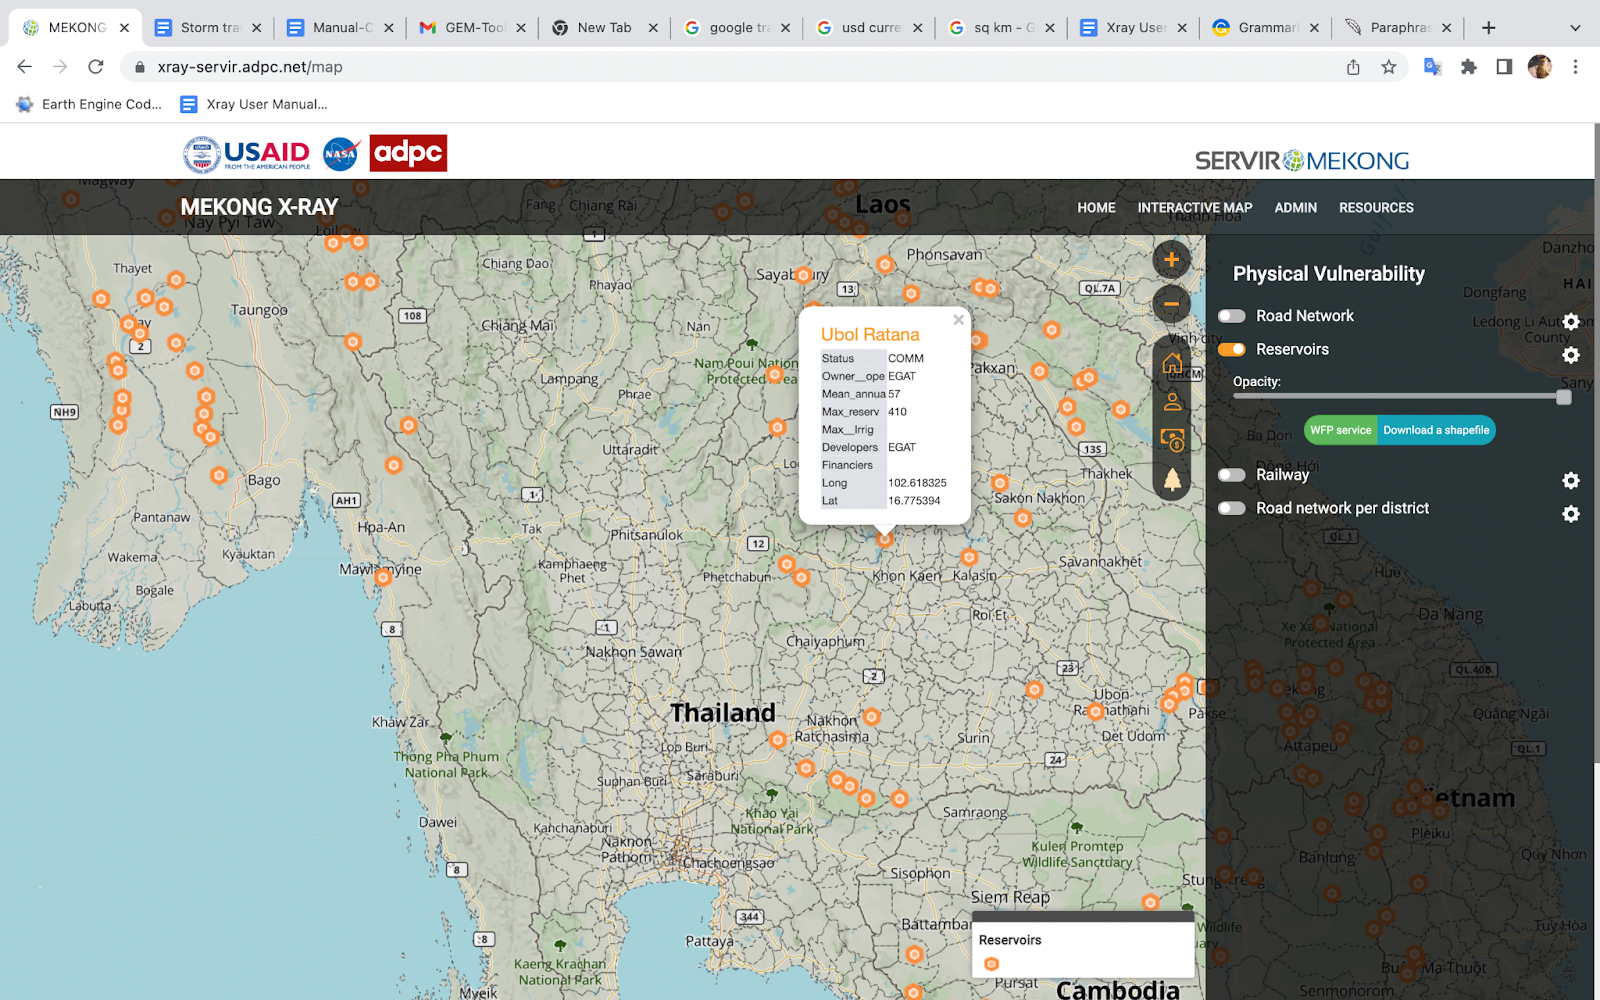
1. Physical Vulnerability
- Physical Vulnerability component provides information about physical vulnerability (Road Networks, reservoirs, railway and road network per district).
- Users can turn on and off the button to display the layer of physical. vulnerability. Main screen will display a map of visualized layers at selected features.
- Changing visualization by district level.
- By clicking on this button, user can adjust layer opacity and download data.

- To adjust layer opacity: Select the desired layer, then click the Opacity arrow at the Layers panel.
- Download data: Click to download button to get data in shapefile format or WFP service.
- Legends of the choropleth map is automatically adjusted to the selected data.
- By clicking on each label, user can visualize the details of each data in attributes.
- The details of attributes have been described in the table below.
Description of the field attributes
Road Network | |
Fclass | |
tunnel | |
bridge | |
Reservoirs | |
Status | Operation status |
Owner__ope | Owner operation |
Mean_annua | Mean annual |
Max_reserv | Max reservoirs |
Max__Irrig | Max irrigation |
Developers | |
Financiers | |
Long | Longitude |
Lat | Latitude |
Railway | |
bridge | |
tunnel | |
Road network per district | |
Primary | Primary road network |
Secondary | Secondary road network |
Trunks | |
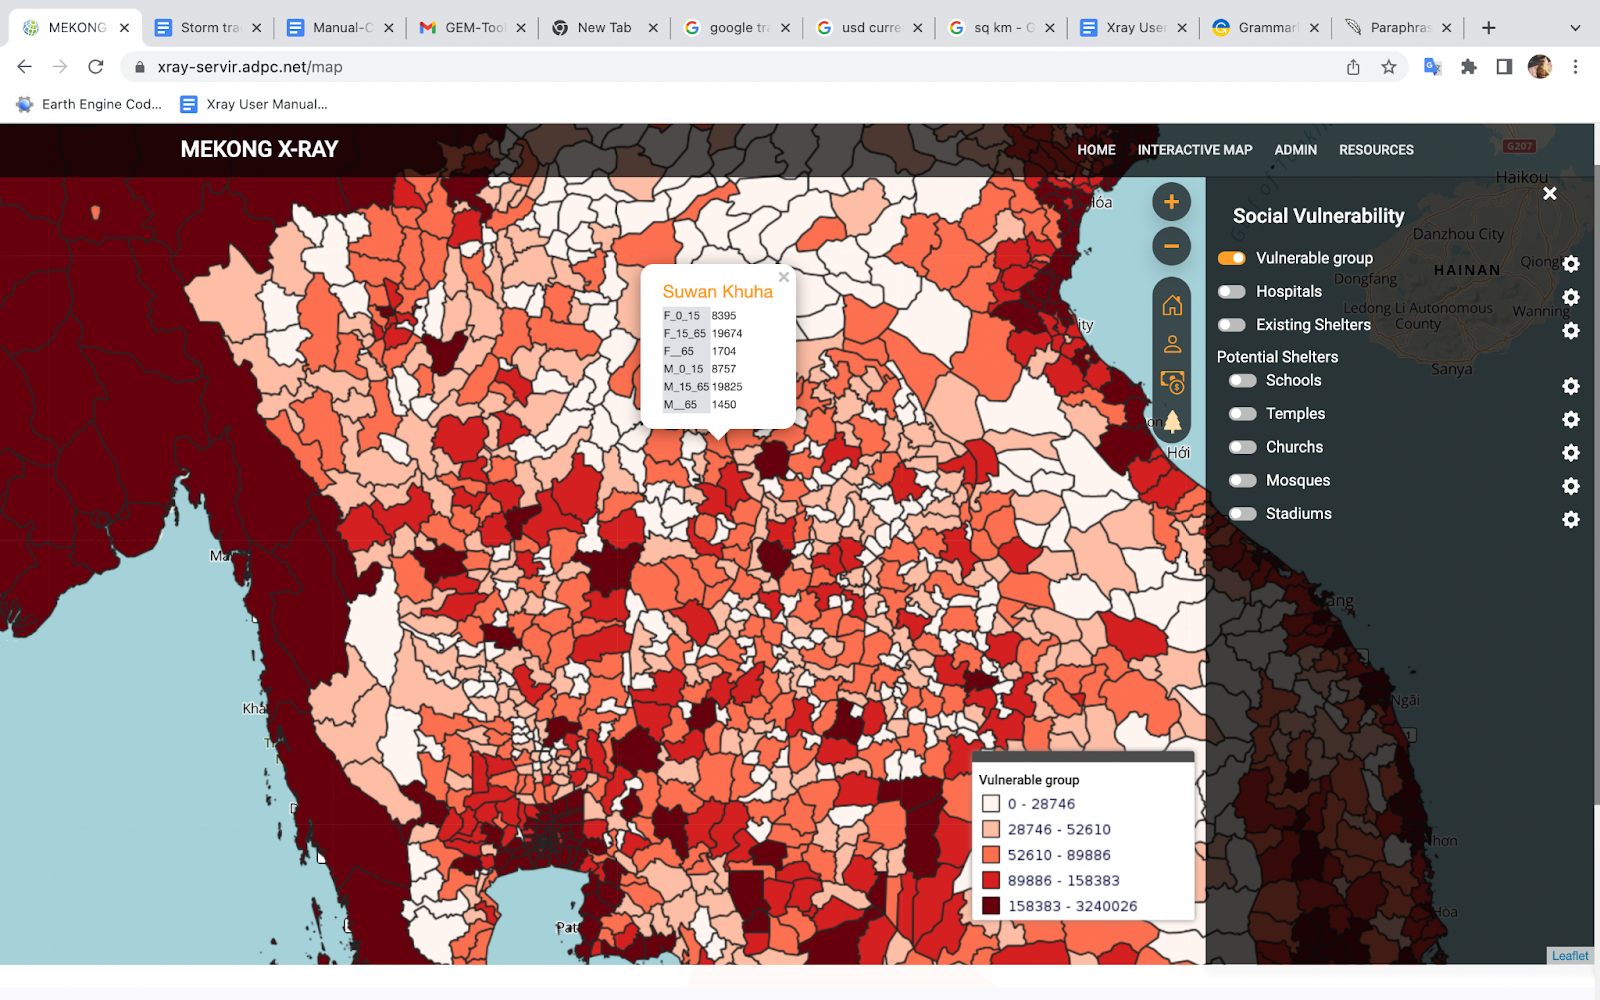
2. Social Vulnerability
- Social Vulnerable component, provides information about Social Vulnerability, including Vulnerable groups, Hospitals, Existing Shelters, and Potential shelters (Schools, Temples, Churches, Mosques, and Stadiums).
- Turn on and off the button to display layers of Social Vulnerability. Main screen will display a map of visualized layers at selected features
- Changing visualization by district level.
- The popup box shows the data of district that your cusor.
- By clicking on this button, users can adjust layer opacity and download data.

- To adjust layer opacity: Select the desired layer, then click the Opacity arrow at the Layers panel.
- Download data: Click to download button to get data in shapefile format or WFP service.
- Legends of the choropleth map is automatically adjusted to the selected data..
- By clicking on each label, user can visualize the details of each data in attributes.
- The details of attributes have been described in the table below.
Description of the field attributes
Vulnerable group | |
F_0_15 | Female, Age 0-15 |
F_15_65 | Female, Age 15-65 |
F_65 | Female, Age >65 |
M_0_15 | Male, Age 0-15 |
M_15_65 | Male, Age 15-65 |
M_65 | Male, Age >65 |
Hospitals | |
Hospitals | |
Existing Shelters | |
GHS_builts | |
fclass | |
School | |
GHS_builts | |
fclass | |
Temples | |
GHS_builts | |
fclass | |
Churchs | |
GHS_builts | |
fclass | |
Mosques | |
GHS_builts | |
fclass | |
Stadiums | |
GHS_builts | |
fclass | |
3. Economic Vulnerability
- Economic Vulnerable component, provides information about Economic Vulnerability, including Gross domestic product (GDP) and Crop lands.
- Turn on and off the button to display layers of Economic Vulnerability. Main screen will display a map of visualized layers at selected features
- Changing visualization by district level.
- By clicking on this button, users can adjust layer opacity and download data.

- To adjust layer opacity: Select the desired layer, then click the Opacity arrow at the Layers panel.
- Download data: Click to download button to get data in shapefile format or WFP service.
- Legends of the choropleth map is automatically adjusted to the selected data.
- By clicking on each label, users can visualize the details of each data in attributes.
- The details of attributes have been described in the table below.
Description of the field attributes
Gross domestic product | |
GDP_in_cur | GDP in…. |
Crop lands | |
Cropland_E | Crop land … |
Environmental Vulnerability (Coming soon)
Environmental Vulnerability will be available on the Mekong X-ray tool.
3. Admin User Guide
With the Admin Interface, you can complete any of the following tasks:
- Create new layer
- Edit layer
- Delete layer
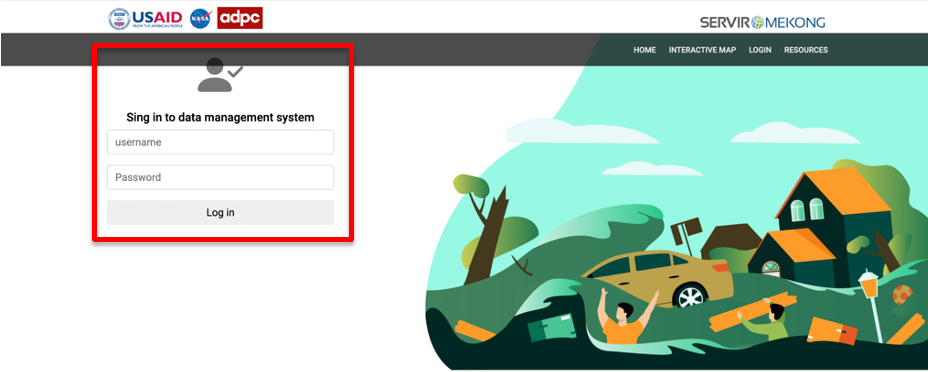
To access the Admin Interface, log in with your admin username and password.
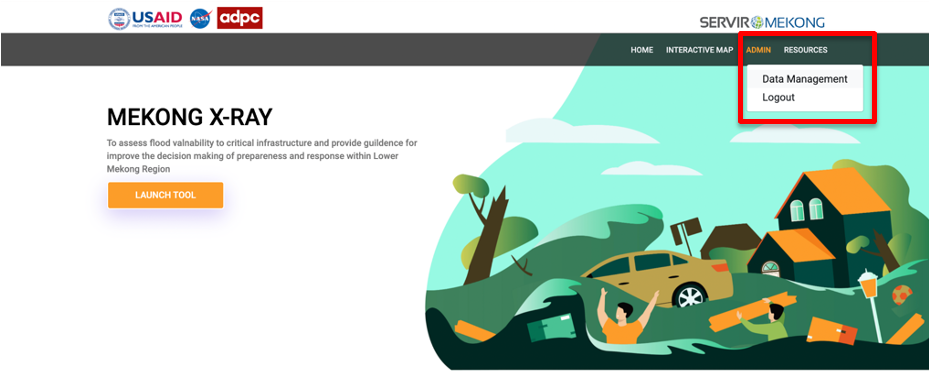
After you sign in, “Login” will change to “Admin”. By clicking on Admin, you can access to data management system.
In this sector, Admin can create new layer, edit layer and delete layer.
Create new layer
- In Admin, you can add new layer (i.e., Physical Vulnerability, Social Vulnerability and Economic Vulnerability) by clicking on “create new layer”.
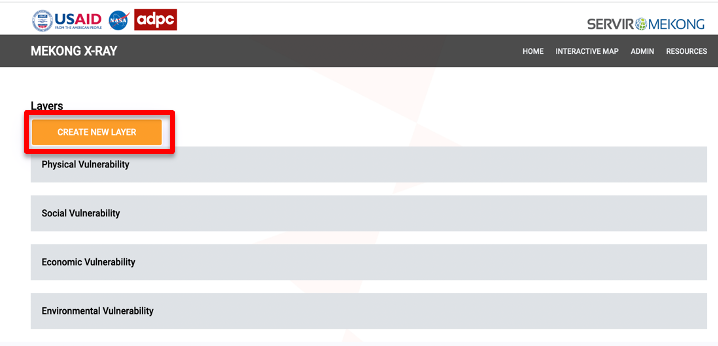
- After clicking on create new layer, you can add the details of the new layer. The details and example of new layer have been described in the table below.
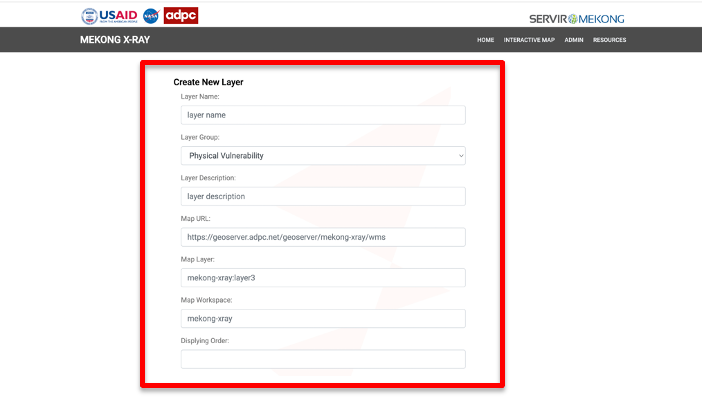
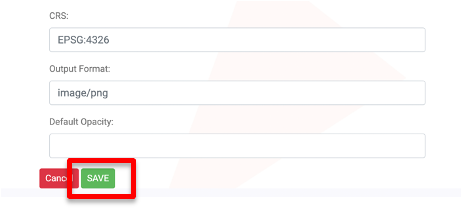
- Click “save” to confirm your new layer creation.
Description of the field attributes
Create new layer (i.e. Physical Vulnerability, Social Vulnerability, and Economic vulnerability.)
Create new layer | ||
Layer | Example | Description |
Layer Name | Reservoirs | Name of layer |
Layer Group | Physical Vulnerability | List of layer group: Physical Vulnerability, Social Vulnerability, and Economic vulnerability. |
Layer Description | Reservoirs | Descriptions of the layer |
Map URL | https://geoserver.adpc.net/geoserver/mekong-xray/wms | |
Map Layer | mekong-xray:reservoirs | |
Map Workspace | mekong-xray | |
Displaying Order | 2 | The sequence or order of a layer in a list |
Map Style | dams_style | |
Default visible | ||
Potential Shelters | ||
CRS | EGPS:4326 | Coordinate reference system |
Output Format | image/png | Selects data export formats |
Default Opacity | 1.0 | Sets the default opacity of the layer |
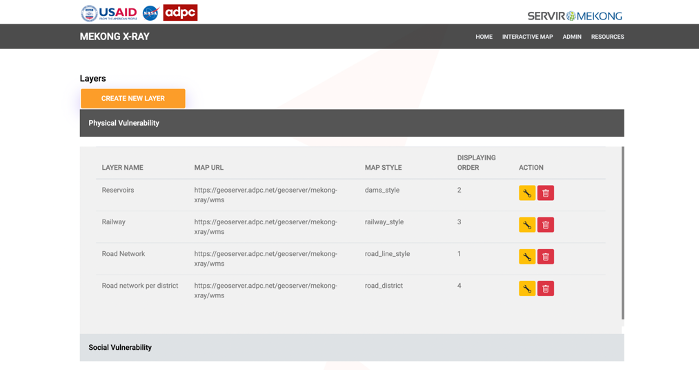
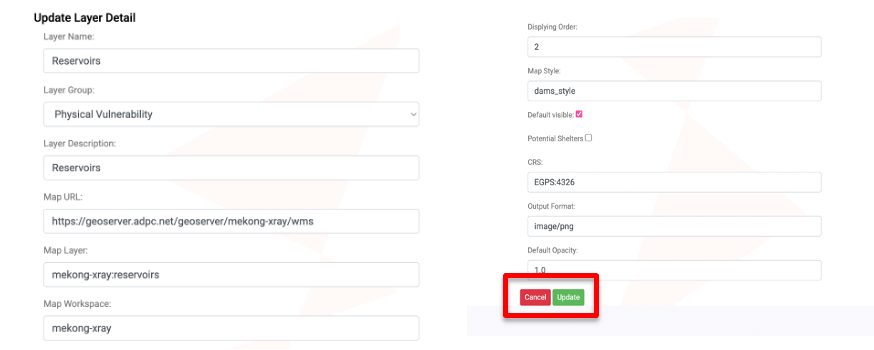
Edit layer
- Admin can edit layer by clicking on this button.
- When you click edit layer, the screen will display the default information for the layer you created in create new layer. This section allows you to edit information and update layer details.
- By clicking on “update” to save change or “cancel” to cancel change.

Delete layer
- To delete the layer, you can click on delete button.
- Delete layer by clicking this button.
