Considering Timeline Duration and Rate of Change of ‘Modernization’ and ‘Learning’ curves
In the notional graph below, the Modernization Curve (of Restructuring Code, Building Tests, and Process automation) and the Learning Curve(of New Practices and Technologies) are shown as separate efforts proceeding from 0% complete to 100% on a timeline:
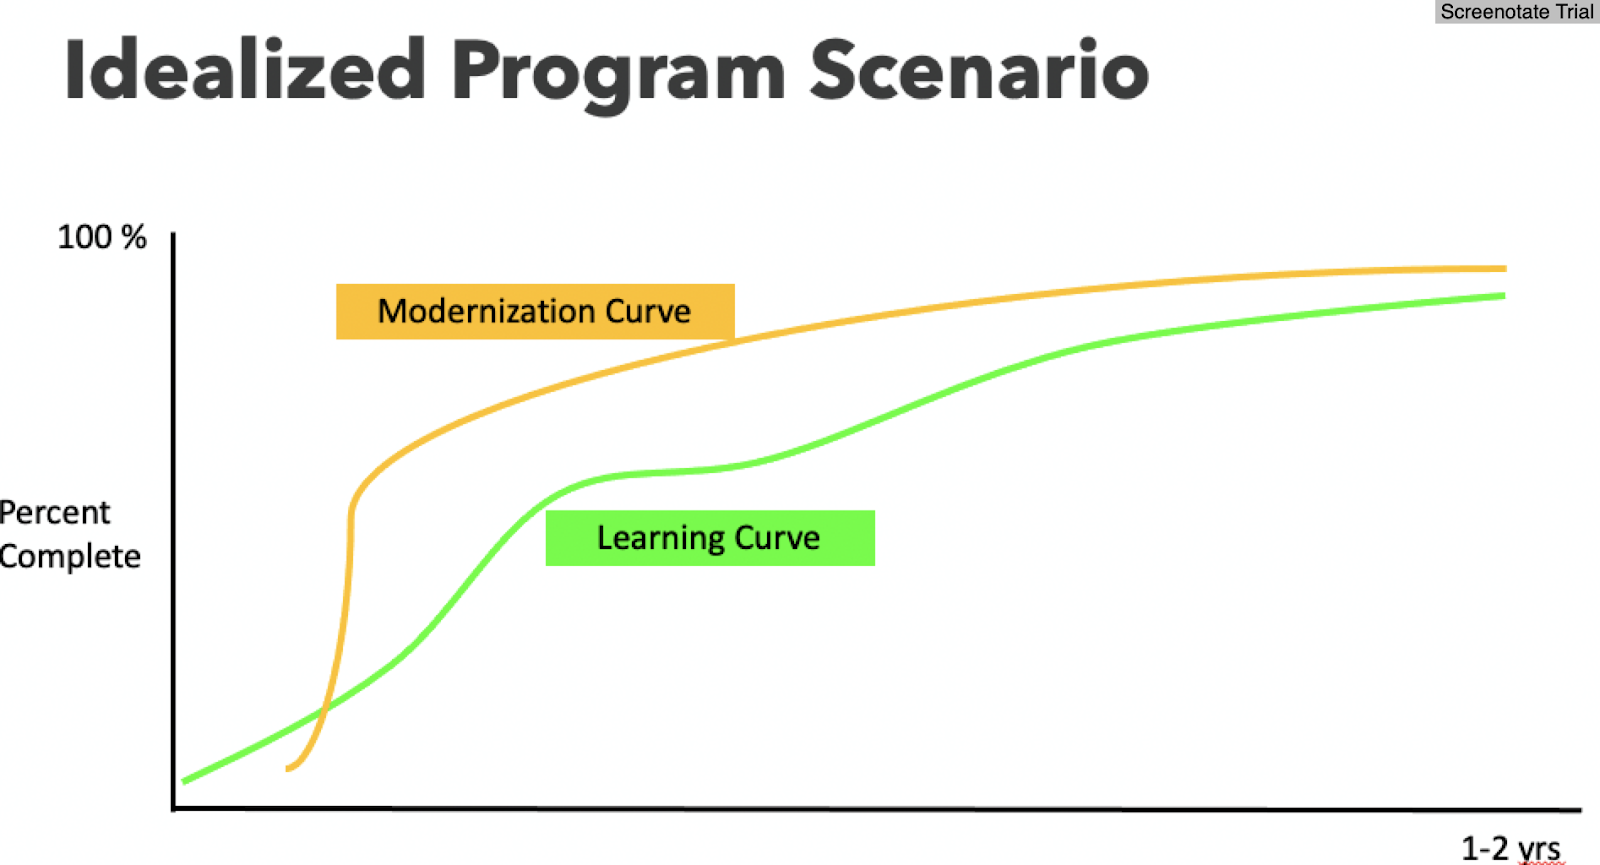
The paths shown for the two lines are notional. The intent of the graph is to think through what duration is reasonable and what level of coordination between these curves is possible and desirable:
- Can Modernization and Learning progress better if they are not coordinated?
- Learning takes time - how fast can staff learn? and the organization adapt to change?
How much will this rate fluctuate? - Can one “advanced team” invest in learning, put new structure in place, and then become a “platform/enablement team” helping others to learn and adopt. (e.g. Platform Team pattern[1])
- How early should technology be installed before teams are ready to use it?
- Can Installation, Training, and Adoption be simultaneous? (e.g. Dojo Pattern[2])
- What other Curves can we overlay on this (e.g. Clarity of Vision curve, Outcomes curve)
- What should these curves look like, ideally, for the OCE changes we envision?
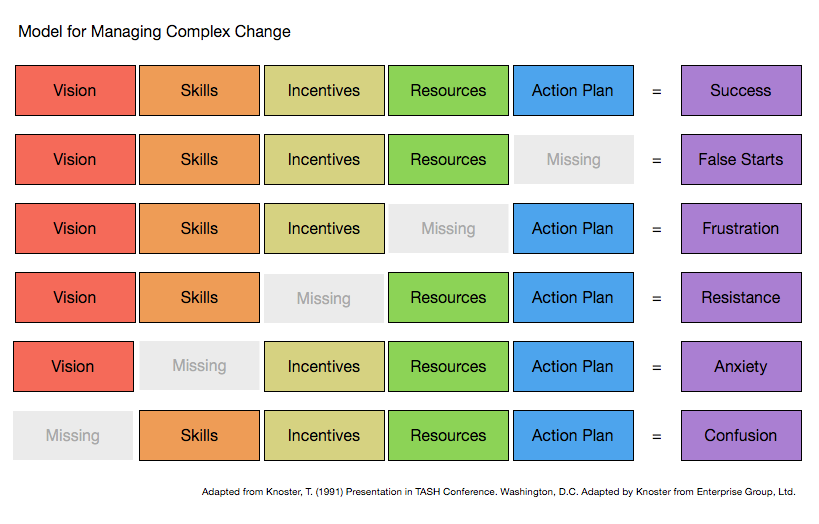
If desired, this can be viewed a bit more broadly. “The Knoster Model for Managing Complex Change, below, is a useful framework to thinking about change management. According to Knoster, there are five elements required for effective change: vision, skills, incentives, resources and an action plan. If those leading change fail to put any one of these elements in place, then the change efforts can struggle or even fail. This model can be a helpful way for planning as well as diagnosing what might be needed when plans go awry.”[3] :
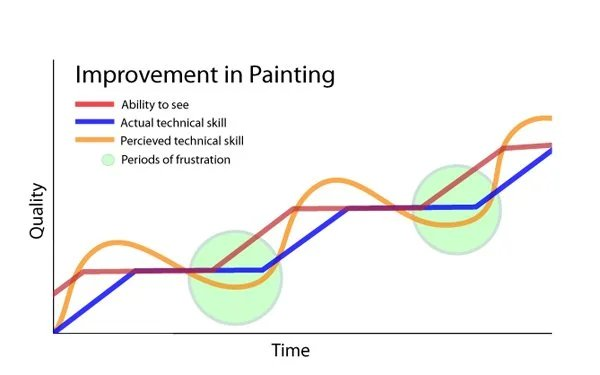
Similarly, the notional graph below is helpful to understand periodic frustration experienced by an individual when they are learning/practicing a technical skill and go through phases of growth and subsequent stagnation. An important point highlighted by this depiction is that “frustration” is a normal phase and commonly precedes jumps in technical skill. ( In this case, the learning curve of painting below is from a 20 year art instructors experience.[4])
Conclusion:
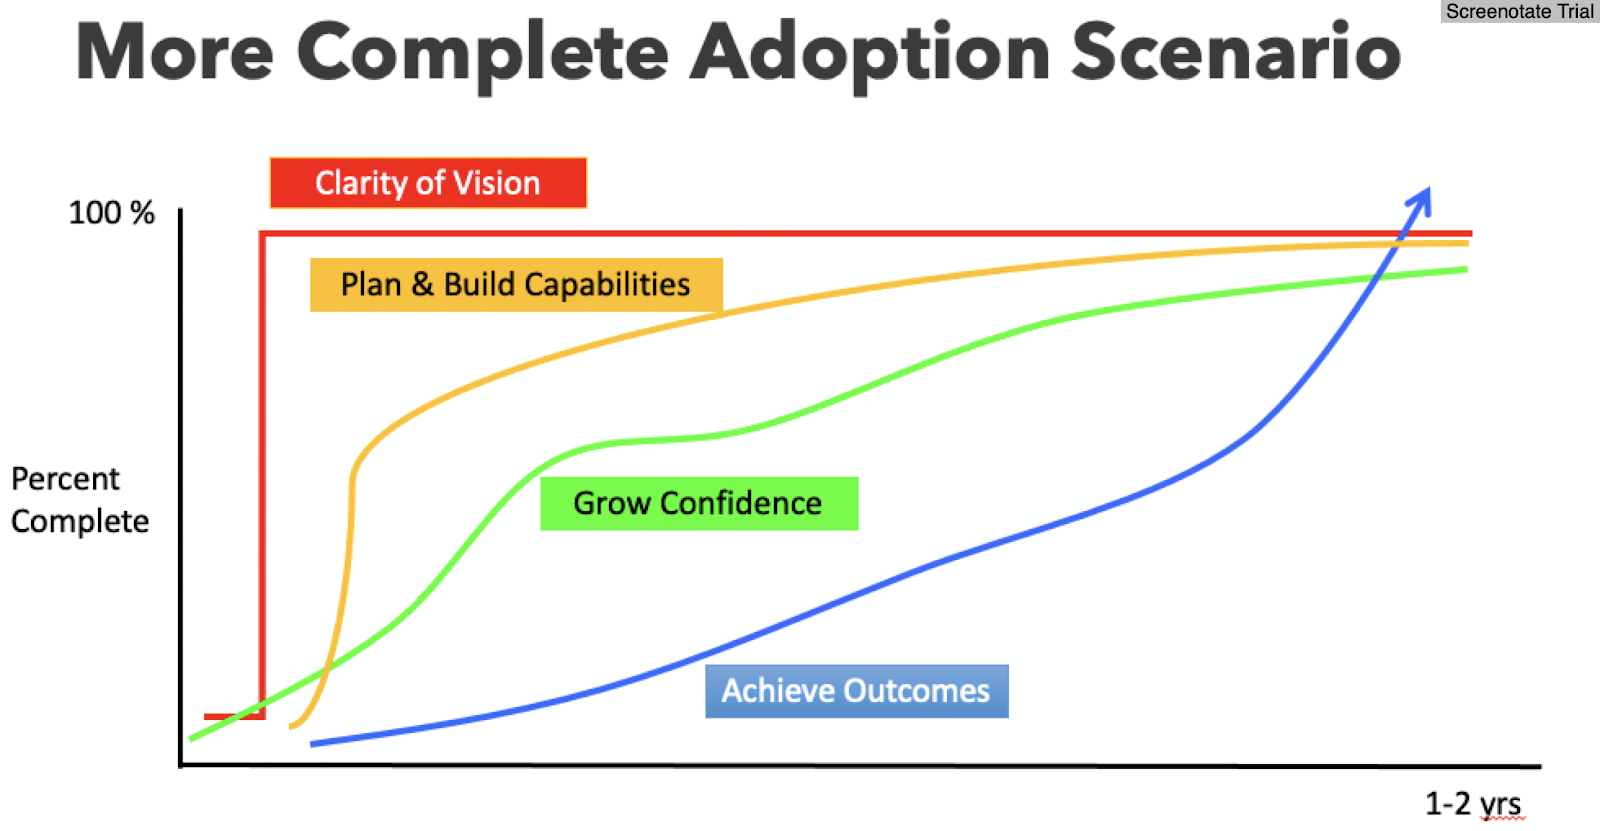
In our experience of helping organizations in similar situations, the Dual Needs of Modernization and Transformation are so interrelated that they must be pursued in a coordinated manner and not merely simultaneously. We can also add the two additional layers, “Clarity of Vision” and “Plan & Build Capabilities”, to the timeline graphic. This “More Complete Scenario” is what we should be looking to establish in the program.
[1] https://martinfowler.com/articles/talk-about-platforms.html
[2] https://blog.usejournal.com/why-is-pivotals-dojo-so-good-c96cdb497ddf
[3] https://practices.learningaccelerator.org/strategies/tool-knoster-model-for-managing-complex-change#:~:text=The%20Knoster%20Model%20for%20Managing,resources%20and%20an%20action%20plan.
[4] Marcdalessio (via reddit )
“I've studied and taught in traditional painting ateliers for 20 years and one thing I've always felt was true is that you can only improve your technique if you can see your errors.
Thus periods of frustration -when you see your work as terrible or, at least, problematic- should be treated as positive moments in learning to draw and paint.”