Name: Per: Date:
Chips Ahoy Statistics Lab: Do Chips Ahoy really contain more chocolate chips than other brands?

If you are familiar with the Chips Ahoy cookie brand you may recall that the company claims that there are “1000 chips in every bag.” Is this true? And, how does this compare to the number of cookies in other brands. Both of these questions can actually be answered using a combination of science and mathematics to determine if the Chips Ahoy claim is true.
Purpose:
In this lab we will use the question of how many chocolate chips are in a bag of Chips Ahoy Cookies as a means to learn about and use standard deviation and t-tests.
Procedure:
- Collect one of each cookie type (one per person) and a paper towel per person.
- Place cookie on paper towel & count the number of chocolate chips per cookie.
- Record data in your data table and add to class data turn in form (found on the online version).
- Using the entire class’ data, calculate the mean, median, mode, standard deviation, and complete a t-test with 95% confidence level.
- Make a graph of your data with proper labelling, error bars, units, and uncertainty
- Complete the analysis questions
- Enjoy your cookie :)
Table 1. Number of Chocolate Chips per Cookie Type
Cookie Type: | ||
Number of Chocolate Chips: |
Class Calculations:
Using the data found for the class, found here, complete the following calculations. Use proper
- Mean (Average):
- Standard Deviation:
- P value (95% confidence level):
- State Null Hypothesis:
- State Alternate Hypothesis:
Conclusion Based on Calculation (Use Template from Notes):
Graph:
Practice & Refining Your Skills:
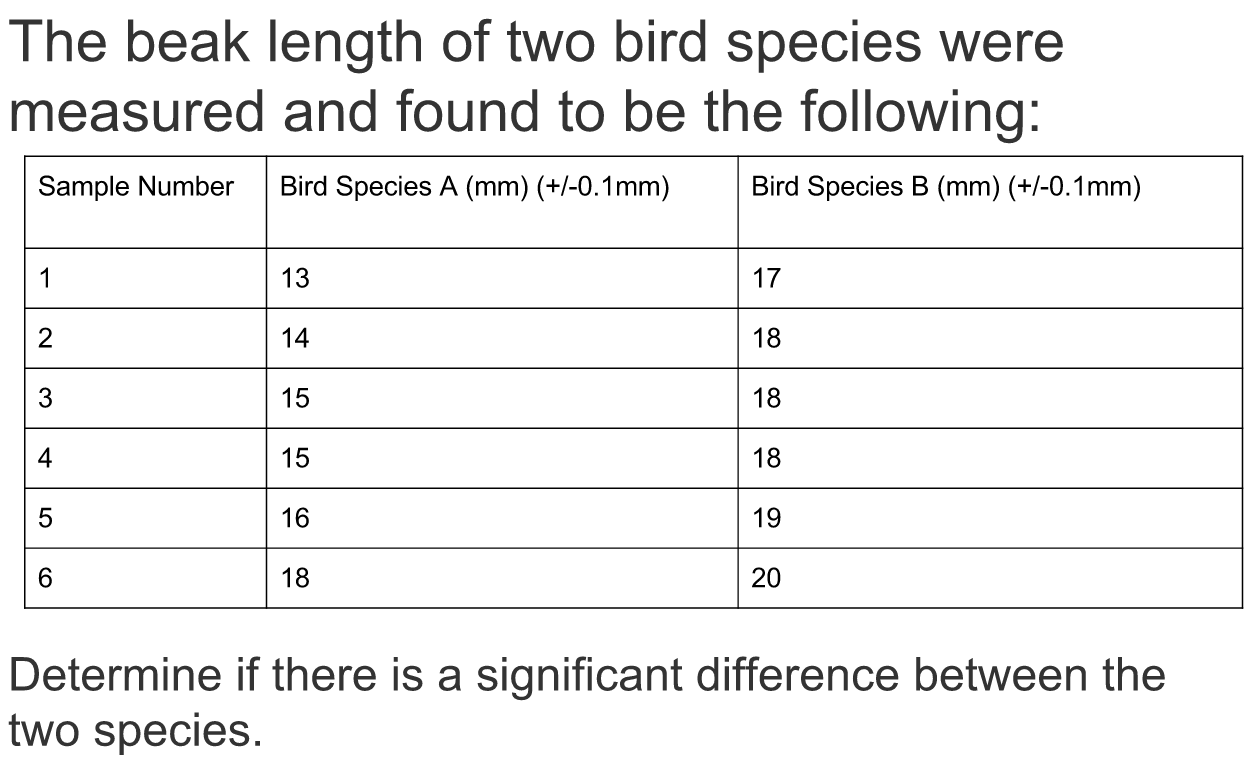
The Beak length of two bird species were measured and found to be the following:
Determine if there is a significant difference between the two species.
Mean (Average):
Standard Deviation:
P Value(95% confidence level):
State Null Hypothesis:
State Alternate Hypothesis:
Conclusion Based on Calculation (Answer null hypothesis):
Graph: