“It’s an aerobic sport, dammit!” - Andrew Coggan, PhD
By Steve Palladino
Coach and consultant, Palladino Power Project
January 19, 2018
The quote by Andrew Coggan, PhD that is incorporated into the title of this article was made well over ten years ago, and the sport he was referring to was road cycling. The same holds true in reference to the sport of distance running - in particular, race distances from 5K to marathon.
For most runners, races from 5K to marathon are executed at Functional Threshold Power (FTP) +/- 10%.
In athletes that I coach (genders combined), the ranges are as follows:
5K | 104-110% of FTP |
10k | 100-104% of FTP |
10 mile | 99% of FTP |
marathon | 91-93% of FTP |
In their book, The Secret of Running (p107&109), Van Dijk and Van Megen estimate the world records (as of 2017) as follows:
Men’s 5,000m | 111% of FTP |
Women’s 5,000m | 110% of FTP |
Men’s 10,000m | 106% of FTP |
Women’s 10,000m | 106% of FTP |
Men’s 15k | 101% of FTP |
Women’s 15k | 100% of FTP |
Men’s half marathon | 100% of FTP |
Women’s half marathon | 100% of FTP |
Men’s marathon | 94% of FTP |
Women’s marathon | 96% of FTP |
Further illustrating the point, Andrew Coggan, PhD has shared graphic depicted in Figure 1, breaking down the estimated percentage of Critical Power in which races would/could be executed:
Figure 1. (source: Andrew Coggan, PhD)

FTP is “the highest power that a runner can maintain in a quasi-steady state without fatiguing, where the duration may range from 30-70 minutes, depending on the individual” - Running Functional Threshold Power - A Primer. Further, FTP represents an important aerobic marker - representing a physiologic state approximating maximal lactate steady state (MLSS).
The power range of FTP +/- 10% does seem to encompass the power range in which most runners execute races from 5K to marathon. This power range lies quite comfortably in the predominantly aerobic area of the power-duration curve - all lower than the typical power that one would encounter “at” VO2max.
Looking at the aerobic contribution to power further, there are "2 common misconceptions in the exercise science and coaching professions. First, that the energy systems respond to the demands of intense exercise in an almost sequential manner, and secondly, that the aerobic system responds slowly to these energy demands, thereby playing little role in determining performance over short durations." - Energy System Interaction and Relative Contribution During Maximal Exercise.
The WKO4 chart, ‘Run FTP Contribution with TTE’, can be used to illustrate the estimated aerobic vs anaerobic contribution to maximal gross external power produced by a runner. In Figure 2, the entire 2017 power database of an emerging elite female distance runner is utilized within the chart. Her PRs, all set in 2017, include: 17:07 5,000m, 34:51 10,000m, and 58:55 10 mile.
Figure 2. Run FTP Contribution with TTE chart for an emerging elite female distance runner

Note that at approximately the runner’s 5,000m PR (values in the top legend are in reference to the 17:01 duration), the aerobic contribution to power for this runner is estimated to be approximately 98%. For the durations longer than the runner’s 5K PR, the relative aerobic contribution only grows (note that the blue line, representing anaerobic contribution declines and flatlines at near 0-1% at the runner’s 10K and 10 mile PRs).
In Figure 3, the entire 2017 power database of a high level 14-15yo male distance runner distance runner is utilized within the chart. His PRs, all set in 2017, include: 4:34 1600m, 16:03 cross country 5K.
Figure 3. Run FTP Contribution with TTE chart for a 14-15yo male distance runner
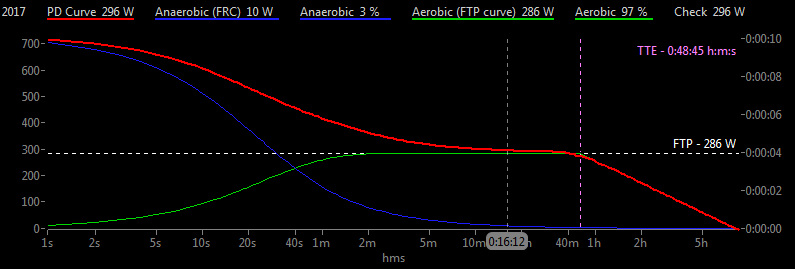
Again, at a duration that is near this runner’s 5K XC PR (values in the top legend are in reference to the 16:12 duration), the aerobic contribution to his power is estimated to be approximately 96-97%. Again, the relative anaerobic contribution continues to decline as durations progress to the right on the x-axis - relative aerobic contribution grows as duration become longer.
And, although the intended scope of this article is for distance running - between 5K and marathon - it is worth noting that the runner in Figure 3 races exclusively from 400m to 5K. Even at the shorter races, the aerobic contribution to his maximal power is estimated to be 59% at 400m duration, 79% at 800m duration, 89% at 1600m duration.
Yes, it is an aerobic sport! Aerobic contribution to maximal gross external power output predominates. This is not to say that there is no anaerobic contribution. However, for power less than FTP, the anaerobic contribution is next to nil. For power at 5K race maximal effort, the anaerobic contribution is relatively small, depending on the athlete and their anaerobic capacity (or Function Reserve Capacity in WKO4 terminology). To be clear, it is not my point to minimize the importance of anaerobic power development - particularly for races progressively below 10K distance (15K for elites).
However, the point is that races from 5K to marathon are typically executed at FTP +/- 10%, which, in turn, lends support to FTP-based training - at least for the aerobic components of the training program.
Andrew Coggan, PhD, has presented another graphic, which depicts the variability and range of individuals’ meanmaximal power-duration (MMP) values relative to their FTP. (Figure 4).
Figure 4. Population-based power-duration curve with relative variability of individual in the population.

Within the box that I have added, one can see that there is relatively low variability of individuals’ MMP relative to their FTP. It’s an aerobic sport, dammit. For training prescriptions for 5K power to marathon power, prescribing as a percentage of FTP is supported, and likely quite reliable.
On the other hand, when prescribing training that targets anaerobic power development (the area to the left of the box), the prescription is best individualized to the individual’s own power-duration curve - prescribing training at these power-durations as a percentage of FTP is far less reliable.
Using Palladino Power Project running power zones (Figure 5) for purposes of definition, prescribing training as a percentage of FTP is quite reliable in zones 1-4. Zone 5 encompasses many runner’s 5K (bottom of zone 5) to 1500m power (top of zone 5). Prescribing training as a percentage of FTP for training in this zone is likely reliable at the bottom end of the zone, but would be better guided by the individual’s own power-duration curve at the top end of this zone - depending on the intended training stimulus desired of the workout. Certainly, for zone 6, training prescriptions are best directed from the individual’s own power-duration curve. Zone 6, described as 117-150% of FTP, is for descriptive purposes only.
Figure 5. Palladino Power Project running power zones
Zone 1 | Easy Running | ||
1A | Easy recovery between intervals and cool-down | 50-65% of functional threshold power | |
1B | Easy warm-up component before intervals or racing | 65-75% of functional threshold power | |
1C | Easy Aerobic Runs | 75-80% of functional threshold power | |
Zone 2 | Typically, average power for long runs / overdistance (or sustained runs with higher intensity mixed in) Otherwise a grey zone for more standard lengthen aerobic runs. | 81 to 87% of functional threshold power | |
Zone 3 | Threshold Stimulus | ||
3A | Sweet spot running. Tempo runs. Generally, sustained effort runs executed at the lower percentages of FTP, or, long (>=15 minute) intervals at the higher percentages of FTP within this zone. | 88-94% of functional threshold power | |
3B | Threshold work. Longer intervals and occasionally, sustained effort running. | 95-101% of functional threshold power | |
Zone 4 | Suprathreshold work. Generally intervals. | 102-105% of functional threshold power | |
Zone 5 | Max aerobic work. Typically intervals (or occasional ‘time’ trials). | 106%-116% of functional threshold power | |
Zone 6 | Anaerobic work. Short intervals or short time trials | 117-150% of functional threshold power | |
Zone 7 | Maximal Power. Sprints. | >150% of functional threshold power |
In terms of relative volume, most distance runners accumulate the majority of their training in zone 1 through the lower end of zone 5. It’s an aerobic sport, dammit. Of course, the event and the phase of training will impact the training distribution among the various zones. Nevertheless, for events from 5K to marathon, training in zone 6 and 7 is a relatively small percentage of the total volume.
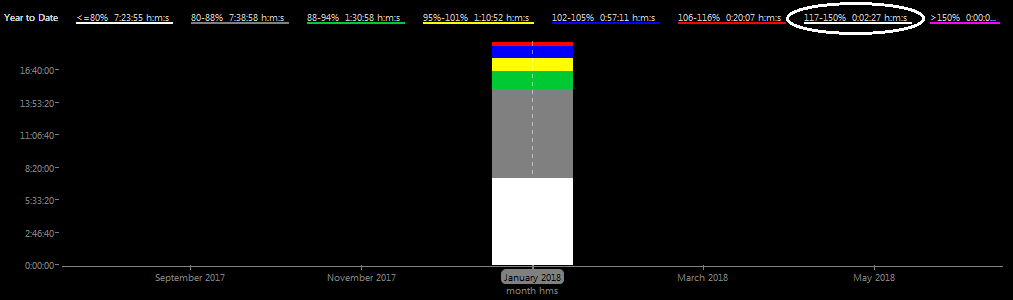
As an example, I present one runner training primarily for 5k events. The training from January 1 through 24 is presented as a glimpse - this is winter training. Figure 6 depicts the distribution of the runner’s training, by percentage, into the various zones during the period of January 1-24. The percentages in zones 1 through 5 effectively equals 100%. The 2% of the training volume seen in zone 5 is at the lower end of zone 5.
Figure 6. Training distribution, by percentage, in each zone for runner with primary 5k focus - Winter training,January 1-24.

In Figure 7, the same runner’s training over the same period is depicted in terms of duration in each zone. While failing to round up to 1%, there were 2 minutes and 27 seconds accumulated in zone 6, anaerobic work, during the period January 1-24.
Figure 7. Training distribution, by duration, in each zone for runner with primary 5k focus - Winter training,January 1-24.
These examples do not advocate a particular distribution of work. They do not represent the “one best method”. They merely illustrate the relative amount of aerobic training that one runner has used recently. Nevertheless, it is likely that most runners accumulate a predominant relative amount of training volume in aerobic training.
In summary, in racing distances from 5K to marathon, and in training for them, aerobically generated power predominates. It’s an aerobic sport, dammit!