Names: Livia Simmions Class: 703 Date: 5/22/20
WATER SUSTAINABILITY PROJECT:
Using Statistics to Analyze Water Consumption and Use in the BUGS Community
-Due May 19th (early submission, 5 points extra)-
-Due May 22nd,( on-time submission)-
Why should we care about water?
We should care about water since it is essential for every living thing to survive. Water maintains our environments and ecosystems. It is also used to produce energy which, in turn, helps to reduce pollution and save fuel resources. If we reduce our water using the energy required to process and deliver it to homes, businesses, farms, and communities will affect the people working there in a positive way. Water is the basic need of life and the function of human interaction. What makes up about 60% of the human body and by increasing our water intake it will help our body to function at its best. Reference from Water Science School “each day humans must consume a certain amount of water to survive. Of course, this varies according to age and gender, and also by where someone lives. Generally, an adult male needs about 3 liters (3.2 quarts) per day while an adult female needs about 2.2 liters (2.3 quarts) per day”.
II.PROCEDURE. Answer in a complete paragraph
My research topic was to study the average amount of water intake from students at BUGS by 6th, 7th and 8th grade. I provided all students with a google form by email to approximately 300 students. A total of 75 students responded, used theses responses to make and inference based on the data, evidence, and reasoning. The statistical question posed: How many cups of water do you drink per day?. I used myself as a reference to my classmate to also find out if I was within an average of the 7th grade since I drink approximately 5 cups of water daily.
I was able to reach the entire student body by provided google question forms by email. I did research other articles that discussed the importance of water and how much water should a person drink. My research articles say that water intake should be based on your weight, height, and age mostly. From my research the Institute of Medicine (IOM) recommends a total of 13 cups of fluid for men, women they suggest 9 cups, how much water children need depends on many things, like their age, how much they weigh, and their gender. Other things include how healthy and active they are, and what the climate is like where they live; in general, children and teens need about 6 to 8 cups of water a day.
What did you research?
I did a study on the water intake per grade for BUGS, . I took the data(75) and had to make an inference on it.
Share your statistical question.
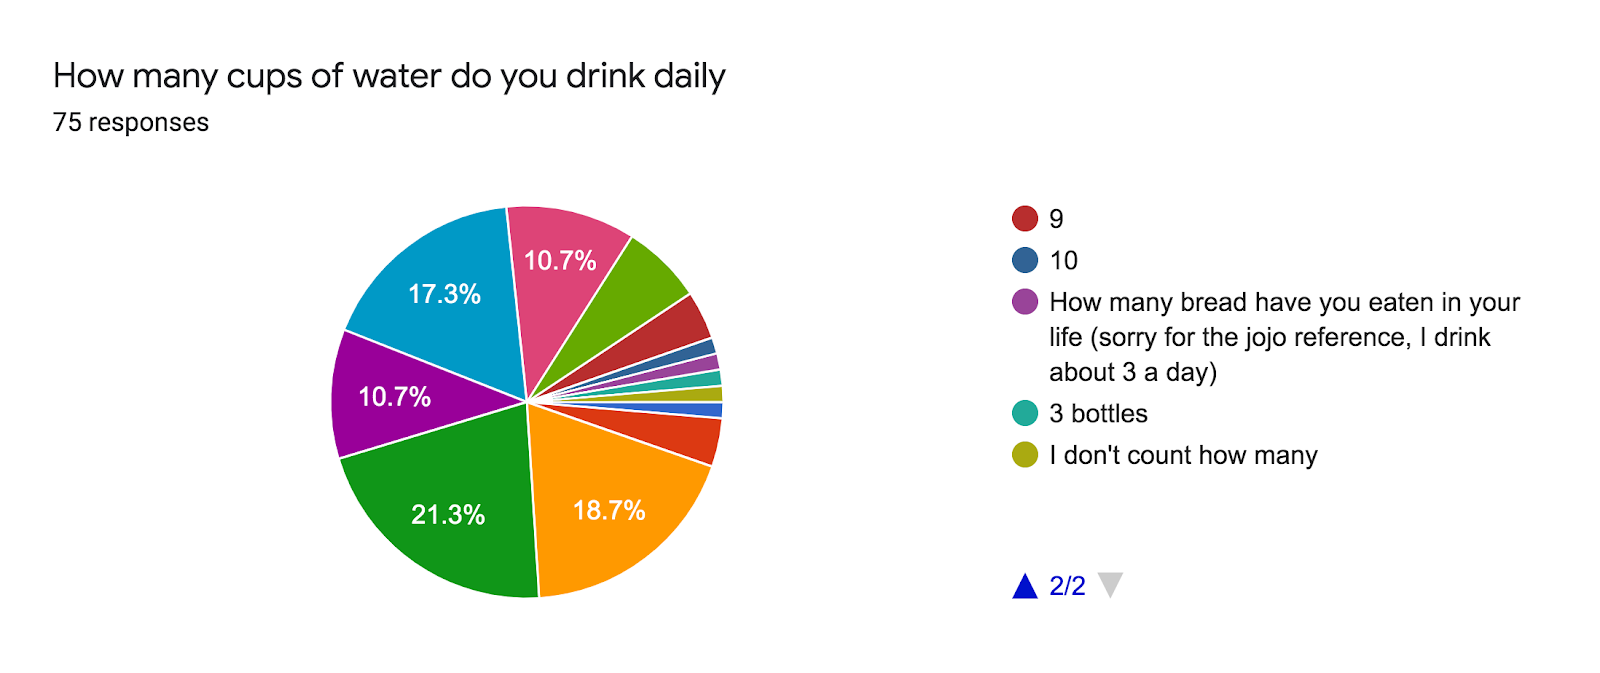
How many cups of water do you drink daily?
How many cups of water do you drink daily?
I drink approximately 5 cups of water a day.
How did you do your research?
I utilized the google forms, and the data I received from the study.
Share how you implemented your survey.
I emailed each grade and they sent it back to me.
Name your sampling method and describe the process.
Stratified random sampling
(Discuss your findings from your Personal Water Audit, your statistical question, sample size, population, method of sampling, and reason for choosing this method. Attach the responses spreadsheet from your Google Form survey.)
III. Calculations, Graph, and Inferences
1. Display data list (raw data).
https://docs.google.com/forms/d/1ApyY-UYAqs2B0FTvRAov5YPYddFnzv9KmZboKRkTrQs/edit#responses = responses
Population size: 30
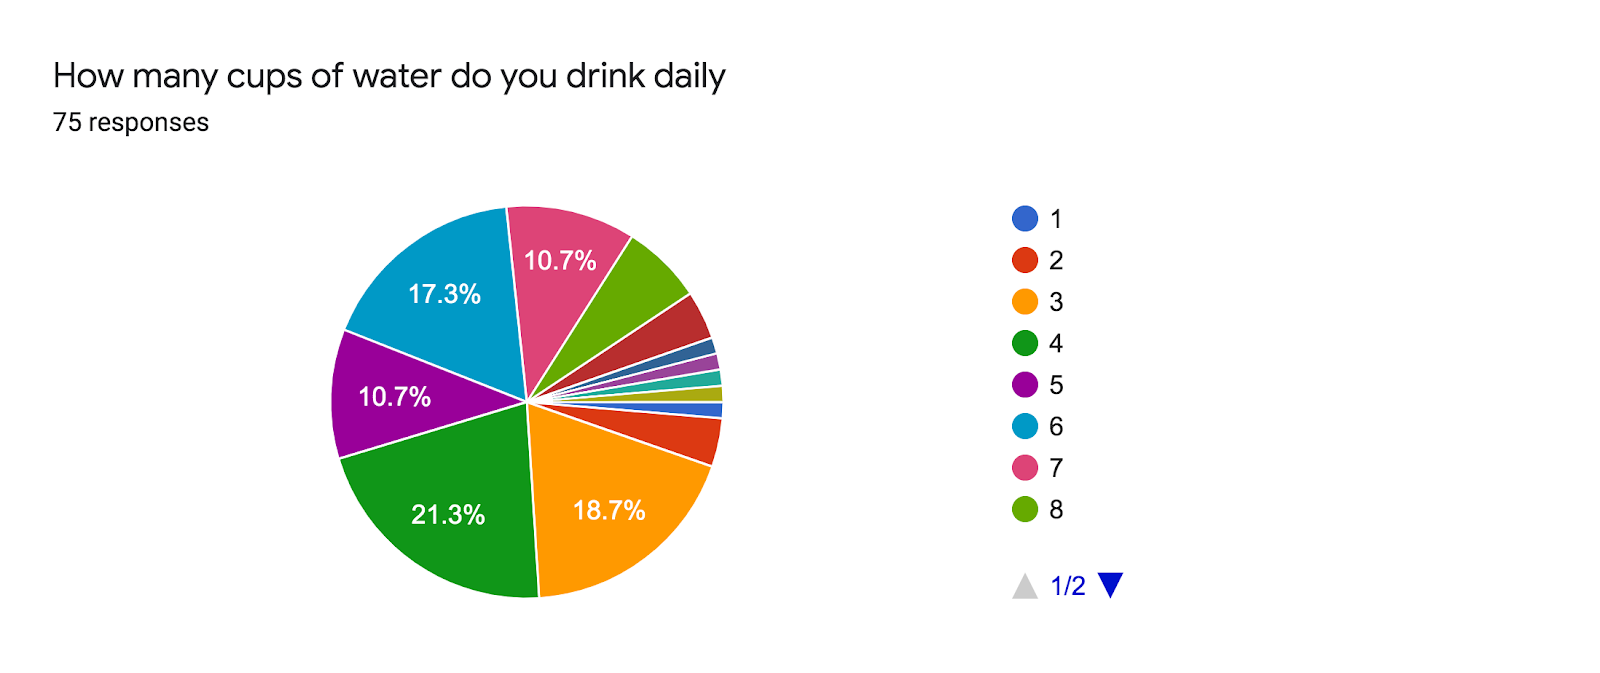
2. Calculate the center of your data: average (mean) or median of your data.
Median: 5 | Minimum: 2 | Maximum: 8 |
3. Calculate the spread of your data: range or interquartile range; SPICY: M.A.D
First quartile: 3 | Third quartile: 6 | Interquartile Range: 3 | Outliers: none |
4. Graph your data. Choices: histogram, dot plot, box plot, stem-and-leaf.

5. Use statements and proportions to make Inferences about the population,
Inference: 6th grader drink more water than 7th and 8th
The number of 8th graders is lower than any grade.
BUGS students for example (approx. 300), from your sample data.
Grades cups per grade
6TH | 2,3,4,4,6,4,4,7,6,5,6,2,7,4,5,4,3, | 76=total in cups per group |
7TH | 7,6,2,8,3,8,6,6,6,5 | 57 total in cups per group |
8TH | 3,5,5 | 13 =total in cups per group |
146 = Total in community
IV. Conclusion: What should be done in response to the consumption that is evident from your research and data? (Describe a call to action students and/or teachers can take to make the situation more sustainable).
Something that should be done is to take pride in how much water you drink and try to stay healthy and drink as much water as you can. A call to action that a student could do is when you drink water and you still fill up your bottle but don't throw out the old water. Also, use reusable bottles.
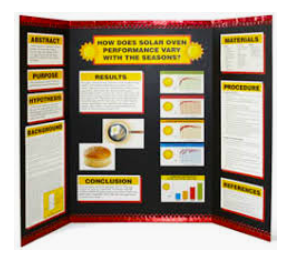
Format options: Write-up and Social Media post, Write-up and tri-fold board presentation, write-up of research and letter, write-up and poster
Social Media Post (not a video) | Google Slides | Letter to an official | Digital Poster | Prezi Presentation | Video | |
Think of what you might present on a trifold….present it in Google slides instead | Use Find my representative in order to locate the representative in local government you need to write to with your data and findings. | Be creative! Be informative! | ||||


Livia Simmons-St. Lewis
May 21, 2020
Hakeem S. Jeffries
Democrat - New York District 8
U.S. House of Representatives
Washington, DC 20515
Dear Mr. Jeffries,
Hello, my name is Livia, I am in the 7th grade at Brooklyn Urban Garden Charter School. I am doing a water statistics project on how many cups of water do each kid at BUGS drinks a day. I have collected 75 responses and out of those 75 responses, I narrow it down to 30 by using a randomized number calculator. Then I organized the data based on the grade level which is 6, 7, and 8th grade. In the 6th grade, the most popular answer is 4 cups of water; in the 7th grade the most popular answer is 6, and in the 8th grade the most popular answer in 5. Human beings should drink at least 8 cups of water a day, some medical site says to drink 2-3 cups of water an hour.
I was hoping that you could please encourage people in our community not to waste water, and also if you have any ideas to help decrease the use and wasting of water.
Thank you for your time and attention to this matter.
Livia Simmons-St. Lewis
https://mail.google.com/mail/u/0/?tab=rm#sent/QgrcJHsNpWhDqqxdXgrZqqrSrggkGBDfNDQ
Water Project Rubric
Students explain why we should care about water… (intro) | Students have researched (data from conducting a survey)... (procedure) | Students display data with a graph or plot. | Students make inferences about the data. (including calculations ) | Students have a conclusion and a suitable presentation format. | |
4 | In a well-thought-out and error-free paragraph that references more than one assigned reading or graphic. | And the data is organized. The paragraph about the research is thorough and addresses all areas. | If the plot is a
Prepared with a frequency table, consistent intervals, scaled number lines, and a title
| Calculations of center and spread include explanations that show understanding of the center and spread. Student makes more than one inference statement and uses a proportion to make a generalization about the population | The conclusion describes a call to action to address the problem that is summarized in the concluding paragraph that the research and data show. Your reflection on the ISCs is thoughtful and complete. Key elements of your project should be evident in one of the following formats, and includes headings or labeled sections:
|
3 | In a complete paragraph that references at least one assigned reading or graphic. | And the data is in a list with a complete paragraph about the research and most/all areas are addressed | No more than one element is missing from the plot, as described above. | Calculations of center and spread include explanations. The student makes one inference statement and uses a proportion to make a second inference statement. | Format and conclusion are adequately done, with few minor errors. Your reflection on the ISCs is complete. |
2 | With good ideas, but below average paragraph structure; may or may not reference an assigned reading or graphic | And the data is collected, but the sample size is too small and/or not all parts of the paragraph are answered | There are missing parts in the graph or the plot has inaccurate parts. | Calculations are incomplete or may not include explanations. There are missing parts to the inferences. | There are missing parts to the chosen format and/or conclusion. Your reflection on the ISCs is incomplete or may lack connection to your project.. |
1 | But the point is not clear and the paragraph is incomplete | Data collection is poorly done. (*Without data, anything you turn in will receive no more than a 55) | Graph or plot is missing or poorly done. | Calculations/explanations may be incomplete or poorly done. Inferences are missing or poorly done. | Conclusion is missing or poorly done. |
Data Collection Sheet
Data Collected (Title-write your statistical question):
How many cups of water do you drink daily?
| 702 | 7 |
| 601 | 2 |
| 602 | 3 |
| 804 | 3 |
| 604 | 4 |
| 602 | 4 |
| 601 | 6 |
| 604 | 4 |
| 701 | 6 |
| 604 | 4 |
| 603 | 7 |
| 603 | 6 |
| 701 | 2 |
| 704 | 8 |
| 701 | 3 |
| 701 | 8 |
| 703 | 6 |
| 803 | 5 |
| 604 | 6 |
| 601 | 6 |
| 701 | 6 |
| 601 | 2 |
| 604 | 7 |
| 702 | 6 |
| 602 | 4 |
| 703 | 5 |
| 804 | 5 |
| 601 | 5 |
| 601 | 4 |
| 602 | 3 |
Create a suitable plot for your data. You can choose a line plot, box plot, or histogram. Explain why you chose the display you chose.
Analysis of Data (Select one of the two options below):
A. Calculate the mean (a center measure) and the Mean Absolute Deviation (a measure of spread) of the data.
B. Calculate the median (a center measure) and interquartile range (a measure of spread) of the data.
Median: 5 | Minimum: 2 | Maximum: 8 |
First quartile: 3 | Third quartile: 6 | Interquartile Range: 3 | Outliers: none |
What trends or conclusions can you draw from your calculations of the center and spread of your data? What does your graph show you?
A lot of people drank 4 cups of water
Directions
Use this graphic organizer to explain how your project meets the following Interdisciplinary Sustainability Competencies (ISCs).
ISC | Evidence | Why it connects to ISC | |
Multiple Perspectives DIfferent points of view represented. | There was a different amount of water they drank. | Everyone don’t believes in drinking water | |
Future Thinking Long-lasting. Solving problems before they start. Impacting future generations. | There were a lot of people that drank 6-7 cups / bottles. Which is ok however Instead of using plastic bottles use reusable ones | Plastic can pollute our water , in turn making it nonuseable for living things. | |
Action Orientation Not just talking about doing but actually making things happen. Solid plan for making things happen. | I will help by telling people to save water and use reusable bottles. | To ensure that we are saving water and the world | |
Systems Thinking Working with natural systems. Understanding social systems. Creating sustainable systems. | I would make fliers or emails and send them to everyone letting them know what's happening in the world. | To let everyone know so we don’t damage the planet | |
Stakeholder Engagement Key members of the community are involved. | I would start with a small group and then move onto bigger groups to help the ocean. | I would start with a small group and then move onto bigger groups to help the ocean.
| |
Use the information to rewrite your responses in essay or paragraph form (typed or neatly hand-written)
DIfferent points of view are represented by the different amounts of water they drank because of this everyone doesn’t believe in drinking water. To find long-term solutions for problems before they start and Impacting future generations the data showed
There were a lot of people that drank 6-7 cups/bottles. This is ok however Instead of using plastic bottles use reusable ones. Plastic can pollute our water, in turn making it non-useable for living things. Not just talking about doing but actually making things happen. A solid plan for making things happen is by telling people to save water and use reusable bottles. To ensure that we are saving water and the world. Working with natural systems and Understanding social systems to create a sustainable system. I would make fliers or emails and send them to everyone letting them know what's happening in the world. To let everyone know so we don’t damage the planet. Key members of the community will become involved. In turn, making a start with small groups and then moving onto bigger groups to help the ocean to make sure the community involved.