unpublished work © Eric Reiter, November 10, 2003
Experimental demonstration of the fully classical nature of gamma-rays
Eric S Reiter
Pacifica, CA, e-mail: eric@unquantum.net
Abstract
In a thought experiment, Einstein proposed that each light quantum would go one way or another at a beam splitter. In testing this model, a series of experiments use spontaneous gamma-rays from either 109Cd or 57Co whereby a primary gamma-ray splits and is detected in coincidence in two detectors. The experimental coincidence rates are found to substantially exceed the chance coincidence rate. These are full-height pulses, which directly violate the quantum mechanical probabilistic model of light, and indirectly violate the concept of quantized free charge. The effect only works when the gamma-ray "energy" is sufficiently low such that the photoelectric effect efficiency dominates above the Compton effect in the detector. Very few gamma sources have a lone photopeak that allows this measurement, partially explaining why this effect has gone unnoticed. To further help understand how all this can possibly be true, a wave-oriented derivation of the photoelectric effect is offered.
____________________________________________________
Introduction
There is a famous beam-splitter test to determine if light is classical or quantum mechanical. A single hν of the emitted energy is not supposed to cause full pulse-height coincidences in two detectors. Why is it that no one tried to perform this experiment with gamma-rays? Because it was thought to be a fact1 that gamma-rays were photons. The surprising result reported here is that gamma-rays can divide to produce coincidences, which means they are not photons. The nature of my findings justifies a detailed experimental report to convince the reader there is no obvious experimental flaw. If the photon principle fails, so does quantum mechanics. But this seems impossible given its long-lasting success. At the end of this paper, I introduce a theory, the threshold-ratio model,2 TRM, that introduces non-classical wave properties capable of explaining the illusion of quantization seen in our experiments. Quantization was successful in predicting many experiments, but it was always paradoxical. How can particles generate a wave pattern? Or conversely, how can a wave function magically guide itself to collapse to a point? We knew these were problems, but there was never put forth an experiment that violated the particle-probability model of quantum mechanics to the point of seriously considering an alternative. While these experiments violate a fundamental quantum mechanical prediction, the accompanying theory explains why quantum mechanics, in many cases, will work regardless of that violation.
Criticism of Design of Past Experiments Favoring Quantum Mechanics
My experimental ideas came from a careful review of the history of physics, where I have identified erroneous assumptions made in the design and interpretation of crucial experiments.
Concerning the nature of light
In Bohr’s book3, he describes his 1927 discussions with Einstein and describes Einstein's thought experiment:
“If a semi-reflecting mirror is placed in the way of a photon, leaving two possibilities for its direction of propagation, the photon would be recorded on one, and only one, of two photographic plates situated at great distances in the two directions in question, or else we may, by replacing the plates by mirrors, observe effects exhibiting an interference between the two reflected wave-trains.”
It is the first half of this quote that describes a particle property of light with which the experiment of this paper is at odds. The wave property in the second part of the quote is something we all agree on. The earliest test I could find for this thought experiment was performed by Givens4 in 1946, whereby x-rays from a Coolidge tube were directed at a NaCl target. The x-rays would then Bragg-reflect and split into two beams toward Geiger-Mueller detectors. A coincidence circuit recorded only the low rates expected by chance and demanded by quantum mechanics (QM). An alternative model to photons would be an electromagnetic pulse. To design a fair test to make the distinction between this and the photon model, consider the conditions required for an electromagnetic pulse to split and cause coincidences. If a Coolidge tube happens to generate overlapping Gaussian envelopes of electromagnetic energy, such envelopes when overlapped and attenuated by distance and apertures would average out to a smooth energy flux which could not trigger coincidences at rates surpassing chance. In addition, the wide-band emitter and detectors used by Givens would further obscure a classical-pulse response. This was obviously an unfair test, and I could not find anyone else doing the test with either x-rays or gamma-rays.
An experimental attempt to split one emitted hν of energy released at a time was not published until 1974 by Clauser,5 who measured no coincidences between the two paths past an optical beam splitter. He concluded that Maxwell’s equations were not generally valid (he is wrong). Amazingly, he used a polarized beam-splitter to split polarized light released from an atom. It is easy to see from interpreting data of the Kocher-Commins experiment6 that each hν of energy emitted from an atom is polarized, and the polarization of each such pulse is randomly oriented. Therefore, polarized light, upon interacting with a polarized beam splitter, would be routed in unequal fractions toward two photomultiplier tube (PMT) detectors. There are other reasons why this experimental design is flawed, but this is so outrageous that it bears making the point that they had no idea what a workable alternative to QM might be. Eliminating a crippled classical alternative holds no weight.
A less ridiculous oversight concerns an assumption behind the way a PMT detects an individual photon event. If the source of light is monochromatic, contrary to popular wisdom,7 the PMT will still generate a distribution of pulse sizes. Surely, Clauser and others used discriminators to pass only pulse amplitudes that occur most often in response to their respective light color. However, they did not comment on their discriminator settings. In their case, by eliminating even more pulses than those responding in a seemingly valid pulse height distribution, it would further lower the possibility of detecting coincidences. Any pulse in the distribution can occur in response to the same emitted hν of light. Therefore, this type of experiment cannot perform a classical/quantum distinction by using optical light and PMTs. In my research of the hundred or so articles directly referencing Clauser's paper, including an experimental rework,8 and a review article,9 these very obvious and important technical oversights have remained uncorrected.
Concerning the nature of charge
Though the experimental results in this paper clarify the nature of light and point to the demise of the photon principle, it is important to include in my criticism the history of our understanding of charge. The problems I outline below in our understanding of charge have led to our problems in understanding the nature of light.
Relating to the oil-drop experiments: In experiments10,11,12 whose authors claim that whole electrons are released in the photoelectric effect, micro-drops were balanced in the same apparatus used by Millikan to measure charge. The drop’s velocities in response to ultraviolet light were quantized.
Issue 1: Interpretation of these experiments, plus Millikan's determination of e, are important because physics has made the assumption: if charge assumes stable quantization as part of atoms, it is similarly stable and quantized in free space. This assumption is most responsible for the premature rejection of alternatives to the photon model because physicists argue that a whole photon of energy is needed to knock out a whole electron, according to Einstein’s model of the photoelectric effect.13
Issue 2: Millikan considered the loading theory10 but did not consider a threshold model of charge. The threshold concept allows sub-e to exist but provides stability at multiples of e. Quantization altogether excludes the existence of sub-e. Sub-e is still possible during the acceleration time of the oil drop. Another way to say this is that they considered only a very limited form of the loading theory whereby the loading always starts from an initially unloaded state. Furthermore, Millikan10 and others rejected the loading theory because they could not picture a mechanism whereby resonant absorbers could take on energy from slightly off-resonant incoming radiant energy
Issue 3: a great confounding factor in these experiments is that they were done in an atmosphere containing oxygen and/or mercury. The quantized velocities may have been caused by the drop’s acquisition of a whole electronic charge from an ultraviolet-generated positive ion suddenly attaching to the drop from the surrounding gas, instead of a whole electron suddenly exiting the drop. Whole threshold values of e, as well as sub-threshold values, are included in TRM.
These oversights and problems reduce the strength of the message from those experiments. The writings of Planck,14 Sommerfeld & Debye,15 Bohr-Kramers-Slater,16 Millikan,10 and Compton,17 are examples where physics considered alternatives to the photon model.
Experimental Tests of Quantum Mechanics Using Gamma-Rays
I have devised a method of performing Einstein’s thought experiment that overcomes the shortcomings of Givens’ experiment and avoids the complexities of Clauser’s experiment. The experiment uses gamma radiation from spontaneous nuclear decay detected by two detectors in coincidence.
With γ-rays, the duration of emission being much shorter than with visible light, the time between adjacent emissions is discernable to the detection process. It is this pulsatile nature that I am taking advantage of and is required for the effects of the following experiments to be observed. By comparing a chance rate Rc with an experimentally measured pulse overlap rate Re, it is easy to distinguish between classical and QM models of light. If either light really consisted of photons, or if light always deposited itself in a photon’s worth of energy, it would be a quantum mechanical wave function Ψ that would split. The only source of overlapped events would be chance. The alternative to QM is that an hν worth of light is emitted as a laser-like classical pulse. It spreads, splits and completes a loading that can trigger events in coincidence at a rate that can surpass chance. If the source is too far from the detector, the effect will not work, the beam would spread, and everything would look probabilistic as usual. The explosive emission with continuous absorption model was first proposed by Planck14, 18, 19 and is called the loading theory. In the loading theory and all of Planck’s works (contrary to many second-hand accounts), Planck had E = hν as a property of matter, not light. If E = hν was a property of matter, it implies that the detection event will have energy proportional to the frequency of light and that light would be classical and relativistic, but not quantum mechanical. The purpose of this experiment is to determine whether E = hν applies to matter as a loading effect, or to light by QM. With two detectors, the chance rate of two events is expressed by1, 4, 5, 20
R2c = 2τRtrRan, (1)
where τ is the duration of synthetically generated pulses preceding an AND gate, and Rtr and Ran are the singles rates of the trigger and analyzer detectors described below.
The γ sources used were 10 μCi of 109Cd and 1 μCi of 57Co. These were activities at purchase and had decayed ~ 50%. Detectors used were NaI(Tl) scintillators and high purity germanium (HPGe). I predicted 109Cd would work well because it emits a distinct low “energy” γ at 88 keV with no higher “energies” present to interfere. At this “energy,” NaI(Tl) detectors have a peak efficiency, and their photoelectric response is 15 times more than that from the Compton effect.1
Incidentally, terms like γ-ray “energy” and “eV” rely on the photon principle. Although the detector does deliver a pulse of energy, the photon principle implies that a photon’s wave function somehow collapses21 from macroscopic space with the ability to propel a whole electron. I use “eV” only for the reader’s convenience. My experiments say we should be using a frequency instead of an energy scale. If I say the detector delivers energy, I mean the energy of the pulse from the detector and not the “energy” of a photon hitting it. Particle-oriented language and assumptions presently dominating physics must be carefully set aside in order to understand the message of these experiments.
The experimental variations to be described cover (1) two detectors in beam-splitter geometry, (2) two detectors in tandem geometry, (3) coincidence gated energy spectra, (4) two-detector time spectra, (5) use of different radioactive isotopes, and (6) single detector anomalous sum-peak detection. All experiments (except 7/26/02 in Table 1) were performed within a lead shield of my own construction. The shielded chamber is 12 inches dia. by 15 inches long and 2 to 3 inches thick, lined with 1 mm tin and 3 mm copper. In a region of interest from 56 to 324 keV, the count rate inside the shield was 1/31 of the ambient background read outside the shield, and no meaningful peaks were present.
HPGe spectrums
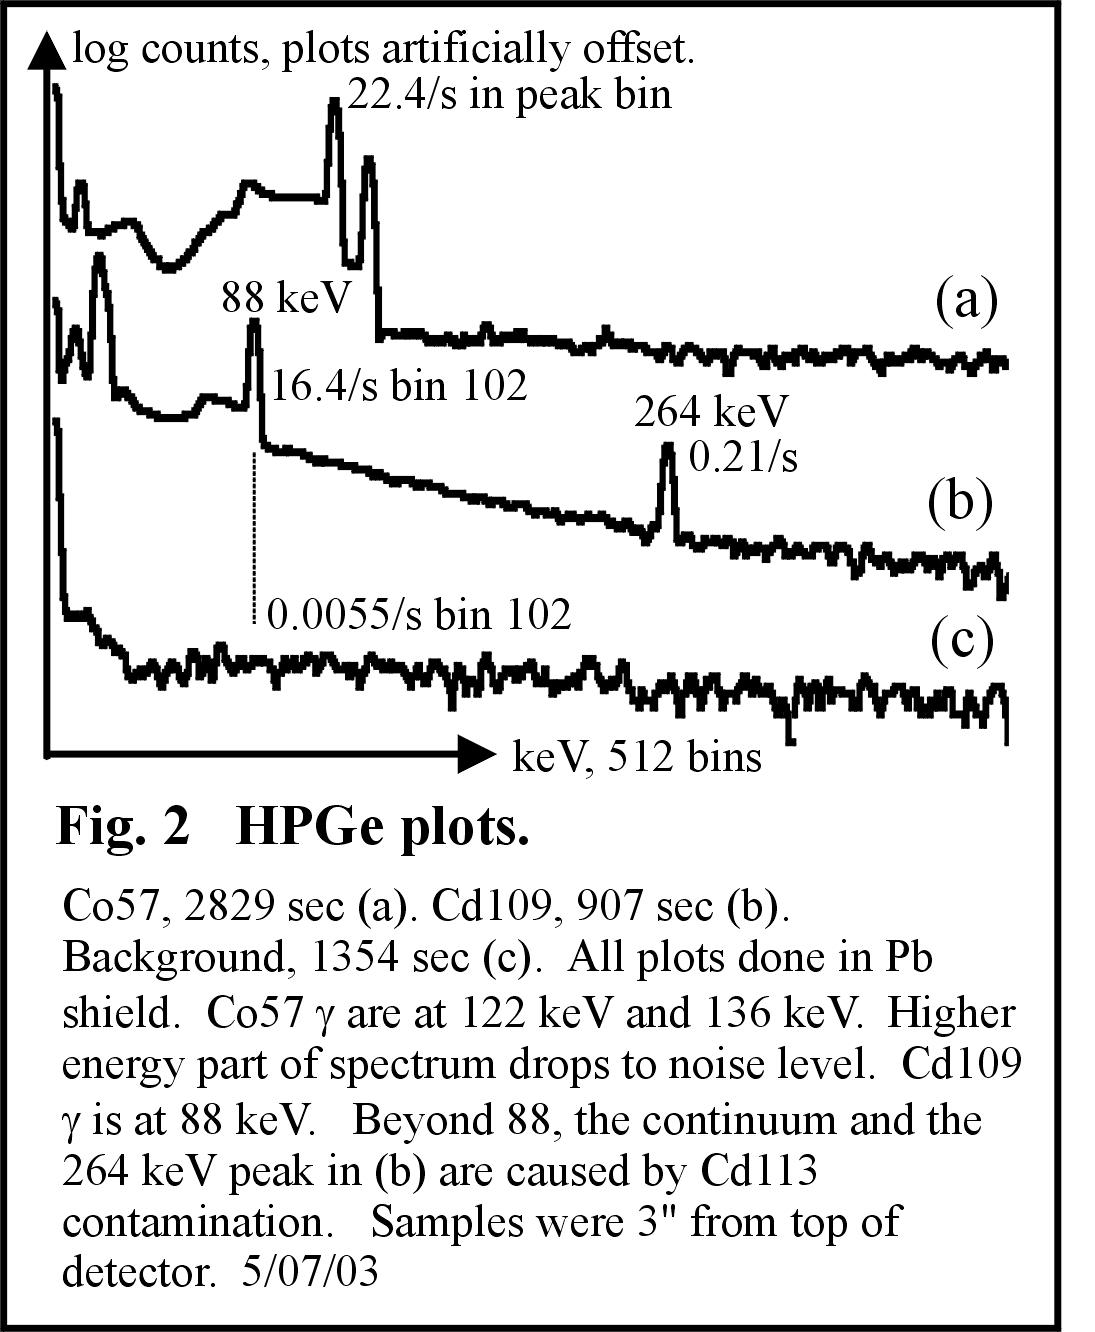
Spectrums of 109Cd and 57Co, shown in Fig.2, were taken with a Canberra GR1520 reverse electrode HPGe detector inside the Pb shield. It was found that the 109Cd sample was contaminated with 113mCd (m = metastable) that produces a 264 keV peak and a continuum from 88 to 264 keV. I learned that this contamination is present in all commercially available test isotopes of 109Cd. This discouraged my attempt to detect an anomalously large sum-peak that I had predicted for this isotope. The 57Co source did not have this kind of contamination, but it does have two closely spaced gamma photopeaks. The 57Co “energy” level diagram, undoubtedly devised from coincidence tests, shows separate pathways to these γ emissions, which means that these two γ occur independently. Therefore a coincidence test using NaI(Tl) detectors windowed over both γ “energies” can be treated as if only one hν was emitted at a time.
Two detectors in tandem with HPGe spectrum
By tandem, I mean it goes through one detector to get to the other. A Bicron 1.5 inch diameter, 1.5 inches long, NaI(Tl) scintillator with a hole through its side, a well-tube, was used as a trigger detector. The 109Cd source was in a ¼ inch diameter glass tube and sheathed with a 5 mm thick Cu cylinder with a 5 mm hole (initially) in its side. The Cu was a filter to keep only γ-rays that would pass through the trigger detector and toward the HPGe detector, which was used as an analyzer detector. Gamma radiation must pass through the trigger detector to reach the analyzer detector. The trigger detector preamplifier used an LT1222 op-amp with a limiter feature. The gain of the amplifier was set so as to limit the amplitude of electrical pulses caused by 600 keV (and over) detector events. This was found necessary to eliminate large cosmic-ray pulses that cause a bounce in the shaping amplifiers that could sneak a pulse through the SCA (single channel analyzer) windows. This limiter feature is not available on commercial preamplifiers. Each component in my block diagrams was adjusted and tested to perform to my critical standards.

In all of my experiments, the trigger SCA window size never exceeded 40% of the window center level, as read either with a storage scope or a multi-channel pulse-height analyzer (MCA). The analyzer SCA window was widened to observe the spectrum of what passed through in coincidence, as shown in Fig. 3. Following the SCAs were homemade one-shots with delay and width control to overlap pulses fed to an Ortec 414A coincidence NIM. The width of pulses overlapped in the 414A was τ = 100 ns. The 414A led to the gate of a TN-7200 MCA that recorded pulses from the analyzer detector shaping amplifier via an analog delay line. The adjustment of overlapping two 100 ns pulses was aided by a signal injector system and by a final adjustment with 22Na, which emits a pair of annihilation hν.
Table 1. Spectrums gated by second detector with SCA windowing photopeak
S o u r c e | De- tector | instrument | Geo-mety | τ ns/ (gate pulse) | Rtr narrowSCA on (# from trigger tube)/s RAn | Ran wide SCA (# from analyz tube in photo-p bin)/ (bin-s) | Re gated (# in photopeak bin)/s | Rc = 2τRtrRan (expected # in single photo peak bin)/ sec | Re/ Rc | RAllAn un-gated (# in SCA windo from anal- yzer)/s | ReAll gated (# in all of gated spect- rum)/s | RcAll=2τRtrRAllAn (# calc for whole gated spec)/s | ReAll/ RcAll Degree above chance for whole gated spec-trum | M C A run time sec |
Cd 109 | HPGe & well NaI | MCA | Tan-dem | 100 | 1289 | 3 at photo-pk bin | 0.0056 | 8E−4 | 7.2 | 5.56 | 0.0439 | 0.0014 | 31 | 804 |
2”NaI-3”NaI | MCA | Al Scat-terer | 80 | 211 | ~ 65 calced at PhPk | 0.034 | 0.002 | 15 | 3262 | 0.32 | 0.11 | 2.9 | 45.2k | |
HPGe | Le | Ge Scat-terer | 400 | 434 | 1.17 | 0.0046 | 22E−6 | 206 | 60/s in 51 bins | 0.063 | 0.0011 | 58 | 7.44 | |
Le | C Scat-terer | 400 | 207 | 0.45 | 0.0025 | 37E−6 | 66 | 23/s in 51 | 0.028 | 0.0019 | 14 | 3.64k | ||
Le | Al | 400 | 192 | 1.22 | 0.0033 | 94E−6 | 35 | 62/s in 51 bins | 0.015 | 0.0048 | 3.2 | 7.20k | ||
Le | Al | 400 | 192 | 1.17 | .0013 | 89.8E−6 | 14 | 60/s in 51 bins | 0.0114 | 0.0046 | 2.48 | 7.54 | ||
Le | C with mag. | 400 | 147 | 0.121 one bin/s | 8.82 | 7.11E-6 | 124 | 24/s | 0.0095 | 0.0014 | 6.7 | 10.2k | ||
Le | C | 400 | 141.68 | 0.1326 | 5.16 | 7.515E-6 | 68.7 | 26.13/s | 0.0084 | 0.0015 | 5.65 | 52.3k |
I took special care to eliminate distorted pulses from the trigger detector by building a high speed pile-up rejector of my own design. An analog oscilloscope was rigged with a PMT covering its display, and a black tape mask was cut to fit the display face to hide correctly shaped pulses. Pulses appearing above the mask made light that sent a signal to an SCA and then to the anti-coincidence input of the 414A module. The scope was triggered by the trigger SCA. Pile-up elimination was approximately 1% of the singles rate. For all other tests described below, this method was replaced with a mask-test on a LeCroy LT344 oscilloscope. Special care was also taken to evaluate mis-shaped pulses from the analyzer detector that fed to the MCA. With the LeCroy, I found that less than 1% of these pulses occurred outside the 100 ns coincidence window used here. This rate of false pulses would not significantly affect the pulse height spectrum and resulting statistics. In normal practice, an amplifier with a pile-up rejection feature is used, but the digital oscilloscope method has the advantage of recording every pulse to determine if there is any form of distortion.
Counters from each SCA and from the coincidence module recorded Rtr, Ran, and the experimental rate Re. As expected, the analyzer spectrum revealed (MCA37) a distinct peak only one bin wide at 88 keV with 0.0056 counts/s. With Rtr = 1289/s, Eq. (1) gives Rc = 1/(1293 seconds). Therefore chance is exceeded by Re/Rc = 7.2 (see Table 1). Any such calculation greater than unity puts QM on the defensive. A greater ratio was obtained using counts from the whole analyzer spectrum. None of this is understood by QM. At 2x the 88 keV photopeak, the gated spectrum clearly shows a feature not present at all in the singles spectrum. The 2x peak is predictable from the loading theory. If a single γ emission can trigger an event in each of two detectors, it could trigger two events in one detector. Even a 3x feature is detected above the noise floor.
The presence of 113mCd in the source could conceivably generate a pair of events in coincidence above chance from its 264 keV gamma undergoing a series of Compton scatterings. If this were the case, a broad spectrum of pulse heights would be present in the spectrum of Fig. 3. The incredible gated single-bin peak of Fig. 3 shows this is not the case. The single bin response in the gated spectrum at 88 Kev indicates that Compton scattering is not the dominant manner of extracting the trigger detector signal.
Coincidence-time distribution of 109Cd in reflection geometry
A series of tests were undertaken (see Table 2) with a time to analog converter (TAC). A TAC converts time between a start detector pulse and a stop detector pulse and converts it to an analog pulse height for the MCA. The TAC method was far easier than the coincidence gate (414A) method and shows the effect persists when both SCA channels are narrowed onto the primary γ. Here the chance rate can be calculated from20
Rc = τbRstartRstop (2)
where τb is the time resolution of one bin on the MCA. Careful examination of my reported Rstart and Rstop will show that calculated rates differ from rates read from the side wings of the Δt plots. This is because the TAC has dead time. Separate tests confirmed that Eq. (2) gave the same rate as from the measured noise present in the side wings. With plots that reveal a significant noise floor, I use the side wings to measure the chance rate. With plots with hardly any noise, I use counters and Eq. (2) to calculate the chance rate. I tested Eq.(2) with a periodic pulse generator inserted at the start TAC input (also at the stop).
The resolution of the NaI detector cannot distinguish Compton scattering from Rayleigh scattering (elastic, coherent, no frequency change). I model the mechanism as Bragg scattering,

Table 2. Two detector Δt tests * corrected for cosmic ray background
Source | Detectors | File of MCA plot | Geometry | τb ns/ bin | Rstart (detec tor starts) /s | Rstop (detec tor stops)/s | Rpeak (# in peak bin)/s | Rc (# in wings)/ (bin-s) | Rpeak /Rc | Rbump (# in whole bump)/s | Rbump/Rc | MCA run time s | Bump width ns | |
Cd109 | Well- NaI & 2”NaI | 46 #1 | Scatter | 0.8 | 11E−4 | 5.2E−4 | ~2 | 9.2E−4 | 1.8 | 7158 | 84 fwhm x2 | |||
46 #2 | Scatter 1/8” Al | 0.8 | 1223 | 3108 | 17E−4 | 7.9E−4 | ~3 | 11.7E−4 | ~2.3 | 46.5k | ~80 fw | |||
46 #3 | Signal gen on start | 0.8 | 1200 | 2900 | 7.7E−4 | 11.7k | ||||||||
50 #1 | Tandem 5 mm hole in Cu | 3.3 | 1400 | 91 | 14.5E−4 | ~2E−4 | ~7 | 6.7E−4 | ~3.4 | 10.3k | ||||
50 #3 | Tandem 2.5 mm slanted hole in Cu | 3.3 | 10.3E−4 | 5.4E−5 | 18.5 * | 5.34E−4 | 9.8 | 114.5k | 172 fwhm x2 | |||||
50 #4 | Signal gen on start | 3.3 | 624 | 1344 | 0.56E−4 | 4284 | ||||||||
51 #3 | Tandem Tightened SCA from MCA50 | 3.3 | 164000 | 50 | 21E−4 | 0.66E−4 | ~31* | ~9E−4 | ~14 | 19.9k | 132 fwhm x2 | |||
None | 55 #1 | Background cosmic ray | 3.3 | 0.3E−4 | 0 none in wings | 0.1E−4 | 56.7k | ~92 fwhm x2 | ||||||
Cd109 | 55 #2 | Tandem 2”NaI start (swapped) | 3.3 | 775 | 24 | 10.7E−4 | 0.581E−4 | 17.9 * | ~6E−4 | ~10 * | 44.9k | 146 fwhm x2 | ||
Co57 | Well- NaI & 2”NaI | 47 #1 | Tandem Pb sheath in well tube | 8 | 48 | 65 | 6.8E−4 | 9.2E−6 | 68 * | 2.4E-−4 | 24 * | 38.4k | 96 fw | |
47 #2 | Tandem Tightened SCA from #1 | 8 | 20 | 16 | 0.0019 | ~ 0/s 2 in wings | 190 * | 6.8E−4 | 68 * | 4229 | 56 fw | |||
49 #1 | Tandem | 6.6 | 17 | 20 | 8.6E−4 | ~4E−7 5 in wings | ~30 * | 2.4E−4 | 8.6 * | 27.7k | 145 fw | |||
None | 49 #2 | Background cosmic ray | 6.6 | ~1E−4 | 0 none in wings | 0.28E−4 | 39.9k | 92 fw | ||||||
Co57 | 49 #3 | Scatter | 6.6 | 445 | 367 | 9.7E−4 | 2.8E−4 | ~3 * | 5.2E−4 | 1.6 * | 15.3k | 106 fw | ||
49 #4 | Scatter 3/4”Al | 6.6 | 122 | 110 | 2.8E−4 | 3.6E−5 | 4.3 * | 1.8E−4 | 2.8 * | 70.1k | 86 fw | |||
similar to Schrödinger’s treatment of the Compton effect.17 In any case, conventional wisdom in physics would not at all encourage me to test if a γ-ray scatters and transmits at the same time; because γ-rays are thought of as photons To insure well-behaved pulses in all of these time spectrum plots, the SCA outputs also drove a coincidence gate to trigger the LeCroy scope to perform a mask-test on each pair of pulses from the preamps, as shown in Fig. 4. This schematic is similar to that used for the gated spectrum test. A typical mask-test showed less than 1% violations within a 500 ns coincidence window. The SCA windows are approx. 30% of full scale.
Plot MCA46 #1 used a 1 mm Cu sheet bent 90 degrees around the 109Cd source; #2 used a 1/8” thick right-angle stock of Al. Results in Table 2 show that this Reflection scattering method worked, but the tandem method described next worked better.
Coincidence time distribution of 109Cd in tandem geometry
In file MCA50 #1 (see Table 2) I get immediate results but I was dissatisfied with the signal to noise ratio. I guessed that too many overlapping γ-ray pulses in the trigger tube might obscure my effect. For #3 I made a new copper insert with a hole, half the previous diameter (2.5 mm) and drilled it at an angle. The well-tube was tilted at the same angle allowing the γ-rays to travel a shorter-path in the corner of the NaI phosphor. The only difference between the two plots is the Cu insert. The degree above chance improved, confirming my hunch, but it would be good to repeat the first experiment a longer time to be sure. For plot MCA51 (see Fig. 5) I improved the design of the preamplifiers by using a CLC404 op-amp at the first stage, which removed some noise. I also tightened the SCA window to about 25% of full scale. The degree above chance was improved by these modifications, demonstrating that my effect is not caused by either noise or a wide SCA setting.

In plot MCA55 I returned after some adjustments to the 109Cd tandem test but swapped which detector drives the TAC start and stop. Compare this with the similar MCA50 #3 to see that this made no substantial change in the degree above chance. In MCA50 #1 I did a cosmic-ray background test and used this as a correction factor.
Coincidence time distribution of 57Co in tandem geometry

It was very important to show that this γ splitting effect was not a special property of emissions from 109Cd. My first attempt with 57Co just gave noise. Then I realized it was OK to use Pb to aperture the beam because the Pb x-ray fluorescence line could be windowed-out by the SCA. This is why I used Cu with 109Cd. I fashioned a Pb insert for the well-tube and ran the experiment, giving plot MCA47 #1. For #2 the only change I made was to tighten the SCA from approx. 35% used in #1, to approx. 20% of full scale. Referring to Table 2, the degree above chance climbed from 68 to 190. It seems that there was some Pb fluorescence in plot #1 that was picked up in the wider SCA window that caused noise, and that noise was eliminated in plot #2. Plot MCA49 #1 used 57Co with tandem detectors and was very successful (see Fig. 6).
Recent Tests with two HPGe detectors
Recent preliminary tests with two HPGe detectors have shown that the wide spectral response of the NaI trigger tube did not cause an anomalous artifactual response. The count rates and degree above chance for all these tests are shown in Table 1. Every test using 109Cd broke chance, either by using peak-bin rates or by windowed-spectrum rates. These tests also show that the scattering-type is mostly Rayleigh as opposed to Compton. 109Cd was scattered from Al, Ge, and C, where the undeflected component was detected in coincidence with the deflected component at rates surpassing chance. Data for Ge and C are shown in Fig. 6. The two detectors were at right angles to each other, with the scatterer taped in front of the trigger detector. 109Cd was in a copper collimator aimed at 45o to the trigger detector. The undeflected SCA window was 3.4 keV. The LeCroy scope was used for pulse height histograms of pulses from the Ortec 460 and triggered by the two SCA’s fed to a home-made coincidence gate set to τ = 400 ns. The LeCroy scope monitored each coincidence-triggered pulse shape to ensure that pile-up and ringing were not present. The chance rate for the 51 bin wide windowed spectrum is Rc = (400ns)(3.76M)(466K)/(7.44Ks)2 = 0.00113/s. The windowed experimental coincidence rate Rew = 0.063/s; Rew/Rc = 58 x> chance. The peak bin rate Rep 0.00457/(bin-s), giving Rep/Rc = 206 x> chance. The large setting of τ = 400 ns was done for experimental convenience and could have been set narrower to make the degree above chance even greater.

A temperature dependence test of the unquantum gamma-ray split was undertaken, as shown in Fig. 7. A 3/8” slab of Al was surrounded with styrofoam, with the bottom half of the foam formed as a bucket to hold liquid nitrogen (LN), and the top half as a ¼” of insulation. The upper part of the Al plate was also wrapped in packaging tape, so moisture could not enter and form inside the scattering region. The apparatus was designed so that pouring LN would not require moving any components. I could tell LN was present during the cold test by listening to it boil. A remarkable effect is readily seen in the spectrum, where at half maximum the peak narrowed a factor of 1/3 when cooled., There were no other physical or instrumentation variables to account for this. External cold does not affect the detectors because they are already cooled internally by LN. In the peak bin the ratio of rates were Rcold/Rwarm = (0.0033/s)/(0.0013/s) = 2.53. In the ungated spectrum, the cold/hot ratio rates in the peak bins were 1.07, and the cold/hot ratio of peak to Compton ratios was 1.03. So here we have a method of detecting a property of the material that is not at all expressed in the conventional gamma-ray spectrum. An enhanced and sharpened coherent Rayleigh-scattering interaction is expected at lower temperatures due to less thermal motion of the atomic-bond and free charge-wave that the gamma reflects from.


This is all good news. It means that we can tell at the hν level if the light that scattered was by a process that did or did not recoil the scatterer. It implies that if a gamma-ray was apertured to a fine point one can tell the state of the electron that performed the scatter, in violation of a famous Heisenberg microscope argument. In a crystalline volume, a gamma-ray diffraction pattern could decipher an extra dimension to a spatial pattern of atoms and bonds. This is a new probe capable of many detection modes. The fact that chance was broken with carbon indicates usefulness in molecular biology. The usefulness is that a sensitive measure of the peak to Compton ratio in the unquantum-effect spectrum shows information of the bonds. This should change for different organic crystal orientations.
A gated energy spectrum test was performed using a magnetic field, with results shown in Fig. 8. A 1.5 cm cube of ferrite was fabricated in a magnetic circuit made of sawed transformer parts and neodymium magnets. It was designed so that stray gamma would not be near the magnets, which could be removed for the control experiment. Using a 26 bin section to the left for the Compton region and the bordering 12 bin section for the peak (straddling the peak) region, the per-bin peak/Compton ratio for the non-magnetized test was 1.08 and that ratio for the magnetized test was 0.76; a 42% shift to the peak with no magnet. With no magnet, Compton scattering is comparable with Rayleigh indicating unbound charge in this substance. With the magnet there were more scattering sites shifted to the free charge wave; just what we would expect for a magnetizable material. Much more needs to be done with different magnet orientations and materials. A stronger radioisotope source would considerably shorten the test times and enhance resolution.
Using the same geometry as for Fig. 8, the opposite results were obtained with carbon, as shown in Fig 9. This carbon was from motor brushes and was tested to be free of iron impurities by hanging it by a string near a strong magnet. Evidently, the Compton-downshifted region was suppressed by the magnetic field while the unshifted region was enhanced. The magnetic field is perpendicular to the incident gamma path and in the plane of scattering. Counts for the Compton shifted region are marked and listed (totp) by the Lecroy scope. If we conservatively take a region of the unshifted peak at 6 bins wide, the per-bin peak to Compton ratios P can be calculated and compared Pmagnet/Pnomagnet = 1.4. ~40% enhancement of the peak with the magnet. The exact position of 88 Kev was not taken but was near the peaks of these spectrums. Obviously, there is a much more interesting investigation to be done here. The effect of a magnetic field on gamma scattering was attempted by A H Compton but was not observed by him. This failure was part of the evidence that convinced him to consider the point electron model, whereas the alternative model he was hoping to see evidence of at the time was the ring electron. At 88 Kev, λ = 15x10−12 m, smaller than the distance between atoms. The inner electrons are exposed to a strong magnetic field from the nucleus, so I do not expect to perturb this easily. I expect the scattering is taking place in the bond between atoms, more easily affected by an external field. Evidently, we have a probe of a fine structure component of atomic bonds. The geometry of these tests was chosen with the idea that Bragg scattering would take place between planes of ring-shaped charge-waves oriented by the magnetic field.
With the ferrite, a ferromagnetic substance, the magnetic field enhanced Rayleigh scattering; with carbon, a diamagnetic substance the magnetic field reduced Rayleigh scattering. Relating the degree of recoil motion of the charge wave to these magnetic properties offers a new kind of material science probe.
A time spectrum with τ = 400 ns was performed with 241Am, which produces a 59 Kev gamma from alpha decay. A 3/8” thick Ge scatterer was placed in front of the trigger HPGe detector. The Am source was a ½” vial placed in a Pb block drilled to fit. This “energy” has a high photoelectric effect efficiency with HPGe detectors, so one might expect a strong response. No hint of coincidences beyond the flat noise from chance was seen in 2.3 hours of data collection. This is an important control to show that not all gamma-rays are created equal. Evidently, the alpha decay process does not produce gamma with the temporal or spatial property necessary to trigger coincidences.
Cosmic-ray coincidence time test
In plot MCA49 #2, there was no source inside the Pb shield, but a low level of coincidences was still detected. This is assumed to be from cosmic-rays that interact with the Pb shield and shower x-rays toward the detectors in coincidence. This was used as a background rate that I subtracted from other 57Co tests. No background coincidence events were detected outside the 178 ns window shown, and the total rate was 17 pairs/39906s ≈ (1.5 event-pairs)/hour. This background test was also performed using SCA window settings of tests with 109Cd. Similar results were found and recorded on file MCA55 (see Table 2). My gamma-splitting effect is not some cosmic-ray artifact.
Coincidence time distribution of 57Co in scattering geometry
Plot MCA49 #3 (see Fig. 6) gave a barely visible effect using γ from 57Co scattering from a 1/8” thick aluminum angle bar; perhaps it only needed more time to average out the noise. In plot MCA49 #4, everything is the same except the thickness of the Al scatterer was increased to ¾ inch, and the run-time was longer. Here the effect is readily observed at 4.3 times greater than the calculated chance rate. Though the singles rates were attenuated, the thicker Al gave a greater gamma-splitting coincidence effect, as expected. I assume this is a combination of Rayleigh and Compton scattered light because the NaI detectors do not have the resolution to make this distinction.
Coincidence time distribution of 137Cs in tandem geometry
In this important control experiment, the gamma “energy” at 662 keV interacts with the NaI detector predominantly by the Compton effect. The time spectrum just looks like perfectly flat noise, and there is little need to show it. A one-inch right cylindrical NaI was the first detector, connected to the TAC stop, and a two-inch diameter NaI was the second detector connected to the TAC start. Rates were 88.3 true starts/sec and 302 stops/sec, and the time spectrum was accumulated for 37.8 ksec. The 137Cs source was a Spectrum Techniques standard ½ inch dia. plastic tube with the isotope at the end. It was placed in a lead block drilled with a ½ inch hole butted up against the first detector, with the source 1 inch down the hole. The TAC resolution was measured by using the signal generator’s timing outputs monitored on the LeCroy, while the signal generator’s shaped outputs were sent to the preamplifiers. This makes a spike in the time spectrum. Then the delay in the signal generator can be adjusted to make another time spectrum spike. With these two settings, measuring the time difference on the LeCroy, divided by the bin separation between spikes, gives ns/bin. This is how I did all my TAC time resolution measurements. The time resolution for this test was τb = 12.98 ns/bin. Using Eq. (2) gives 3.46x10⁻⁴ events/(bin-sec). Measuring the average value across the whole TAC spectrum gave 3.50x10⁻⁴ events/(bin-sec), which is a reasonable match, considering an error source at the LeCroy time measure.
This null result is strong evidence that the effect of this paper is about the photoelectric effect. It also explains why my unquantum effect does not usually show anomalous sum-peak spectra. If there was any experimental artifact causing my effect, it would have shown itself in tests of this sort.
Single detector spectrum showing anomalous sum-peak in 57Co
If two detectors show coincidences, defying the photon principle, I expected to see the effect using only one detector, as an anomalously large pile-up peak in the spectrum. Since 113mCd obscures this part of the 109Cd spectrum, it is more practical to attempt this measurement with 57Co. In preparation, it is useful to understand a normal pile-up effect in a spectrum. The pile-up rate at twice the photopeak “energy” is readily calculated from1, 20
Rpu = τpulseR2.. (3)
Table 3. Single detector sum-peak tests
source | detector | MCA File | τpulse Pulse width at shaping amp | R At photo peak #/s | Backgnd at shelf #/(bin-s) | Re at shelf #/s | Rpu = τR2 #/s | Re/ Rpu |
Cs 137 | 2”NaI 3” from source | 57 | 1.16 μs calced | 367 | 0.00348 | 0.16 | Set to 1.6 | Chance is assumed |
Co 57 | 54 | 1.16 μs | 79 | 0.0224 | 0.0370 | 0.0072 | 1.98 corrected for pile-up (−2%) & background |
With 137Cs, the photopeak at 662 keV and its pile-up peak are well studied and known to conform to chance. I tested this, and also studied the sum peaks of 57Mn and 22Na and found only chance rates. This is to be expected due to the lower photoelectric efficiency with NaI(Tl) at higher keV. At these keV we can use Eq. (3) to calculate τpulse . To take this spectrum, I lowered the PMT high voltage so that the preamp limiter would not block the larger pulse height and also so all the amplifiers would respond about the same at 662 keV as it would at 122 keV. I also gated-out the photopeak with an SCA when measuring the pile-up region and took a background reading. Gating-out the photopeak was done to remove dead-time errors. Using Eq. (3) for the data shown in Table 3 and MCA57 and subtracting background in the pile-up region gave τ = 1.16 μs. From the LeCroy oscilloscope, the FWHM of pulses from the shaping-amp agreed at 1.1 μs.
For the 57Co spectrum of MCA54, I similarly gated the MCA for the sum-peak region reading but took an extra precaution by using the SCA to also trigger the LeCroy to perform a mask-test to be used as a pile-up correction. This test showed 2% should be subtracted from the sum-peak count of MCA54 #3. Recall that even though 57Co has two peaks, hidden by the low resolution of the NaI detector, it can be treated as one gamma source because they are emitted independently. Putting the numbers together gets Re = [0.037−(0.037x0.02)] − 0.022 = 0.014, and Re/Rpu = 1.98 x > chance. This calculation gave a small advantage to “chance” because a pile-up correction implies a shorter τ, but my effect rises above chance regardless.
Additional confounding factors addressed
It did occur to us to check for the possibility of stimulated emission at the source. A calculation was performed using Mossbauer theory1 and the Debye temperature of cadmium to see if resonant absorption, a requirement for stimulated emission, was possible at room temperature. Non-resonant absorption is not reasonable to consider because lasers need resonant absorption for stimulated emission, it would need to be laser-like to make the gamma go in the same direction, and we would have noticed many more coincidences beyond chance in other experiments. Resonant absorption is easily off-resonance due to nuclear recoil Doppler down-shifting the emitted gamma. Resonant absorption needs to satisfy the condition that the recoil energy R = [(88keV)^2] / [2Mc^2] << kT, where, M=mass of the nucleus, k=Boltzman’s, T=Debye temperature = 209K for Cd (from Am Inst of Phys handbook). With R=0.034, kT=0.018, resonant absorption cannot happen at room temperature.
Both isotopes I used are not expected to support resonant absorption. Mossbauer says1 that low temperatures are necessary to get measurable effects if R ≅ kT, but R is already too high by a factor of 2. With 57Co it is only the lower “energy” 14.4 keV emission that is recoilless because a resonant link to the crystal lattice removes recoil, making emission monochromatic and absorption resonant.
Another way to eliminate the case for multiple coincident emissions as the cause of my effect is as follows. In Fig. 3 there is a peak at 2x 88 keV that requires three detections in coincidence: two events make that peak, plus one in the trigger tube. That 2x peak had 0.0013/s in just one bin. There is more than one bin at the 2x position at about the stated rate so let's conservatively take 5 bins to get 5 x 0.0013 = 0.0065/s detected in triple coincidence. Now go to the ungated detection rate at 88 keV and see 3/s, and realize that these detectors only have about 10% efficiency. Counting the other two detections to make a triple coincidence means that (3 per sec)/100 = .03/s would, in this scenario, need to be emitted three at a time aimed toward the detectors. That makes the ratio (detected/predicted) = 0.0065/0.03. This means every 4.6 emissions would be emitted in triplicate in the same direction. This is a large fraction. With stimulated emission or even a collision process, the probability of such a thing happening all in the same direction would be enhanced if there was more volume of isotope for the gamma-ray to interact with.
I did a test with a line of 109Cd to test for an enhanced volume effect. I heated and squeezed the end of a glass tube to make a chisel-shaped trough and sent it away to be filled with 109Cd. I then did tests to see if the sum-peak (2x) part of the gamma spectrum changed when the trough axis was aimed at the detector and was perpendicular to the detector. With such a large ratio of 1/4.6, there would have been a noticeable effect at the 2x part of the spectrum, even in the presence of 113mCd contamination. There was no effect. If something less coherent than stimulated emissions, such as a collision process, was at play the emissions would go in random directions and that would make the chances of coincident detection much lower than detected. The solid angle used in the test of Fig. 3 was ~0.5 radians from the source to the detectors; 0.04 of a sphere. This would be cubed and used as a correction factor greatly in my favor, leaving only a stimulated emission kind of effect (or at least something directional).
There are good reasons for the currently accepted theory of random nuclear emission. We are not able to trigger gamma emission. It is extremely that my effect could be due to some new form of stimulated emission or some new strange particle, for that matter, emitted from both 109Cd and 57Co. It is much more reasonable to question QM over a new kind of non-random gamma emission because QM was always paradoxical
There is an effect in photomultiplier tubes called satellite pulses whereby a light flash can stimulate a current pulse to be followed by a second smaller current pulse up to 3 μs later. A cosmic-ray could conceivably set off coincidences within the SCA window with such an effect. It is easy to test for this using the digital storage scope in mask-test mode to examine the time preceding the coincident pulse pair. The test was applied to the setup used for plots MCA51 for 109Cd with tandem detectors. There were zero pulses large enough to enter the SCA window in a block of 5 μs that precedes the coincident pulse pair from testing 4622 sweeps. Tests were also performed to see if the gamma source affects the PMT directly, and no effect was seen. As shown above, background, cosmic-rays, stimulated emission, lead fluorescence, and pile-up errors were addressed. Since my effect improves when lowering noise, SCA width, Pb presence, and background, these factors are not the source of the effect. There is no evidence of some confounding factor causing the effect.
How can it be that something so fundamental has not been done before?
There were many obstacles to overcome:
There are few isotopes that emit a lone low-“energy” gamma. If a higher “energy” gamma-ray is also present it will obscure the measurement. If the gamma-ray “energy” is not low enough, the photoelectric efficiency of the detector will not be high enough to reveal the effect.
Anomalously large sum-peaks cannot be detected with our higher resolution HPGe detectors, because of their lower photoelectric efficiency. So in this situation, where we think we see better, we see worse. HPGe does reveal the effect in two-detector experiments.
In the manufacture of 109Cd, had the process been developed to routinely purify out 113mCd, a sum-peak might not be hidden in the noise, and it would have attracted attention.
If the 57Co sum-peak calculated above was noticed before, it is not so impressive to inspire a research effort.
There is a momentum of thought that influences what gets published and taught in school. There are mistakes that have been propagated concerning the history and interpretation of past experiments2.
Concerning this very same experimental issue (is the photon principle conserved at a beam splitter?) one would need to have seen through the conceptual and experimental flaws of previous workers and ignored their conclusion.
Concerning most experiments in modern physics, one would need to see through the dominant paradigm, ignore the models used by our most famous experimenters, and freshly analyze their experimental setup and data in order to see what nature is saying, not people. Then one would need to solve the theoretical riddle, predict the beam-splitter effect, and understand how to look for it. In the electromagnetic spectrum, gamma-rays are thought to be the most like particles. One would need to understand how a wave effect can be seen with gamma-rays and may not be seen at lower frequencies.
Experimental Conclusion
In every experiment, where the detector’s gamma photoelectric efficiency exceeds Compton effect efficiency, chance is broken. Readily available graphs of absorption efficiencies for NaI and Ge show the degree photoelectric surpasses Compton for the isotopes I used. It seems that nature has provided only a narrow corner of available γ sources and suitable photoelectric detectors to reveal the effect, but that is all we need to continue advancing this research path.
It would be useful to continue this work with other low “energy” lone gamma sources, which are not readily available due to shorter half-lives from my research. Many more detector types and combinations of a similar theme to those described above will undoubtedly reveal insight and practical application to the unquantum effect. 57Co needs to be tested with HPGe gated in tandem, etc.
I expect that detection of the unquantum effect will decrease when the source is separated in distance from the detectors. The classical electromagnetic pulse would spread and lose intensity and its ability to trigger events. In this manner, one could link the solid angle spread with electromagnetic frequency. It has been suggested that my experiments violate conservation of energy. Future careful analysis should reveal in the time spectrums that the rate in the wings should lower to account for the rise of the effect at time zero. The experiments outlined here suggest many exciting future explorations to gain a more confident non-dualistic understanding of the microworld.
The Tables of data summarize my work. There was no sorting-out of experimental runs, with similar set-ups to those reported, that gave any evidence to QM. The effect is repeatable and robust, and since it works with two isotopes, it is not some strange special case. This experiment involved an intense two years in developing until I was confident confounding factors were eliminated.
If the persistence of this effect survives experimental repetition, it will require a fresh interpretation of our most famous experiments of modern physics. With this experiment, we now have strong evidence that the nature of light, even during an exchange of energy, is nothing like particles. It would go one way or another if it were a particle, but it does not.
The experimental finding here was something obvious and expected since 1905. We were warned against light quanta: “explosive emission, continuous absorption,” Planck;18 “…light quanta just won’t do,” Lorentz; “Let me say at the outset, that in this discourse, I am opposing not a few special statements of quantum mechanics held today, I am opposing as it were the whole of it, I am opposing its basic views that have been shaped 25 years ago, when Max Born put forward his probability interpretation, which was accepted by almost everybody,” Schrödinger;22 and by “On a heuristic point of view concerning the production and transformation of light,” Einstein.13 The experiment had just never previously been perfected to see through the illusion.

Theory,
The original argument for light having a particle property is Einstein's model of the photoelectric effect.13 If there was a wave derivation, perhaps that would clarify things. First of all, Einstein did not derive the photoelectric effect equation;10, 23 the equation was a statement of his model. I present here a derivation from wave principles and avoid wave-particle duality by attributing the particle-like effects to non-classical properties of the charge-wave.
Consider replacing λΨ in de Broglie’s h = mevΨλΨ with λg, the length of either a beat or a standing-wave envelope in a charge-wave construct (see Fig. 7). An “electron” diffraction experiment will not distinguish between λg and λΨ . In place of particle electrons, consider me as resistance to acceleration of the beat, and vg as the velocity of the beat. I introduce the nondualistic wavelength equation:
vgλg = h/me = Qh/m. (4)
The structure of the Balmer equation of the hydrogen spectrum tells us that electromagnetic light frequency has something to do with internal beating difference frequencies. By using a trigonometric identity, the beating charge-wave is the product of a modulator wave M of frequency νo, and the average wave function Ψ. M also oscillates at the light frequency νL such that νL = νΨ2 – νΨ1. The modulator wave fits the beat and oscillates at two beats per wavelength: νL = vg/2λg = νo . This model assumes light fits with charge in all situations and that the difference-frequency phenomenon observed in the atom is due to a property of the charge-wave. Substitute the above equations into νg = vg/λg to derive the photoelectric effect equation (ignoring the escape potential): hνL = mevg2/2.
In the derivation above, the steps leading to the nondualistic wavelength equation are substantiated2 by noting that this equation aids in understanding the standing-wave solutions of Schrödinger's equation, whereby λΨ = λg , a wave derivation of the Compton effect equation, a matter wave derivation of the Planck distribution, and understanding how matter and antimatter annihilate [see Fig. 8, add(a) to (b)].
The photoelectric effect experiment does not resolve e or h, independently, so the message of the experiment should be written νL = Qm/hvg2/2, where Qm/h = m/h, or equivalently νL = Qe/hV, where Qe/h = e/h and V = electric potential. Similarly, define Qe/m = e/me . In this model, as the charge-wave escapes into space and thins out, the mass/action, charge/action, and charge/mass ratios are preserved in such a way that this thinning is not noticed in our experiments or equations (ratio concept). The constants h, e, and me here denote maxima (threshold concept). In a photocathode, as energy enters and leaves charge beats, the velocity vg and difference frequency (= νL) are set, and they set the properties of the escaping wave. By allowing sub-h and sub-e charge beats in free space, a photocathode may release an electron’s worth of charge, but it can thin out to account for diffraction effects.

Physicists have deciphered the individual constants h, e, and me in experiments with atoms, as in the black body and Millikan oil-drop experiments. The heavier nuclei being more particle-like balance the charges and cause a stronger threshold effect in atoms. In experiments that rely only on the threshold (not in free space), the Q ratios may not appear. But in the case of the free charge-wave, our experimental equations exhibit only these ratios: e/h in photoelectric and Aharonov-Bohm equations, e/me in J. J. Thomson deflection, and h/me in the Compton and photoelectric effects.
To preserve conservation of energy in the photoelectric effect, failure of the photon model implies the storage of electronic kinetic energy and that electrons are not like particles. The above experiment and my derivation of the photoelectric effect offer guidance. The obvious that the point electron model fails in diffraction and electron spin resonance guides us toward the idea of adding properties to the charge-wave to explain the particle properties of matter and light. This experiment and theory lead us to teachings similar to that of Planck18 and Schrödinger:22, 24 Energy is absorbed continuously and selectively by resonators of similar frequency until they reach an hν of energy, a threshold in a charge-wave beat or envelope. An hν οf energy is emitted in a burst, which in γ-rays seems initially directed and coherent, and spreads classically.
References
1. Alpha-, Beta- and Gamma-Ray Spectroscopy, edited by Siegbahn K., Vols 1 & 2 (North-Holland Publishing Co, Amsterdam, 1966) [see Davisson, Neiler and Bell, and Mössbauer].
2. Available at http://www.unquantum.com. “An understanding of the particle-like property of light and charge.”
3. Bohr N, Atomic Physics and Human Knowledge (Wiley, 1958).
4. Givens M P, “An experimental study of the quantum nature of x-rays,” Philos. Mag. 37, 335-346 (1946).
5. Clauser J F, “Experimental distinction between the quantum and classical field theoretic predictions for the photoelectric effect,” Phys. Rev. D9, 853-860 (1974).
6. Kocher C A, Commins E D, “Polarization correlation of photons emitted in an atomic cascade,” Phys. Rev. Lett.18, 575-577 (1967).
7. Feynman R P, QED (Princeton U press, NJ, 1985), pg 14.
8. Grainger P, Roger G, Aspect A, “A new light on single photon interferences,” Ann. N Y Acad. Sci. 480, 98-107 (1986).
9. Robinson A L, “Demonstrating Single Photon Interference,” Science 231 (Feb 14, 1986).
10. Millikan R A, Electrons (+ and –), (Univ. of Chicago Press, 1947).
11. Derieux J B, “Photoelectric effects on mercury droplets,” Phys. Rev. 10, 276-284 (1918).
12. Kelly M J, Phys. Rev. 16, 260-273 (1920).
13. Einstein A, “On a heuristic point of view concerning the production and transformation of light,” Ann. Phys. (Leipzig) 17, 144 (1905), in The Collected Works of Albert Einstein, translated Beck, A. (Princeton Univ. press, 1987).
14. Planck M, “Uber die begrundung des gesetzes der schearzen strahlung,” (1912) in ref. 19.
15. Sommerfeld A, Debye P, Ann. Phys (Leipzig) 41, 78 (1913).
16. Bohr N, Kramers H A, Slater J C, “The quantum theory of radiation,” Phil. Mag. 47, 758 (1924).
17. Compton A H, Allison S K, X-Rays in Theory and Experiment (Macmillan, London,1935).
18. Planck M, The Theory of Heat Radiation (Tomash, 1988) [1904 edition in German, 1913 edition in English translation].
19. Planck M, Physikalische Abhandlungen und Vorträge (F.R. Vieweg & Sohn, Braunschweig, 1958) [collected works of Max Planck; “Eine neue strahlungshypothese,” (1911), “Zur hypothese der quantenemission,” (1912)].
20. Knoll G F, Radiation Detection and Measurement (Wiley, 2000). [see pg 323].
21. Heisenberg W, The Physical Principles of Quantum Theory (Dover, New York, 1930).
22. Schrodinger E, The Interpretation of Quantum Mechanics (Ox Bow Press, Woodbridge, CN, 1995).
23. Sommerfeld A, Wave Mechanics (Methuen, London, 1930) pg 178.
24. Schrödinger E, Collected Papers on Wave Mechanics (Chelsea, New York, 1978); Letters on Wave Mechanics, edited by M. J. Klein (Philosophical Library, New York, 1967).
Acknowledgments. Special thanks to Ken Kitlas of Fremont CA for his suggestion in our conversation to use γ-rays, many helpful discussions, and his loan of experimental apparatus. Mike Kan, Robert A Wolf, Bob Hall, and my wife, Miriam, assisted.