Computer Vision Networks: a digital methodology by Janna Joceli Omena

Digital methodologies for
Building, visualising, reading and narrating computer vision networks
Janna Joceli Omena
Research project with the financial support
of a fellowship from the Center for Advanced Internet Studies (CAIS), Bochum, Germany.March-August, 2021.
Methodology developed between
March and August 2021 and first implemented
in the same year between September and December
with Erasmus Mundus Master students from
NOVA University Lisbon, Portugal. 21 students were part of the course Introduction to Digital Methods, the first course dedicated to this field in NOVA Social Sciences and Humanities School (NOVA FCSH).
First draft version: 31 August 2021.
Second draft version: 31 December 2021.
Omena, J.J. (2021). Digital Methodologies for building, visualising, reading and narrating computer vision networks.
Available from https://docs.google.com/document/d/e/2PACX-1vR8IZJKni6j1tG8KE872LS8HsqBVe-PKSIlqVG5mMAfR7vUKTzmW_T9TPSe7mA-GVwr0LwMS5I96dbq/pub
˚ ˚ ˚ ˚ ˚ ˚ ˚ ˚ ˚ ˚ ˚ ˚ ˚ ˚ ˚ ˚ ˚ ˚ ˚ ˚ ˚ ˚ ˚ ˚ ˚ ˚ ˚ ˚ ˚ ˚ ˚ ˚ ˚ ˚ ˚ ˚ ˚ ˚ ˚ ˚ ˚ ˚ ˚ ˚ ˚ ˚ ˚ ˚ ˚ ˚ ˚ ˚ ˚ ˚ ˚ ˚ ˚ ˚ ˚ ˚ ˚ ˚ ˚ ˚ ˚ ˚ ˚ ˚ ˚ ˚ ˚ ˚ ˚ ˚ ˚ ˚ ˚ ˚ ˚ ˚ ˚ ˚ ˚ ˚ ˚ ˚ ˚ ˚ ˚ ˚ ˚ ˚ ˚
Web link:
Google docs short link: http://bit.ly/ComputerVisionNetworks-method-recipe
Tried-&-tested I Erasmus Mundus master course 2021-22 I Intro2DM: Using vision AI to study collections of images 👩🏻💻 I Final projects: Political leaders, #blacklivesmatter, SDG; COP26 & Fast Fashion. I Other projects: Mapping deep fakes (2021), What is a meme, technically speaking? (2022), Let’s play war (2022).
Tried-&-tested I Erasmus Mundus master course 2023-24 I Intro2DM: Generative AI and Computer Vision Networks I Final presentation projects: TBA
⚠️ Important note: The proposed methodology is still under development, so if you use it for publication, please consider the references below.
Omena, J. J. (2021). Digital Methods and Technicity-of-the-Mediums. From Regimes of Functioning to Digital Research [Universidade Nova de Lisboa]. https://run.unl.pt/handle/10362/127961
Omena, J. J., Pilipets, E., Gobbo, B., & Chao, J. (2021). The potentials of Google Vision API-based networks to study natively digital images. Diseña, (19), Article 1.
Omena, J. J., Pilipets, E., Gobbo, B., & Chao, J. (2021). El potencial de las redes basadas en la API
Google Vision para el estudio de imágenes digitales nativas. Diseña, (19), Article 1.
Also, it is recommended to reference all research software or tools used. Check some references here and see below the main research software references.
Chao, T. H. J. (2021). Memespector GUI: Graphical User Interface Client for Computer Vision APIs (Version 0.2) [Software]. Available from https://github.com/jason-chao/memespector-gui.
Bastian, M., Heymann, S., & Jacomy, M. (2009). Gephi: An Open Source Software for Exploring and Manipulating Networks. Third International AAAI Conference on Weblogs and Social Media, 361–362. https://doi.org/10.1136/qshc.2004.010033
Image Preview. A plug-in for Gephi by the Yale Computer Graphics Group, available from https://gephi.org/plugins/#/plugin/image-preview
Maier, Nils; Parodi, Federico & Verna, Stefano (2007). DownThemAll (Version 4.04) [browser extension] . Available from https://www.downthemall.org/
˚ ˚ ˚ ˚ ˚ ˚ ˚ ˚ ˚ ˚ ˚ ˚ ˚ ˚ ˚ ˚ ˚ ˚ ˚ ˚ ˚ ˚ ˚ ˚ ˚ ˚ ˚ ˚ ˚ ˚ ˚ ˚ ˚ ˚ ˚ ˚ ˚ ˚ ˚ ˚ ˚ ˚ ˚ ˚ ˚ ˚ ˚ ˚ ˚ ˚ ˚ ˚ ˚ ˚ ˚ ˚ ˚ ˚ ˚ ˚ ˚ ˚ ˚ ˚ ˚ ˚ ˚ ˚ ˚ ˚ ˚ ˚ ˚ ˚ ˚ ˚ ˚ ˚ ˚ ˚ ˚ ˚ ˚ ˚ ˚ ˚ ˚ ˚ ˚ ˚ ˚ ˚ ˚
Useful links
List of research software and tools: https://bit.ly/research-software-sheet
About the Center for Advanced Internet Studies (CAIS): https://www.cais.nrw/en/cais_en/
Computer Vision Networks CAIS project:
Diary: https://thesocialplatforms.wordpress.com/2020/09/10/computer-vision-networks/ slides: bit.ly/computer-vision-networks_v1 (project proposal) I https://www.slideshare.net/jannajoceli/making-methods-with-vision-apis-online-data-network-building-lessons-learnt (lessons learnt) //video: bit.ly/computer-vision-networks_v1-video
Project development and recent activities: https://thesocialplatforms.wordpress.com/2020/09/10/computer-vision-networks/
Related tutorials:
- Memespector GUI: Enriching image data with AI
Slides: https://bit.ly/DMI-tutorial_MemespectorGUI or
https://bit.ly/recipes-memespector-outputs or https://bit.ly/DMI21-tutorial_MemespectorGUI
- Visual Content Analysis with Image Query and Extraction
Slides :https://bit.ly/offline-image-query-tool or https://bit.ly/DMI21_ImageQueryTool
Acknowledgements
Big thanks to Beatrice Gobbo (Ph.D. in Design student at Politecnico di Milano, member of the DensityDesign Lab) who designed the method protocol. Her work in visually translating a table full of complex information to a protocol was simply incredible. Special thanks to Jason Chao (Ph.D. candidate at the University of Siegen, Germany, member of SMART team, iNOVA Media Lab) who has developed and expanded Memespector-GUI, also creating other crucial tools, such as Domain Name Extractor and Offline Image Query and Extraction, that facilitate the use of computer vision networks. They both are people with who I enjoy working and collaborating. Insightful discussions and concrete ideas emerged from our collaboration. Thanks to Fábio Gouveia (Public Health Technologist at Fundação Oswaldo Cruz - Fiocruz, Brazil) who suggested the regex expressions used in this method recipe to facilitate the building of networks (when using a file script to invoke APIs). Thanks to the collaboration of Rita Sepúlveda and José Moreno (both researchers at Lisbon University Institute - ISCTE, Portugal) at the CAIS data sprint about the circulation of WhatsApp misinformative images on the early day of the pandemic in Portugal and how these have circulated across the web. Thanks Johannes Breuer (Senior Researcher, GESIS – Leibniz Institute for the Social Sciences, Department Survey Data Curation) for his valuable comments and feedback. Thanks to the collaboration of Warren Pearce (Senior Lecturer, Department of Sociological Studies, The University of Sheffield) and Carlo De Gaetano (Information designer, Amsterdam University of Applied Sciences) when data sprinting with web entities, what a great time of experimentation and discussions we had together. The outcome of our meeting is reflected here in the suggestions on how to analyse the image-web entities networks. Thanks to Richard Rogers (professor and the Chair in New Media & Digital Culture at the University of Amsterdam) for inviting me to collaborate with the deepfakes and covid memes project at the Digital Methods Summer School 2021 and Winter School 2022, an excellent opportunity to share method recipes for using Memespector GUI outputs while testing and replicating specific analytical techniques. Thanks to the collaboration of Giulia Tucci and Francisco W. Kerche in idea exchange and in operationalising some of the proposed techniques and in visually exploring/analysing the material.
Summary
Introduction: a computer vision network approach to study image collections 5
Computer vision networks: definition and types 5
How is this methodological recipe organised? 7
Keywords: what we should know in advance? 9
Research ethics, online images & computer vision 19
⚙️👀 Curating and downloading a collection of online images 26
How to do data collection using APIs or scrapers? 31
How to prepare an image dataset? 34
⚙️👩🏻💻 Invoking Computer Vision APIs with Memespector GUI 38
Gaining access to computer vision APIS 42
Installing and using Memespetor GUI 43
⚙️🧐 Situating an image dataset 45
Image collection and metadata 45
OVERVIEW: obtaining a macro view of an image dataset 46
DETAILED PERSPECTIVE: obtaining a specific view of an image dataset 50
Image collection and computer vision outputs 51
⚙️👩🏻🎨 Network Building & Visualising 58
▶️ 👩🏻💻 General STEP-BY-STEP 59
Networks of image description 59
● Memespector GUI output(CSV file)>Table2Net>Gephi>PDFfile 59
Networks of image circulation 61
● Google spreadsheets>Domain Name Extraction>Table2Net>Gephi>PDFfile 61
Networks of cross vision APIs outputs 63
● Memespector output file>Spreadsheet>Table2Net>Gephi>PDFfile 63
Networks of computer vision feature (first node type) and platform grammatisation or topic modelling (second node type) 65
⚙️👩🏻🏫 Reading computer vision networks 68
💭Possible visualisations [folder] 68
⏮ What precedes the interpretation of the network? 69
● Researcher/student is aware of the possible lines of enquiry: 69
● Researcher/student reads: 69
● Researcher/student knows that the network itself reflects: 69
🖥🕸️📝Network Vision Analysis 71
Image classification: labels and web entities 71
Image circulation: web page and image host detection 72
Images over time: how to explore and analyse time-based datasets? 72
Introduction: a computer vision network approach to study image collections
In the introduction you will first learn about computer vision networks (what are these, how they have been studied, how they will be developed here and why they matter for research purposes), then I will provide a summary of a method recipe for building and interpreting networks of images and computer vision features. I explain how this document is organised, also informing its conceptual and theoretical basis. Next, and to underpin the computer vision network approach, a list of keywords are presented and briefly discussed, namely digital methods, technicity-of-the-mediums, platform grammatisation,, natively digital images, computer vision, computer vision (APIs and features), query design and research protocol diagram. Finally, I close the introduction with some keynotes on research ethics, images and computer vision.
Computer vision networks: definition and types
A computer vision network is “an ensemble of computational mediums, data, methods, research and technical practices orchestrated by the researcher(s)” (Omena et al. 2021) that may serve scientific purposes and objectives, yet not restricted to that. This type of network is reconstructed through computer vision and by the choices that the researcher has to make along the process of curating a collection of images and building, visualising, and analysing the network itself. Unlike networks designed via ready-made files[1], computer vision networks must be built. There is a requirement of practical tasks, because data collection tools are unable to deliver a file which one can easily download and, then, visualise the combination of images and computer vision feature as a network. In addition, there is a call to understand the features in use.
The method recipe, here proposed, suggests the creation and interpretation of different types of computer vision networks (as illustrated below) that are built on top of computer vision features such as image classification (textual descriptions to images using labels/tags/concepts detection rooted on confidence score and topicality rating) and Google Vision’s web entities and page detection (which provides images with web-based content). These networks can be used as research devices for social and media research (see Omena et. al. 2021), which I will explain/demonstrate in detail later.
- Networks of image description. These networks have two types of nodes (bipartite graphs): one being always the image, whereas the other stands for the vision API chosen feature.
- image-label networks: provide literal descriptions to images using a collection of machine learning models to detect and label image content. This computer vision feature can be differently named across commercial and open source vision APIs, e.g. Google Vision’s “label”, Microsoft Azure’s “tags”, Clarifai’s “concepts”, ImageNet’s “label”. Nodes are images and labels. Connections mean the occurrence of labels in relation to images.
- image-web entities networks: provide contextual descriptions to images using the web content as a knowledge source, specifically through the power of Google Image ranking systems and Knowledge Graph. Nodes are images and web entities. Connections mean the occurrence of web-entities in relation to images.
- Networks of image circulation. These networks have two types of nodes (bipartite graphs): one being always the image, whereas the other stands for the sites where the images are found. That is a list of image URLs or web pages with fully matched images.
- image-domain networks: refer to images and sites of circulation across the web (a list of URLs or web pages in which fully matched images are found). Nodes are images and (sub) domains. Connections mean the occurrence of (sub) domains in relation to images.
- Networks of cross-vision APIs outputs. These networks have two types of nodes (bipartite graphs): one stands for the computer vision company (e.g. Clarifai, Microsoft, Google), the other type of node represents the labels that are provided by each company’s machine learning models to classify an image collection.
- Vision API(s)-label networks: allow the comparison between the results of different APIS for labelling the same collection of images. Nodes as computer vision companies and labels. Connections mean the occurrence of labels in relation to the vision APIs.
- Cross-platform image collections and web entities networks: allow to understanding of platform visual vernaculars.
- Image collections and labels network: allow to make sense of AI taxonomies
- Networks of cross-platform image collections and computer vision outputs.
- Vision co-ocurrence label networks: allow the network reader to have a quick and broader overview of what constitutes the image collection.
- Cross-platform image collections and web entities networks: allow to understanding of platform visual vernaculars.
- Networks of computer vision feature and platform grammars. These networks have two types of nodes (bipartite graphs): the computer vision feature (e.g. web entities) and a digital record (e.g. image related location). Although still underexplored, this type of network offers a novel way of interpreting images by situating these according to specific research purposes. That is the case, for instance, of exploring the associations of images and geolocation:
- Image based location-web entities networks: help to contextualise the use of visual content in relation to specific countries. Another possibility would be to take advantage of periods of time in which images were published, for example.
The original proposal of combining computer vision and images as networks is inspired by the work of Donato Ricci, Gabriele Colombo, Axel Meunier and Agata Brilli (2017). The authors merged a collection of Twitter images connected by the keyword “nature” into a network using a web-based vision API (IMAGGA’s API) to map Paris urban nature debate. Following this innovative approach, other scholars have been exploring the so-called image-label networks (nodes as images and respective descriptive labels). Examples include political polarization (Omena et al., 2020), studies of image circulation (D’Andréa & Mintz, 2019), institutional communication (Omena & Granado, 2020), affective affordances of hashtag publics (Geboers & Van De Wiele, 2020) and how Brazilians depict #férias (holidays) through Instagram pictures (Silva, Meirelles & Apolonio, 2018). These studies explore a particular characteristic of computer vision, the labelling of visual content according to predefined tags provided by machine learning models, while other features are still understudied such Google’s web entities and pages detection. In this method recipe, I showcase examples of recent studies to offer practical solutions for the analysis of different types of computer vision networks. In addition, I briefly illustrate how using computer vision networks as a research device can assist the study of large image datasets under a quali-quanti perspective.
How is this methodological recipe organised?
This document presents the methodological steps to build and interpret computer vision networks, pointing to the main lines of enquiry afforded by this approach and showing how to provide answers for these questions with digital visual methods. The method recipe aligns with the philosophy and practice of digital methods (Rogers, 2013; 2019), while taking into consideration the technicity-of-the-mediums (Omena, in press; see also Rieder, 2020) in its implementation. This document is organized as follows, also offers several videos and sample datasets to assist the learning process and guide the operationalisation of the method.
The method protocol
This section displays the methodological process for creating and interpreting computer vision networks. The research protocol is presented in detail in the following sections, accompanied by practical step-by-step and conceptual explanations.
Lines of enquiry with computer vision networks
The section introduces general and specific questions that can be asked when using this approach, presenting some practical examples based on peer-reviewed articles and exploratory studies.
Curating and downloading a collection of online images
The section explains the art of querying digital platforms and extracting data from the web, pointing to the role of technological grammar in this process. It demonstrates how to access web data, illustrating how to prepare (using a list of image URLs) and download (using browser plugins such as DownThemAll) an image dataset.
Invoking Computer Vision APIs with Memespector GUI
The section presents Memespector GUI (Chao, 2021), a research software tool that can easily invoke multiple vision APIs, delivering a variety of computer vision features of Google Vision, Microsoft, Clarifai and ImageNet. It offers a detailed explanation about image classification and Google Vision web entities and pages detection while sharing lessons learnt. This section also indicates links to tutorials explaining how to sign up and get authentication keys from Google Vision, Microsoft Azure cognitive Services, Clarifai Vision and ImageNet (open source model).
Situating the image dataset
This section offers some tried-and-tested protocols to explore the original data sample and the outputs of Vision APIs using basic exploratory visualisations such as circle packing and rank flows. It proposes practical exercises to situate image content (using labels/web entities) and sites of circulation, also suggesting ways of visualising web entities over years.
Building & Visualising Networks
This section contains step by step processes to build computer vision networks from the outputs of Memespector (using .csv files) to the visualisation of the network (with .gexf and .pdf files). Detailed recipes are presented to build different types of net,orks as described below.
Networks of image description
- Networks of image circulation
- Networks of cross vision APIs outputs
- Networks of computer vision feature (first node type) and platform grammatisation or topic modelling (second node type)
When making networks, we are invited to revisit the research questions while seeking ways of practically providing solutions to respond to these questions, yet being open to new lines of enquiring.
Reading computer vision networks
This section offers techniques to read networks based on node position, technological grammar and the choices made in network building. There are some key aspects to be taken into account for interpreting computer vision networks, as presented below.
Type of network (which platform and digital records?) | How we see (query design and available images + computer vision feature + how we build) | What we see (whole + parts of the network) | What we read (according the image daset & platform + computer vision feature + analytical choices) | What we ask (type of network + zones of the network or chosen paths) | What we narrate and why |
Drawing on case studies, the section provides practical guidance to approach computer vision networks.
Keywords: what we should know in advance?
The keywords invoke what we should know in advance before using this method recipe. What follows are brief definitions of digital methods, technicity-of-the-mediums, platform grammatisation, natively digital images, computer vision (APIs), computer vision features, query design (or image data design) and research protocol diagram. These keywords serve as conceptual and methodological guidance supporting my proposal of a computer vision network approach to social and media research.
Digital methods
Digital methods are a particular form of research practice that is crucially situated in the technological environment that it explores and exploits (Omena, forthcoming). What makes the difference in digital methods is an invitation to first learn from medium specificity (following its logics, forms and dynamics) and, consequently, to repurpose what is given by the methods of Internet platforms for social, cultural or medium research. When scrutinising online dominant devices and their methods, particular techniques to formulate queries are required. Key to this process is the researcher’s ability in defining a list of words (e.g. URLs, hashtags, videos or images ids, social media accounts) as issue language. Such ability underpins search as research which is followed by a proper understanding and use of the work material (digital records and software) and technical practices for these methods. Under the premise of a medium research perspective, the functional logic of work in digital methods thus invites researchers to think about the subject of study in, with and through a practical-technical research process.
This approach thus requires researchers to develop a mind-frame that accounts for, investigates and re-purposes technological grammar for social enquiry. Therefore, the use of digital methods is about understanding how to work with socio-technical assemblages and how to think along with a network of methods.
Technicity-of-the-mediums (a technicity perspective to DM)
“The concept of technicity-of-the-mediums serves as an invitation to become acquainted with the computational mediums in the practice of digital methods. It is related to the relationship among the computational mediums, the fieldwork and the researcher(s) and her/his object of study, thus demanding iterative and navigational technical practices” (Omena, in press). The technicity perspective starts with the attitude of caring and making room for computational mediums in the design and implementation of digital methods, considering them as important as the contents or the objects of our research. It relates to a specific domain of knowledge required by and developed in the processes of getting acquainted with the computational mediums from conceptual, technical and empirical perspectives (when researchers make room for the sensitivity to technicity), and in the practice of digital methods (when researchers have the opportunity to develop such sensitivity). This involves an engagement with the digital fieldwork as well as technical practices, which takes some time and requires extra efforts from the researcher (establish the importance of this approach).

Figure xx. How to be acquainted with the medium in the context of digital methods? Table source: Omena (2021).
I use the expression of “computational (or technical) mediums” in a sense that encompasses but also exceeds the notion of communication media, inviting researchers to consider media not only as a communication platform, but also as living substances and mediators devices. Computational (or technical) mediums here stand for research software, digital platforms and associated algorithmic techniques, which can be captured by APIs’ results or scraping and crawling methods.
To get the advantage of a computer vision network approach, scholars are invited to understand the chosen computer vision feature and also how images are appropriated by users (cultures of use) and embedded into platforms (grammatisation).
Platform grammatisation
Platform grammatisation refers to the technological processes inherent to the web environment and APIs in which and through which online communication, acts and actions are structured, captured and merged with other records, yet made available limitedly through data retrieval methods such as crawling, scraping or API calling. In other words, the situations where users deal with predefined technological grammar, produced and delineated by software, to structure their activity (Gerlitz & Rieder, 2018). That alludes to the operationalisation of platforms and the particular and pervasive agency of its technical functioning (see Rieder, Abdulla, Poell, Woltering, & Zack, 2015) intertwined with and in online data. Why is an understanding of platform grammatisation is key in the computer vision networks approach?
First, because it brings crucial information (image metadata) and aspects associated to the collection of images (where do these come from? What are the cultures of use and practices related to these?) that the researcher can benefit from when building the network. Second, it offers documentation (via API documentation and how to use tutorials) that facilitates a technical understanding of the computer vision feature in use. The notion of platform grammatisation shall guide researchers to use the knowledge about the ways in which grammatised actions are altered and rearranged by computing as methodological language. It helps researchers to make sense of data retrieved/scraped from digital platforms. In this sense, and as previously discussed, taking grammatisation into account demands new ways of conceptualising the subject of study. Here, social media content cannot be separated from its carrier (see Niederer, 2019); platform interfaces and infrastructures.
Being aware of platform grammatisation assists the elaboration of research questions and a critical mindset towards the analysis and interpretation of image datasets.
Natively digital images (or online images)
Natively digital images are taken as traceable and calculable surfaces afforded by the environments they are operationalised, e.g. social media platforms’ uses, practices and technological grammar. These images are no longer placed solely as an iconic object because they carry out meanings and representations embedded into digital records (e.g. hashtags, timestamps, links, engagement metrics, location). Visual content can also reflect platform mechanisms such as ranking and recommendation systems. The table below illustrates what comes along with a TikTok image, e.g. text, created time, number of fans and followers, music id, name and author.
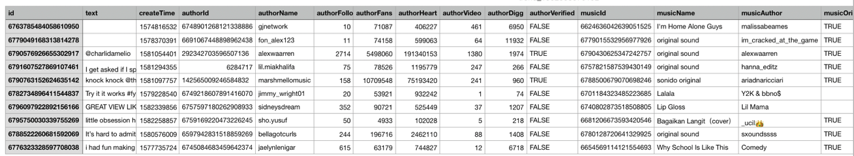
Figure xx. TikTok grammatisation: identifying grammatised actions through the exploration of the scraper output file. Source: https://github.com/drawrowfly/tiktok-scraper#getVideoMeta
To get advantage of a collection of images, two main steps are to be taken into account. First, and due to the short life span of image URLs, it is recommended to download all the images as soon as the data sample is arranged. Second, when downloading the images, it is crucial to name image files with the image unique identification (id) to further explore the dataset with visual methodologies.
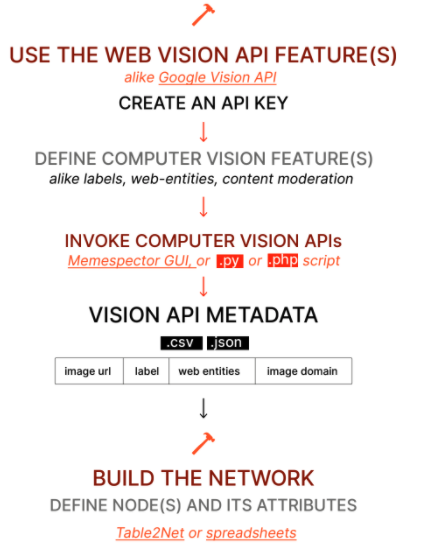
Computer vision (APIs)
Broadly speaking, computer vision is the computer's capacity to recognise visual features through algorithmic techniques, using these learnings to identify and classify objects and scenes (Szeliski, 2021). While a computer vision application programming interface (API) is a cloud-based tool that mediates access to advanced algorithms (a collection of machine learning models) for processing images. We can make use of computer vision APIs by running script files such as Memespector php or python scripts (Rieder, 2017; Mintz, 2018) or using research software such as Memespector graphical user interface (GUI), developed by Jason Chao (2021). See the figure below.
In practical terms, computer vision APIs provide different ways to analyse images (either located in the computer or a list of image URLs), for example, one can identify what is in an image, as the gif below demonstrates, using Google’s machine learning models to classify the image with a yellow cloud. This feature (label detection) provides textual descriptions that are ranked by topicality and accompanied by confidence score, e.g. from cloud (97%) and sky (93%) to illustration (53%) and macro photography (52%). Commercial computer vision APIs tend to offer reliable outputs if compared with open source APIs. However, the degree of specificity and precision may vary among commercial APIs.
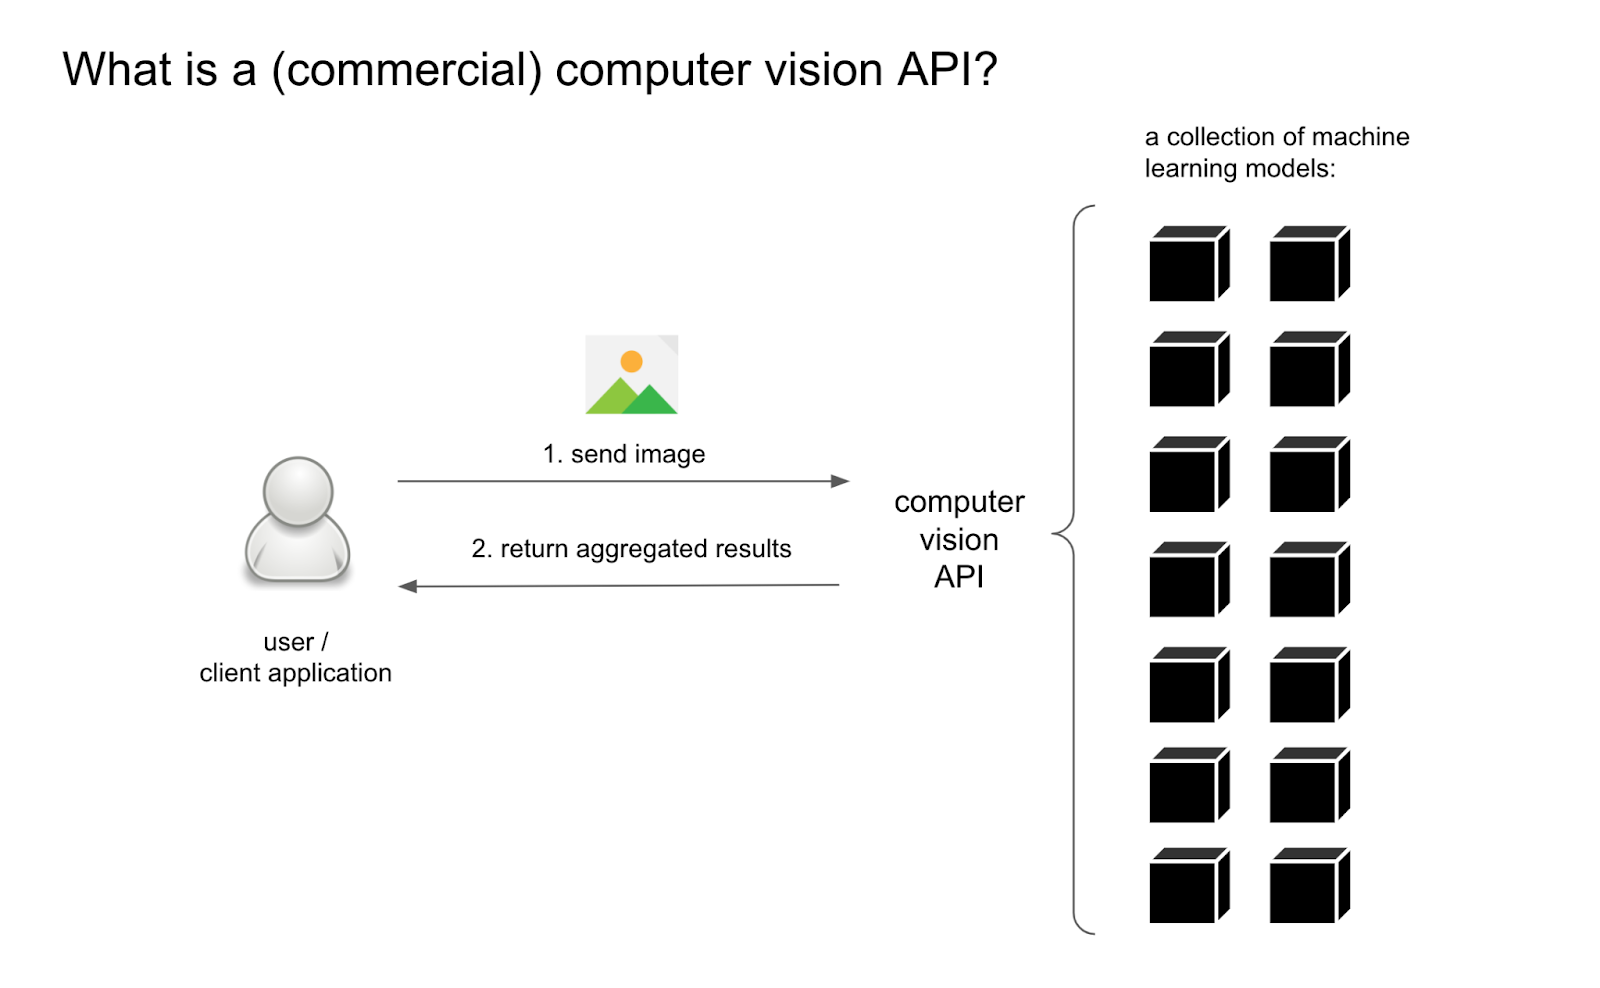
Figure xx. What does a computer vision API do? Image source: Chao & Omena (2021), retrieved from https://bit.ly/DMI21-tutorial_MemespectorGUI

Figure xx. Understanding a computer vision feature (label detection) with Google Vision API drag-and-drop demo (https://cloud.google.com/vision/docs/drag-and-dro
Computer vision features
The main features (or services) provided by five commercial vision APIs are exposed in visualisation below, also indicating the year of launch of each API. At the top of the shared services, the use of predefined labels to classify images (as demonstrated in the previous keyword), content moderation, the detection of faces and facial attributes, and visual search. This provides an overall perspective on the shared and exclusive features offered by the vision APIs that are used for different purposes. To the marketplace or government security services, vision API features offer services such as content moderation (e.g. by recognising offensive or unwanted images or detecting racist and adult content), predictive analytics or the controversial ability to recognize faces. In social research, some features have been useful to diagnose gender bias and to the studies of visual misinformation or political ideology of images (see Garimella & Eckles, Schwemmer et al., 2020; 2020; Xi et al., 2020).
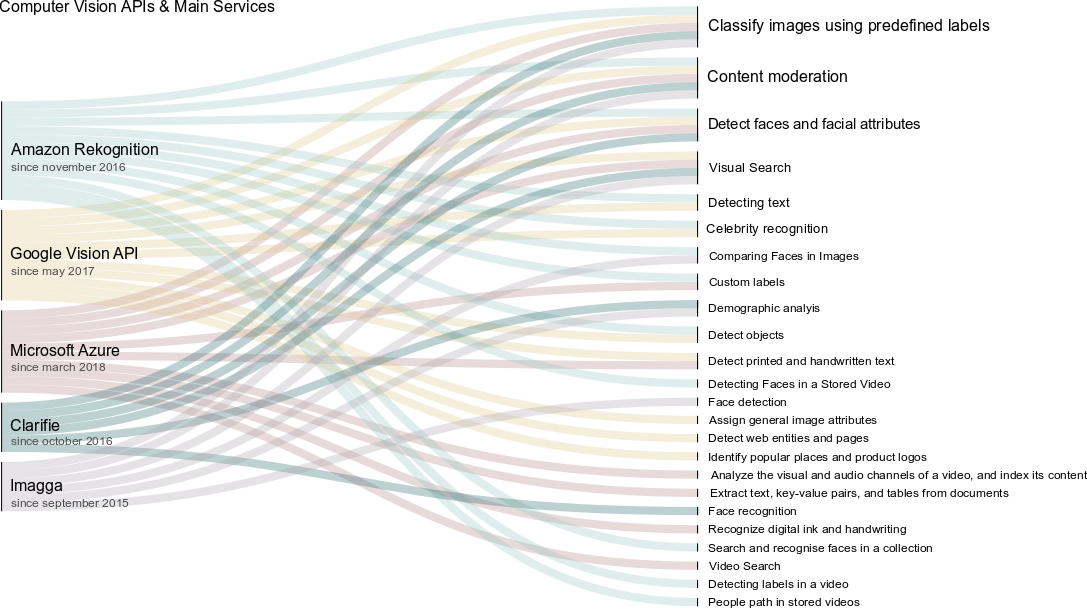
Figure xx. The main services offered by commercial vision APIs. Dataviz version: July, 2020.
There are also open source vision APIs available such as the ImageNet database, which require to be trained, adding an extra technical layer to non-coding scholars/students. The ImageNet database may not offer the quality and precision found in the commercial APIs.
The method recipe here proposed focuses on two computer vision features for making sense of large collections of images through seeing their content, context and sites of circulation. These features refer to image classification, web entities and pages detection.
i) Image classification. When the outputs of a computer vision API provides textual description to an image. Labels are used to inform what is in an image following an ontological structure, going from general to detailed classifications, e.g. insect>invertebrate>araneus>arthropod. That is, labels are ranked by topicality and they are also accompanied by a confidence score (figure xx)., which consequently, inform the probability of the textual descriptions assigned to an image. For example, the description of the mosquito image starts with generic labels arranged by topics that contain the highest confidence score, e.g. insect (0.9698934), moving to detailed classification such as arthropod (0.80041119).
To sum up, and before making research questions, researchers should understand that labels are always organised by a structured vocabulary (or topicality ranking) and accompanied by a confidence score. In addition, different computer vision APIs may use different machine learning models, which reflects on how image classification is done. That said, one may not expect to find, for example, cultural specificities, social issues or political stances when using image classification (unless one trains the machine learning models with a specific database). Such aspects or perspectives may result from the researcher/student role and ability in exploring/interpreting the network/image dataset. More contextualised descriptions are provided by Google Vision’s web entities, as I explain below.
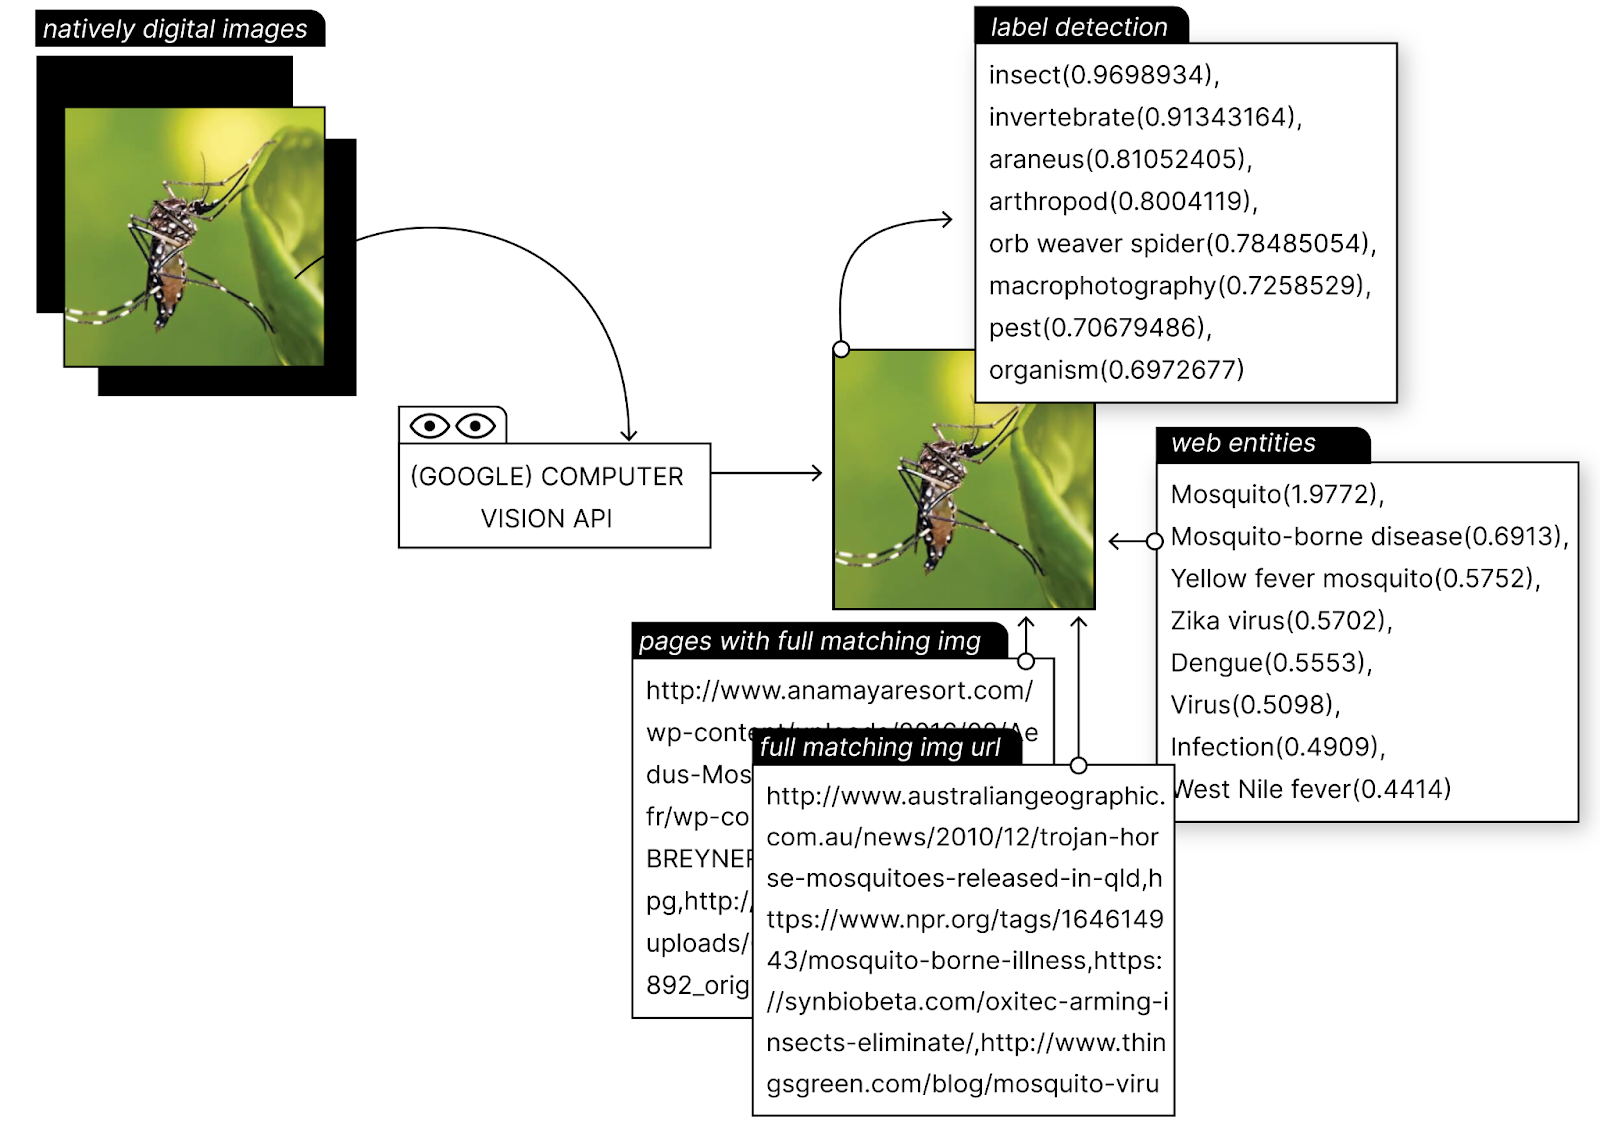
Figure xx. How does Google vision API see images? The outputs for label detection and web entities and pages detection. Image source: Omena, Pilipets, Gobbo & Chao, 2021.
ii) Web entities and pages detection. When the outputs of a computer vision API provides textual descriptions to an image based on web content (web entities detection) and a list of image URLs or webpages in which fully (or partially) matched images are found (web page detection). These features are exclusively found in Google Vision API. To detect web entities and pages, the API uses the power of Google Image Search and Knowledge Graph, including license data, public sources, and factual information received directly from content owners (see Google Cloud, 13 April 2017 archived at Wayback Machine; Sullivan, 2020; Robinson, 2017).
A web entity can be a thing, a person, a place (location) or an organization/event name detected and recognised in Internet-based content. Entities are created to organise search results, helping the users to find what they are interested in (see Li et al. 2017; Sullivan, 2020). For example, the web entities associated with the mosquito picture (figure xx), such as mosquito-borne disease and Zika virus, tell us about an epidemiological scenario that prompted warnings to pregnant women in Brazil and other several Latin American and Caribbean countries. “Entities may include any type of nameable thing whether it is a business, person, consumer good or service”, e.g., a meme (thing), Lisbon (location), the president of Brazil or Jair Bolsonaro (a person), the World Health Organization (organization) or even a phrase such as individual and political action on climate change and a stance like skeptical science. Webpage content, (image) textual data and knowledge repositories are used to identify web entities. Using references to an image obtained from the web environment, web entities provide a contextual, temporal and cultural layer to image analysis.
When using Google Vision’s page detection for research purposes, we can identify where fully matched images are found according to:
- a list of image URLs (a precise image location, figure xx)
- a list webpages images (precise image location within a webpage)
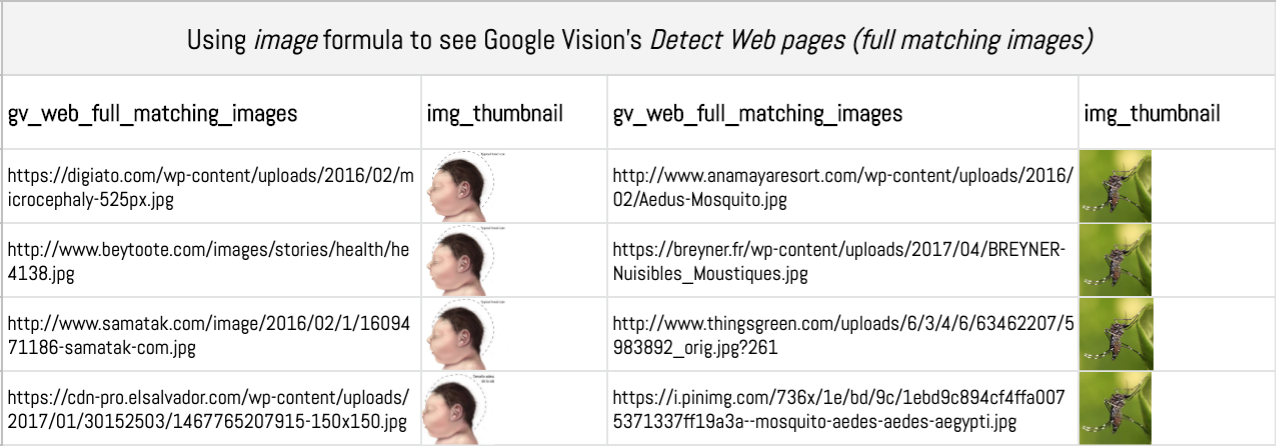
Figure xx. List of image URLs with full matching images. The original images, the baby with microcephaly and the mosquito, were retrieved from Instagram public publications using #microcefalia. Table source: https://docs.google.com/spreadsheets/d/1O0XW_Hg7TBB9fROSBiXoKnS3aMlrB68iekbLXPeEzqo/edit?usp=sharing
Before using web entities and pages detection, researchers should not only understand what these features provide and how they work but they must make sure that the collection of images to be studied originates and/or exists on the web. If the images do not exist on the web (or not indexed), if they are not popular or are not considered as reference sources, the computer vision results will be unsatisfactory and may confuse rather than help.
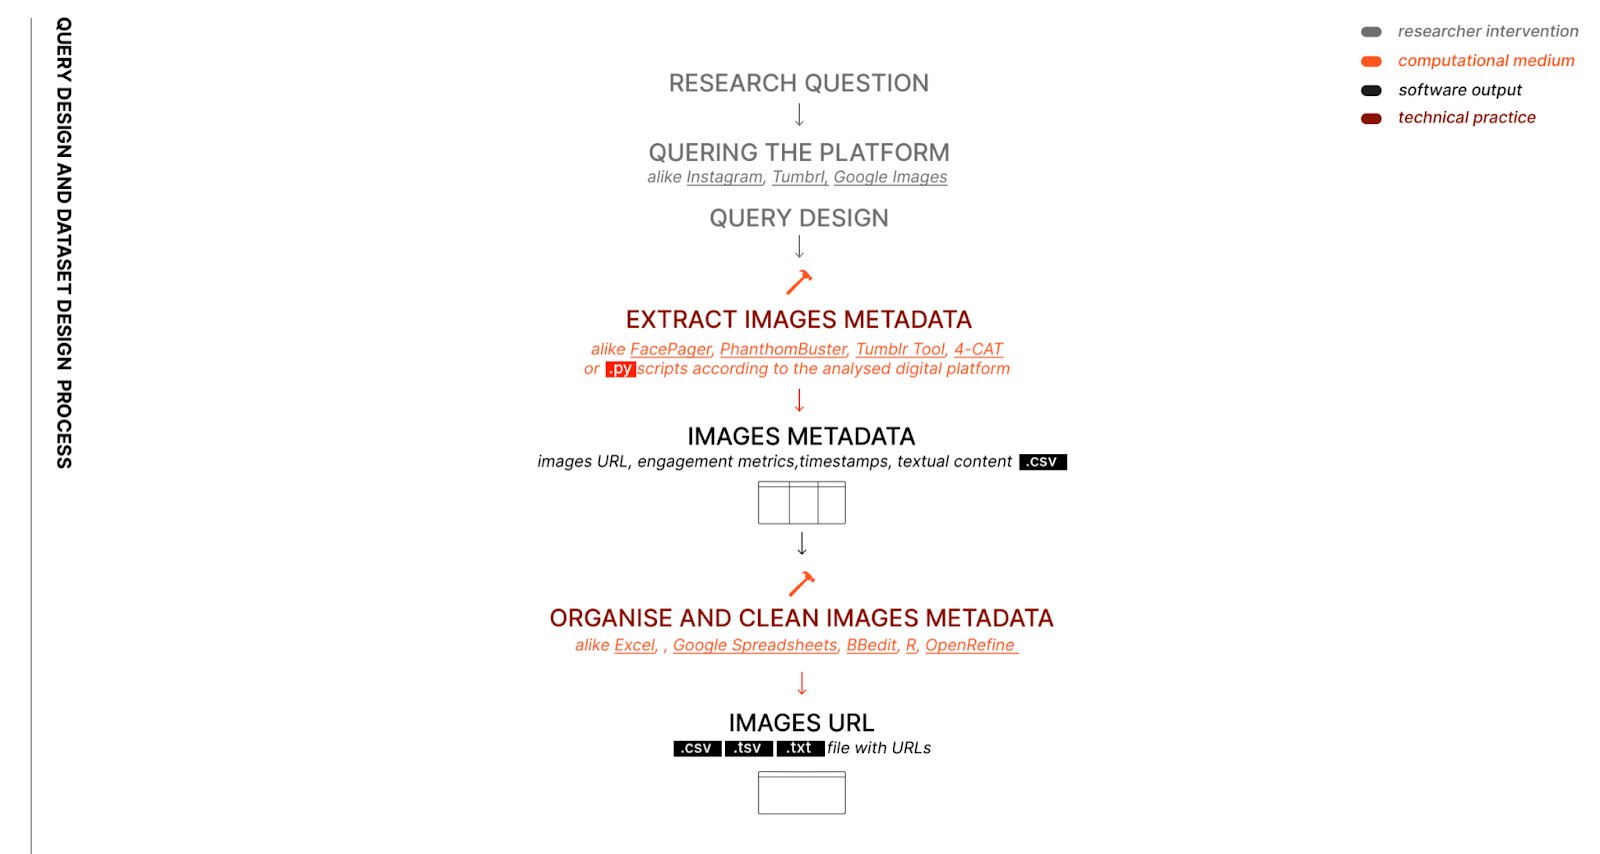
Query design (or image dataset design)
Query design (or image data design) refers to the choice of keywords or digital records defined to query and extract data from platforms. The technique of building lists of words to be used as keywords or issue language informs the foundations of digital methods (see Rogers, 2017, 2019), being crucial to all steps of the research. A good and robust collection of images may rely on the choice of keywords or digital records that, in digital methods, denote positioning efforts – program and anti-programs (see Akrich and Latour, 1992) as well as neutrality efforts (Rogers, 2017; Rogers, 2019). Therefore, query design should be synonymous with spending time navigating the platform to explore one’s subject of study: to monitor, to collect data and to conduct some (visual) exploratory analysis. After all, “the ways in which actors label the phenomena in which they are engaged can be subtle and complicated” (Venturini el al., 2018, p.18). To understand how crucial query design (or image data design) is to both the computer vision network approach, here proposed, and to digital research, I want to go through four main aspects:
- Understanding query design by comparing it with the act of querying a database;
- Being aware of the workspace and knowledge required when designing a query;
- Conceptually and practically comprehend what does it mean to query platforms;
- Know how different queries serve different research purposes.
Let’s compare (in a rough way) the act of querying a digital platform with querying a database. There are differences and similarities between these methods. In both cases, query formulation is a key aspect of information retrieval, a way of clearing out various doubts relating to a particular subject. On one hand the query design method in a database helps the user to find data immediately (or to generate reports) by applying various filters to it. On the other hand, in the practise of digital methods, we formulate search queries as starting points for research. In this case the web environment and platform interfaces are our working space, rather than a database in itself. This is the main difference we should keep in mind, because we cannot treat the web environment as if it was a database. Web environments have a proper language, cultures of use and technological grammar. So, it is crucial to understand that here we see query design as in plan/develop/sketch question interrogation with digital records, within the web environment and through software/interfaces
Querying a database to find data immediately or to generate reports. Working-space: database and business model/language. Image source: https://i.gifer.com/DHPl.gif
Querying YouTube as starting points for research. Working-space: web environment and platform interfaces, issue language/research topic language.
Figure xx. Querying a database versus querying digital platforms.
That said, we may understand query design as in plan/develop/sketch question interrogation with digital records, within the web environment and through software/interfaces. By saying with digital records, I mean what can be captured but mainly the necessary entry points used to retrieve/scrape web data (such as tags, words, account names, IDs, location). Within the web environment means that we need to account for the technological environment that the digital methods approach takes as a point of departure, developing a technical comprehension of such an environment. Through software/interfaces it is a situation that calls for a certain proximity with software but also some extra efforts such as navigating platform interfaces and engaging with technical practices.
When querying platforms to curate a collection of images, we may want to consider some key aspects highlighted below.
- Basic or advanced knowledge about the web environment, knowing what digital records are available, how they are used or ignored.
- Basic or advanced knowledge about extraction software/interfaces, understand how records are captured and connected by/through platforms while taking technological grammar into account.
- Engage with (research) software and navigational practices
On one hand, query design exposes a close relation with data collection methods within the web environment (e.g. manual, API calling, crawling, scraping) and exploratory data analysis, and on the other, it justifies that the choice of words not only matters but also requires scholars to consider search as research (see Rogers, 2015). That is the formulation of specified and underspecified queries, to make research findings with engine outputs (Rogers, 2013; Taibi et al., 2016) and the researcher capacity to make good queries. In other words, this is a technique of building search queries as research questions (Rogers, 2019) which is not an easy task, as the forms and cultures of use of platforms are constantly changing and so are the ways in which platforms impose, capture and reorganise digital records. The two types of queries serve different research purposes, when specified (e.g. “white lives matter”, “#foraBolsonaro”) the query is used for studying dominant voice, commitment and alignment. Whereas, when not being sufficiently detailed (e.g. “abortion”, “quarantine”), the underspecified (or ambiguous) queries serve to uncover differences and distinct hierarchies of societal concerns (see Rogers, 2019).
Research protocol diagram
The protocol diagram serves as a didact tool to represent all the steps of the research (Mauri, Angeles, Gobbo, & Colombo, 2020). As a handful tool along the research process, it exposes the query design and the choice of the platform, while summarising the decisions made along the process; from the use of research software to the analytical approaches. It is meant to be a self-explanatory and self-sustainable visual tool highlighting both the dataset design and the visualization process (Mauri et al., 2020; Niederer & Colombo, 2019), as shown in the examples below. When tried and tested, “the protocol diagram becomes a dissemination tool addressed both to researchers or future students that want to replicate the same process” (Mauri et al., 2020, p.1). In the next section, I propose a method protocol that would assist several lines of inquiry concerning the study of online images.
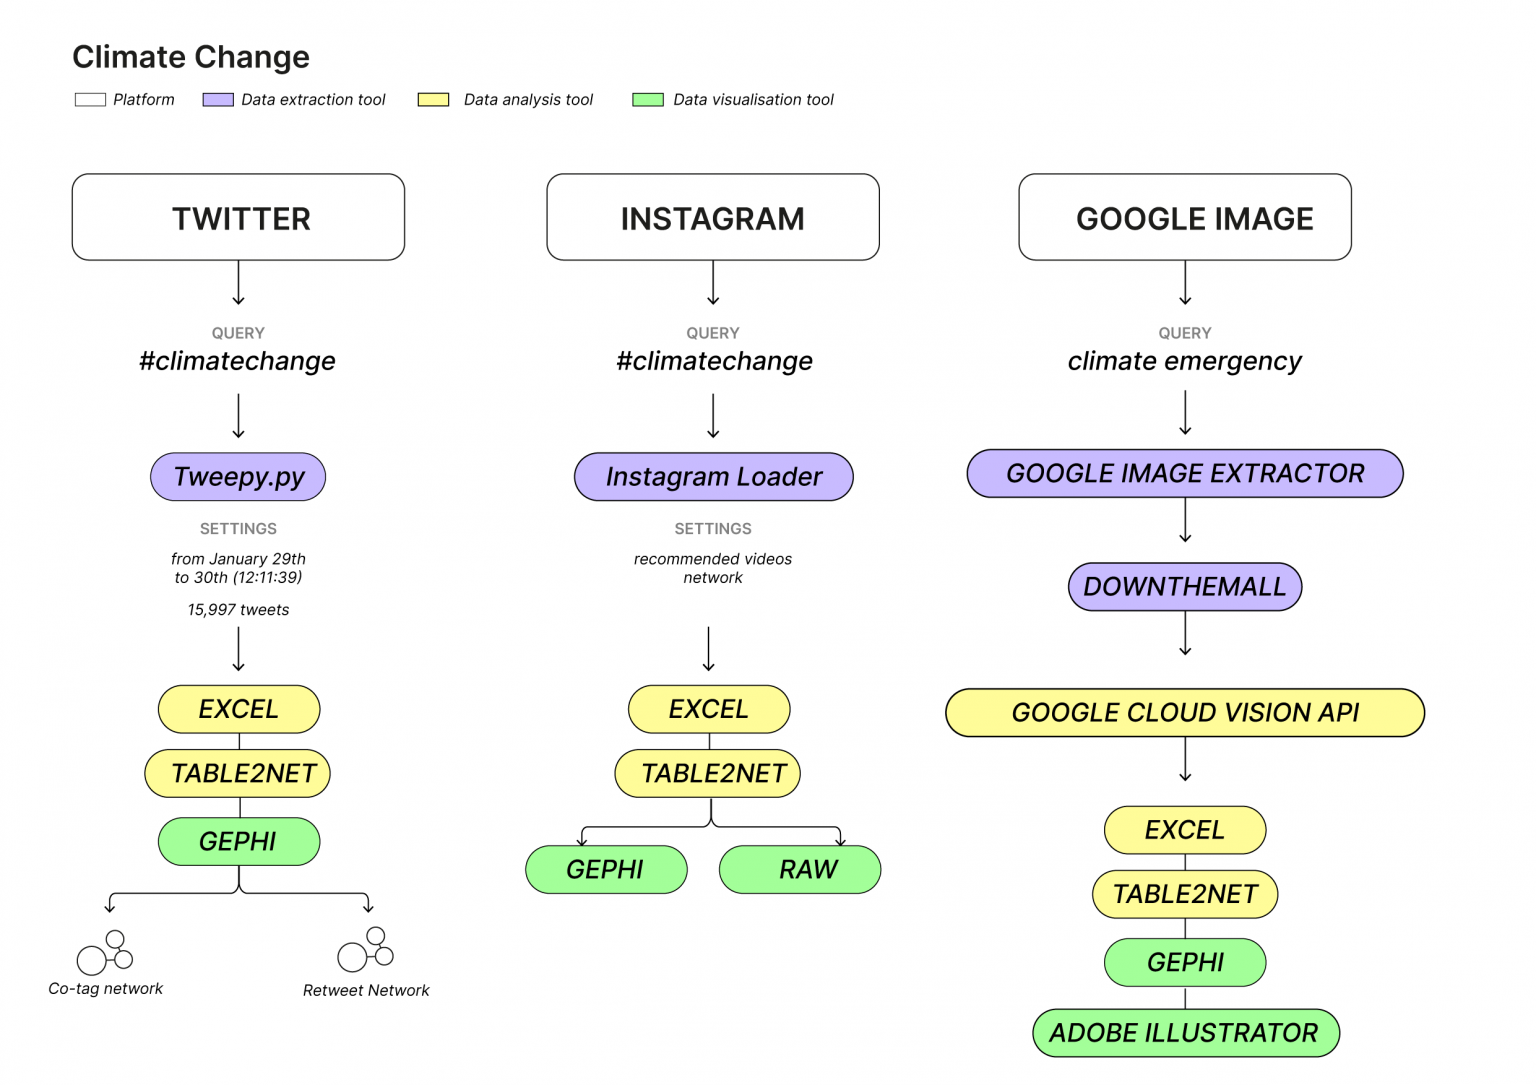
Figure xx. Research protocol diagram of cross-platform analysis. Image source: https://smart.inovamedialab.org/2020-digital-methods/project-reports/cross-platform-digital-networks/climate-change/
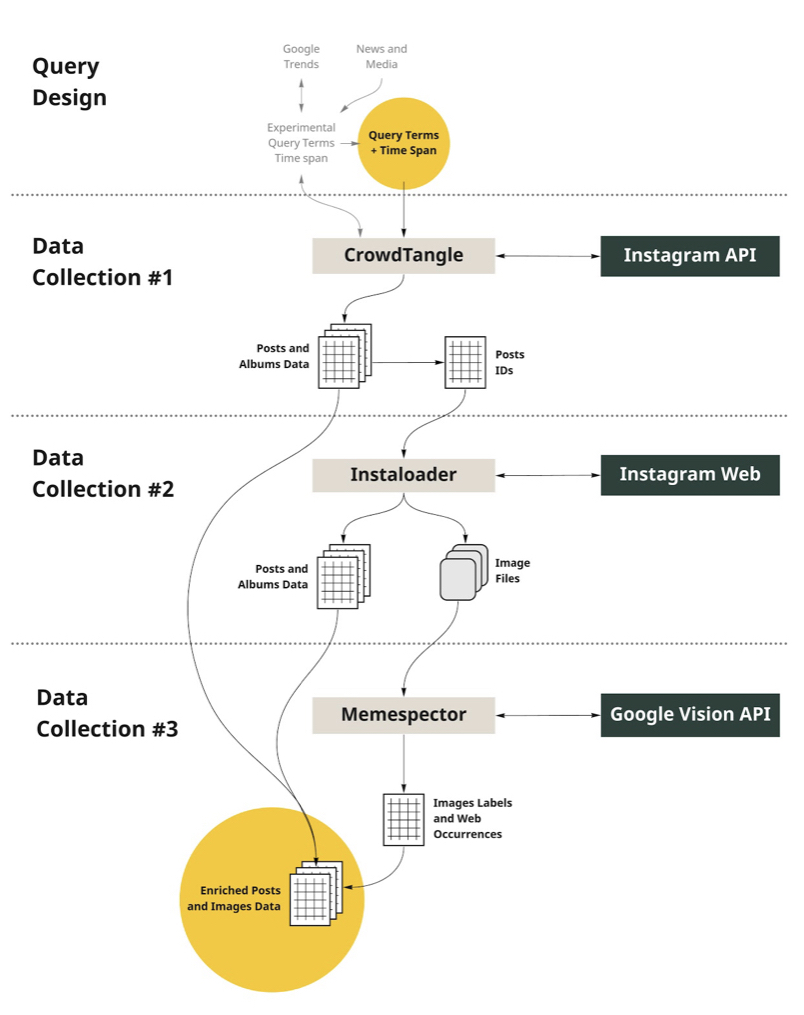
Figure xx. Research protocol diagram for studying Instagram images. Image source: https://smart.inovamedialab.org/2021-platformisation/project-reports/investigating-cross-platform/#design
Research ethics, online images & computer vision
What are the research ethical concerns related to the use of online image collections? How to avoid privacy and copyright issues? What are the ethical implications of the use of computer vision for research purposes? These questions are just a few examples of broader issues to keep in mind when adopting a computer vision network approach. By changing the way in which we do research, a “technicity” perspective would also have an impact on the way we deal with ethical problems revealing how the standard procedures of research ethics are sometimes inadequate for methods grounded on web environments and digital platforms (see Tiidenberg, 2020). Research with digital methods cannot rely on typical solutions (informed consent, for instance unfeasible in most projects of this type) and have to face different ethical dilemmas that “arise and need to be addressed during all steps of the research process, from planning, research conduct, publication, and dissemination” (Markham & Buchanan, 2012, p.5).
Digital methods researchers take advantage of the data policies of digital platforms, which often imply that by creating an account on social media, users give their consent to share some of their personal data and some of the records of their online behaviours with the platform and with third parties. Asking permission or giving detailed information about the case study to each and every participant/organisation would be an impossible task precisely because of the number of users as well as the difficulty to reach them.
A possible solution is to avoid exposing images of individual people and instead investigate larger issues at the level of public debate (see Markham, 2017). Here, the patterns and characteristics of an image dataset are seen collectively and not focused on a single individual. Methods addressing who is vulnerable (research individuals and populations) and what is sensitive (studied data or behaviour) (see Tiidenberg, 2020) also take a different shape from the technicity perspective. For instance, using computer vision as mediators and first interpreters of an image collection allows researchers/students to locate and visualise pictures belonging to ordinary users or with sensitive/controversial content or also containing babies and kids (this would depend on the query design and research topic). Here, when exploring image networks that may raise ethical questions, the researcher/student's responsibility is greater and ethical sense and instinct for investigation must go hand in hand. For instance, researching sensitive subjects such as how pornographic content is spread by botted accounts, can produce results that deliberately expose sexy and porn images of teenage girls being used in the web porn market. Ethical questions may then be raised about the image analysis, but it is also possible to argue that new ways of detecting the existence of teenager pornographic sites can help researchers in reporting such activities to the authorities.
In data treatment, there is sometimes the option to anonymize the results in order to ensure the anonymity of the users. In data analysis and subsequent dissemination of results, there is a continuing concern about finding ways to avoid disclosing personal information and harming users. However, anonymization is not always a benefit for research (e.g. to study political polarization or social movements), in this case, some anonymization strategies are taken during the analysis process to ensure the anonymity of ordinary users while finding ways to avoid improper exposure of the results or cause harm to public figures involved in the study.
🧗🏻♀️🚀The method protocol🚀
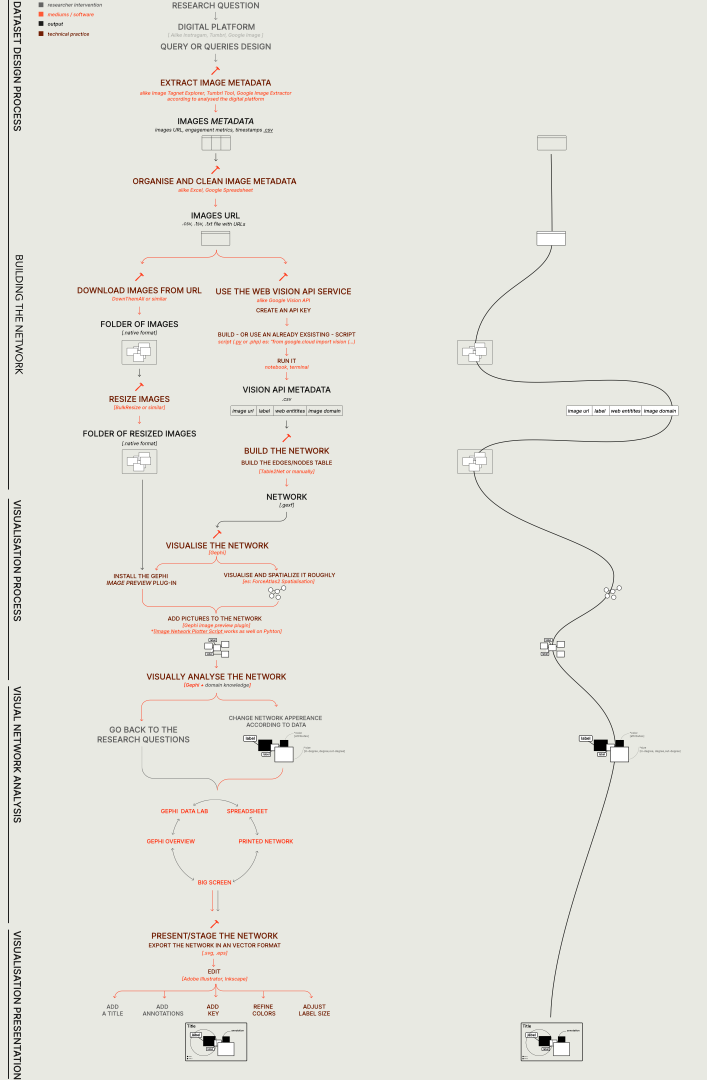
Figure xx.Research protocol to build and interpret computer vision networks. Designed by Beatrice Gobbo and conceptualised by Janna Joceli Omena. The step-by-step will be introduced in the next sections.
🙋🏻♀️❓Lines of enquiry❓
What are the (research) questions that can be asked when using a computer vision network approach? There is a list of possible specific and general lines of enquiry, as I summarise in the following sub-items. The suggested questions take into consideration the technicity-of-the-mediums (Omena, forthcoming, Rieder, 2020) and the potentials of computer vision networks (Omena et al, 2021, see also Colombo, 2018; D’Andréa & Mintz, 2019; Geboers & Van De Wiele, 2020; Niederer & Colombo, 2018; Ricci, Colombo, Mintz et al., 2019; Meunier, & Brilli, 2017; Omena & Granado, 2020a; Omena, Rabello & Mintz, 2020b; Silva et al., 2020; Silva, Meirelles, & Apolonio, 2018). The lines of enquiry also accounts for Gillian Rose’s (2017) critical visual methodology by covering important modalities as part of a critical visual methodology: the content of the image itself, its specific ‘audiencing’ through web references or image metadata, and the sites of image circulation. While adapting it to a digital methods perspective (Roger, 2013; 2019).
Specific lines of enquiry
● Lines of enquiry for networks of image description (using labels or web entities)
○ What is in a collection of images? What are the context, actors and (non) associations attached to images?
○ What can the different zones of the network tell about image content? How do the outputs of the vision API reflect on the disposition of images within the network?
○ What can the range, modes and granularity of image labelling tell about both the subject of study and the nature of computer vision?
○ What can we learn/infer from the (lack of) precision of image labelling or web entities?
○ Can the hierarchical structure of the web be visible through the outputs of Google Vision web entities? How?
● Lines of enquiry for networks of image circulation (using URLs or web pages with full matching images)
○ What are the sites of image circulation and who are associated with these?
○ What can the different zones of the network tell about image circulation and related actors (top-level domains)? How Google's ranking algorithms reflect on the disposition of images within the network?
○ What are the visualities that stick within and flow out of platforms? What are the visualities associated with core/dominant actors and where do they circulate?
○ Are there specific visual vernaculars associated with clusters of link domains? What does it indicate?
○ Can the hierarchical structure of the web be visible through the outputs of Google Vision full matching images? How?
General lines of enquiry
The proposed questions follows Gillian Rose’s critical visual methodology (see below) while adapting it to a digital methods perspective (Roger, 2013; 2019).
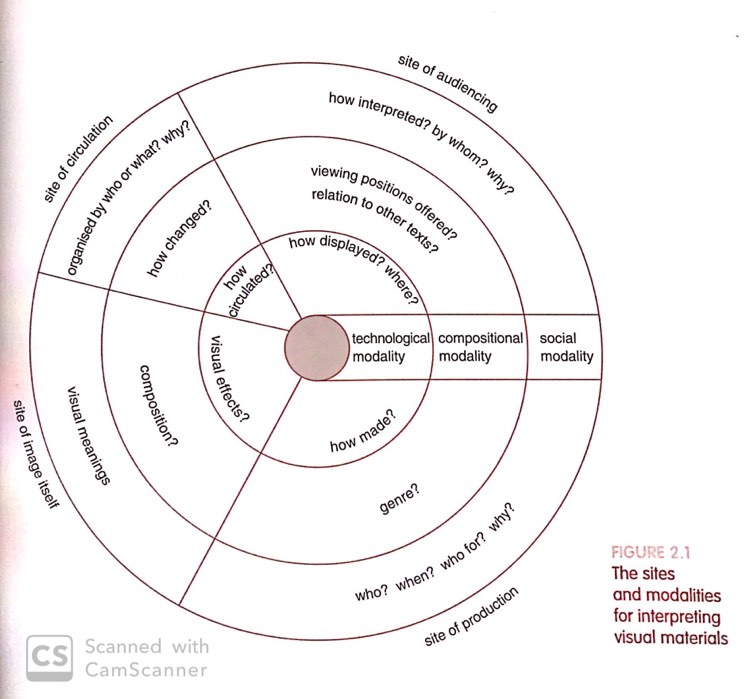
The sites and modalities for interpreting visual materials according to Gillian Rose (2017)
- The sites of production refers to the Web environments in which images are made available such as social media, search engine results, webpages. This means that, before considering who is producing/sharing one or more images online, we should keep in mind what digital records and mechanisms are used as entry points to collect the images, e.g. hashtags, location, keywords, lists of URLs/link domains, recommendation algorithms. Consequently, researchers should equally consider these processes referring to platform grammatisation, asking: how are digital records captured, re-organised and made available through data retrieval methods (e.g. calling APIs, scraping, crawling)? With this in mind, the general lines of enquiry associated with the sites of image production relates to unique actors (including dominant and ordinary groups) and image genres/categories.
- How many unique actors were responsible for image production? Who are the dominant and ordinary groups associated with that? When? (period of time) What for? (look at the entry points to data collection) How often do they engage with image production? (frequency of occurrence of unique actors within the dataset) Why? (e.g. by looking at dominant accounts or link domains)
- What are the genres/categories of the images (e.g. by using labels or web entities to image classification)?
- How are images made? Are they professional pictures, stock image production? Are they composed of memetic content?
- The sites of the image itself refers to visual meanings of an image, its composition and effects. Computer vision helps us to make sense of the formal components of the images (using labels) and of the web-based components of the images (using web entities). The visual meanings of images is closely related to the query design, also responding to the platform cultures of use from which the images originate. Just as different platforms offer different visual vernaculars, so does the design of the data collection and choice of keywords.
- What is in the images themselves?
- Based on similar images clusters or ego networks, what are the visual meanings and possible visual effects? (using labels or web entities)
- Based on web content, what is the context of a collection of images?
- The sites of audiencing refers to how images are seen by issue publics, afforded by the repurpose of platform engagement metrics, social buttons and other records, e.g. associated textual content (including emojis) and hashtags.
- What can web entities tell about image publics?
- What engagement metrics can tell about the images and respective publics? E.g. using bar charts to see the relation of image clusters (landspace, food, selfies) and engagement metrics (bar chart)
- What the production of images overtime (e.g. number of posts) can tell about the sites of audiencing? E.g. using line charts to verify the number of posts created to each topic (clusters of images) overtime.
- The sites of image circulation relate to a list of web pages or image URLs in which full matching images are found. Image circulation here refers to sites of image appearance, rather than a movement with an order or images moving to and fro.
- What are the sites of image circulation and related actors (link domains)?
Practical examples (questions asked & answers)
Case 1: The study of political polarization in Brazil (Omena, Rabello & Mintz, 2020)
- Research questions:
- What are the visual vernaculars of Brazil’s pro- and anti-impeachment protests?
- What can image clusters tell about Brazilian’s political positioning efforts?
- Are there different forms of visual appropriations and meanings between high-visible and ordinary actors?
- Some answers:
- Pictures of the crowds, selfies and graphic pictures (banners, image macros, text, etc.) are dominant visual content produced by Brazilians in the 2016 street protests, both in favour and against the impeachment of Dilma Rousseff.
- Colours demarcate political positioning, while the emphasis on certain visual content (crowd photos, anti-impeachment) or photography type (selfie, pro-impeachment) reveal protesters' distinct behaviours and values.
- Through the analysis of image-label network, it was possible to see the stereotypes that characterise different Brazilian’s political positions (e.g. colours: yellow and green for the pro-impeachment protests; red for the anti-coup protests) and political identity (e.g. bearded faces in the left, sunglasses in the right), for example.
Case 2: The imagery of Portuguese Universities on Facebook (Omena & Granado, 2020)
- Research questions:
- What can we foresee from a historical dataset of Facebook images timelines?
- What do Portuguese Universities visually communicate on Facebook? What are the dominant and ordinary visualities?
- Some answers:
- In general, Portuguese Universities are perpetuating the idea of a boring academic environment by using institutional posters or photos of people seated in an auditorium and listening to a conference as a dominant visualities. Another strong visual identity is the graphical depiction of posters and banners with the most varied type of announcements.
- The ordinary visual content (less substantial in numbers) brings the architecture of school buildings; indoor and outdoor events; head shot pictures; musical performance; sports; wild and domestic animals; the stereotypical images of labs - namely researchers working with a telescope; and people who made history in black and white pictures.
- When using a network grid, it was possible to visually detect the particularities of each University observing the presence or absence of image clusters, for example: i) images containing animals are almost exclusive to UTAD, ii) the practice of sports and musical performance appear to have little visual space among universities, at least if compared with the main images’ categories; iii) head shot pictures seems to please all universities, except in the case of Açores, Madeira, Coimbra. University on Facebook.
Case 3: The case of Brazil’s Pantanal wildfires (D’Andréa, Mintz et.al. 2021)
- Research questions:
- How were the 2020 Pantanal wildfires visually issuefied on Instagram?
- How does the visual issuefication on Instagram relate with a broader ecosystem of other social media and sites/platforms?
- Can emerging relationships between visual topics, engagement metrics and cross-platform circulation inform elements about the visual issuefication of the studied events?
- Key findings:
- “While several visual topics composed the visual issuefication of the wildfires, pictures of injured animals and of burning natural landscapes were some of the most frequent and most engaged topics.
- A portion of about 20% of the images posted on Instagram also circulated in other platforms and/or the open web and circulation patterns seemingly relate with platform grammars, use culture and infrastructural relationships. When tracing the circulation of Instagram images across platforms, we identified that images appearing only on Facebook have also been shared by unreliable (dubious) not secure news web pages. Local and regional news media were central in the media ecosystem".
Other examples of asking & responding questions with computer vision networks:
- Climate emergency image circulation
- Deepfakes and computer vision analysis:
- How do images published by Instagram and Tumblr bots travel across domains?
- Cross-Vision APIs analytics through the study of national visualities in stock image websites.
⚙️👀 Curating and downloading a collection of online images
⏮ What precedes network building?
- The art of querying platforms (list-making decisions)
- Observe, interact and follow the subject of study within the web environment
▶️ What can define network content?
- Data collection techniques and methods
- Affordances and limitations of digital platforms
- Data cleaning and management
To curate, a list of IMG URLs researchers/students should start by asking what are the possible entry points to access online image cross-platforms and how to get image URLs. This involves some technical knowledge about the API(s) documentation of the studied platform(s) and what tool can be used to access image URLs.
Possible entry points (digital records) | Data collection tools |
hashtags or keywords | Facepager, PhanthomBuster, Instaloader, Instagram Scraper, TumblrTool, YouTube Data Tools, TCAT, 4CAT |
unique identifiers (e.g. Facebook Page id, YouTube video or channels id, App id) | Facepager, PhanthomBuster, YouTube Data Tools, Google Similar Apps, Itunes Store |
webpage(s) | |
usernames | |
geolocation | |
URLs (e.g. account or page or post(s) or username(s) or Wikipedia Page) | Facepager, PhanthomBuster, Wikipedia Cross-lingual Images Analysis |
(See the complete list of the software-sheet here: https://bit.ly/research-software-sheet)
Image list-building requires investing some time within the platform environment and use the exploratory fronts of digital methods while taking technological grammar into account.
At least four steps should be considered to curate and download a list of image URLs:
- Query design: defining the platform(s) & the entry points for data collection.
- Data collection using APIs or scrapers.
- Prepare an image dataset.
- Download a collection of images.
which implicate the use of digital records (e.g. hashtags, video unique identifiers, account names, keywords) and extraction software. For instance, through hashtag queries using PhanthomBuster, one can access social media platforms’ posts or user-profile image URLs.
To curate, a folder of online images researchers can take advantage of an observational and qualitative approach that involves following the phenomenon studied within the Web environments while saving the images in digital format.
Query design
To define the platform(s) and the entry points for data collection requires the researcher/student to invest some time navigating the platform environment while taking into account the platform cultures of use and how the subject of study enters these spaces. When formulating queries, some crucial steps should be considered:
- choose a relevant topic to formulate queries
- navigate the platform environment, following the actors, actions, content or hashtags related to the object of study. For example, finding out the different terms and forms of appropriation by specific groups of actors.
- try and test different entry points to data collection by advancing some data exploratory analysis, also using basic visualization and or excel basic formulas.
- consider different types of queries and define the appropriate one, understanding how to make queries as research questions and how their outputs can be used for research purposes.
- Specified queries (very specific terms) to study dominant voice, commitment and alignment (Rogers, 2019).
- Underspecified queries (e.g. “climate emergency”, “deepfakes”) to uncover differences and distinct hierarchies of societal concerns (Rogers, 2019).
- Account name-based query to map and profile social-technical issues and cultures of use. (Omena, 2017; Omena et al. 2019; Omena, Lobo et al. 2021).
- Expert-list based query to focus on a specific group of actors mapping their activity, connections and (non)affiliations.
- Bot purchasing query to study bot agency and qualities, while learning from bot profile stereotypes (Omena, 2017; Omena et al. 2019; Weltevrede, Lindquist, et al. 2020)
- Following networks as queries to map (non) affiliations, interests and debates (Omena, 2019).
- Finally, defining a list of digital records (e.g. hashtags, keywords, unique identifiers, webpages, URLs, usernames), we may want to think about these as part of programs, anti-programs and as neutrality efforts (Rogers, 2017).
A temporal perspective, or the use of specific language(s) and or a geolocation-based approach can be combined with the list-making strategies. Below examples of list-making collections of images, how each list was built, what were the entry points and when data collection occurred.
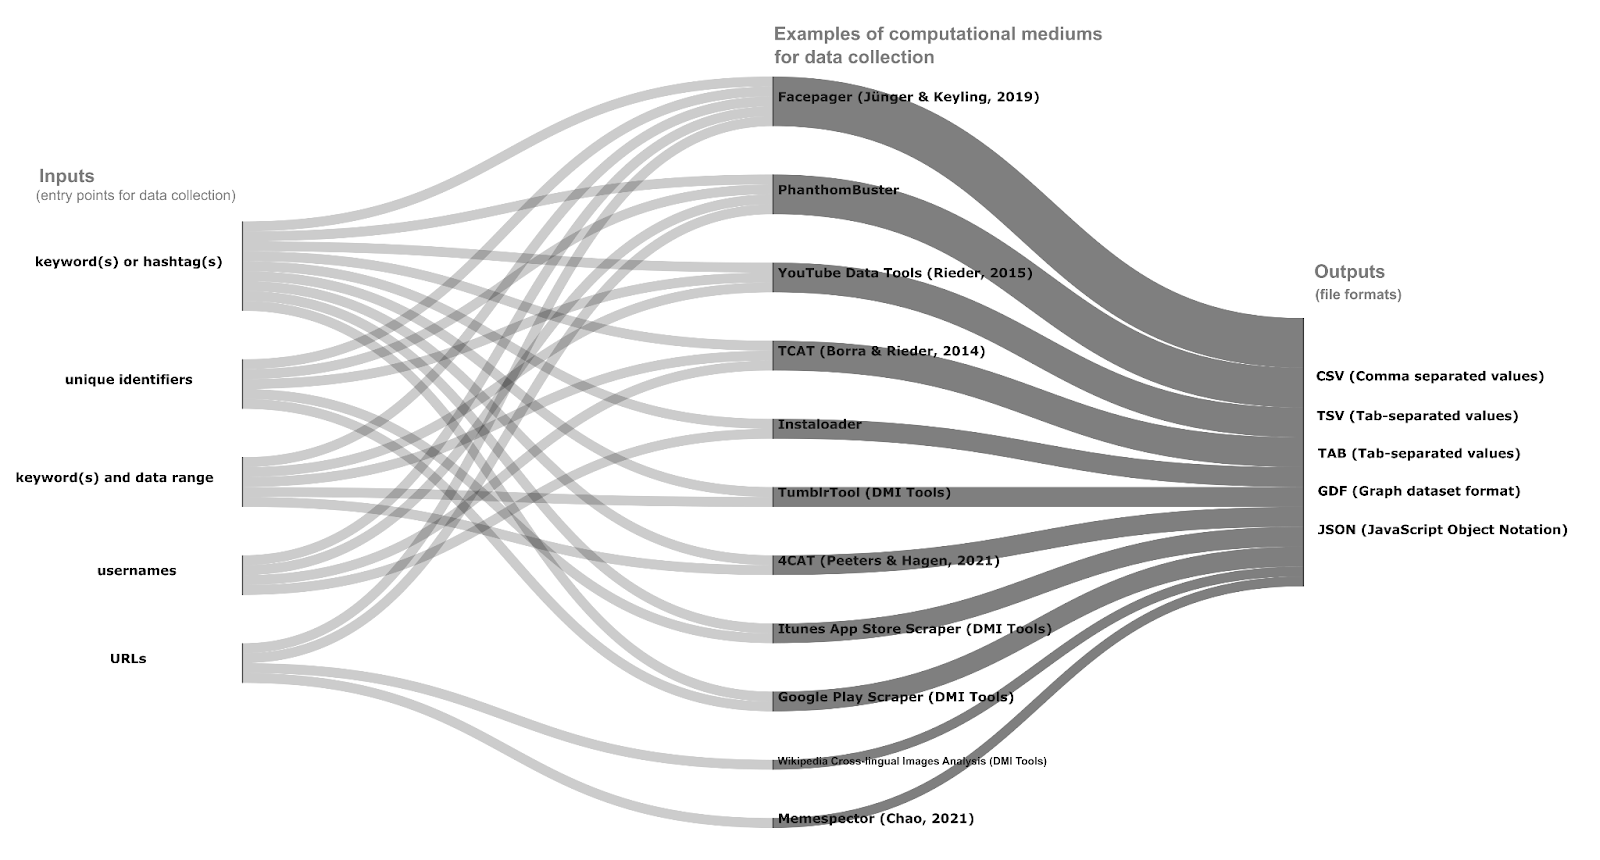
Image source: Omena, 2022.
Examples
List-building based on hashtag engagement | List-building based on a Facebook Pages IDs | List-building based on keywords | List-building based on webpage(s) |
Case study | |||
The study of political polarization in Brazil | The imagery of Portuguese Universities on Facebook | The imagery of Climate Change overtime | Are Google vision API features good enough to classify rare Pepe memes? |
When (data collection) | |||
March 2016 | March 2017, 2018 & 2019 | July 2019 | March 2021 |
Platform, entry point to data collection & list-making type. | |||
Instagram I hashtags I Specified query (program & anti-program) Hashtag list-making takes advantage of previous knowledge about Instagram grammatisation and the possible analytical approaches afforded by hashtag-based data. For example, using networks of hashtag co-occurrence, account-based analysis to explore the fieldwork. Data collection occurred in several iterations from 13-31 March 2016 and was supported by Visual Tagnet Explorer (Rieder, 2015) (a tool no longer available). The datasets were organised in a datasheet. | Facebook I Page IDs I Account name-based query The list of Facebook Pages was defined according to the 15 universities that comply with the Council of Deans of Portuguese Universities – CRUP, covering all Portuguese Public Universities and the Portuguese Catholic University (the oldest private higher education institution in Portugal). CRUP represents more than 80 percent of all students enrolled at Portuguese universities. | Google Image Search results I “climate emergency” I Underspecified query Collected the top 100 image URLs per year (2008-2019) using Google Image Search URL Extractor (a tool no longer available), and the URLs of the pages hosting the images with the query climate emergency. (see the methodology here: Christ et al. 2019) | Webpage I rare-pepe.com I Expert-list based query This is an experimental case study to explore web entities' specificity level. All images available in March 2021 were downloaded. |
List of hashtags: | List of Facebook Pages ids: https://www.redalyc.org/jatsRepo/5525/552562132007/index.html | List of image URLs according to Google Images Search results: | Webpage and list of image URLs: https://docs.google.com/spreadsheets/d/1LBz2pY6eOvh9_KLUQ6kRT7YOXm7imbjJlzzIxP7Af3I/edit?usp=sharing |
Exercise: Account name-based query
🔛 Installing software
- Install ImageSorter on your computer
- Watch 📺 the videos: Opening a folder of images on ImageSorter or
Mapping Corona Virus related images on Instagram through the following networks
(The dataset shared to this exercise was built in March 2020)
- Go to Instagram and search for “corona virus” related accounts to make a list of account names and URLs as in this example coronavirus_account list InstagramExplore some accounts by visiting their profiles.
- If you opt to make a referential account list, considering governmental or health institutional accounts, you may need to adopt another search query strategy.
- Now, you need a tool that scrapes the profile picture of the following accounts and the posts of your seed list, e.g. PhanthomBuster
(details in the next section)
- You can explore your dataset through visualising all images with ImageSorter, as demonstrated in this video: https://www.facebook.com/JannaJoceliOmena/posts/102227767156732
How to do data collection using APIs or scrapers?
There are several ways to collect data from the web; the most traditional ones are through manual observation and data collection or the use of screenshots. With digital methods, researchers/students can benefit from three ways to gain information or data from the web environments and social media platforms. We will use both APIs and scrapers to create an image dataset.
- Web crawling: it hunts down information on the web through, for instance, using research tools such as IssueCrawler and Hyphe.
- Web scraping: it finds specific data points and extracts these from a page, for example, using web applications services such as PhanthomBuster, Python scripts as Instaloader or research software like FacePager.
- Calling APIs: it requires specific data points and retrieves these from an application programming interface, for instance, using research software like YouTube Data Tools.
Preparation: what do I need to do and know in advance?
- Define the platform(s) and the data collection method (s) accordingly while understanding its affordances and limitations.
- Be aware of the possible entry points (e.g. hashtags, URLs, account name) and data extraction software, knowing how web and platform infrastructure treats web data.
- Read software instructions carefully and, if possible, watch tutorials.
- Read API documentation by searching for "limitations" or "rate limits" to understand the restrictions and potentials afforded by the studied platform.
- Create one or more research accounts (in case you want to avoid using your own social media or other platform accounts).
- Understand the role/impact of your choices and platform mechanisms on the results obtained.
Software specificity and outputs: what basic questions should be addressed?
- What type of information or engagement metrics can be associated with images?
- See the example below or read YouTube Data API, e.g. video list references)
- What image URLs can I access (e.g. post, profile image, video image thumbnail)? How long do they last?
- What are the limitations of collecting data? Are there alternative solutions?
- Read API documentation by searching for "limitations" or "rate limits" to understand the restrictions and potentials afforded by the studied platform or search engine.
- How far back in time can data be retrieved?
- What are the standard output files? (e.g. .TAB, .CSV)
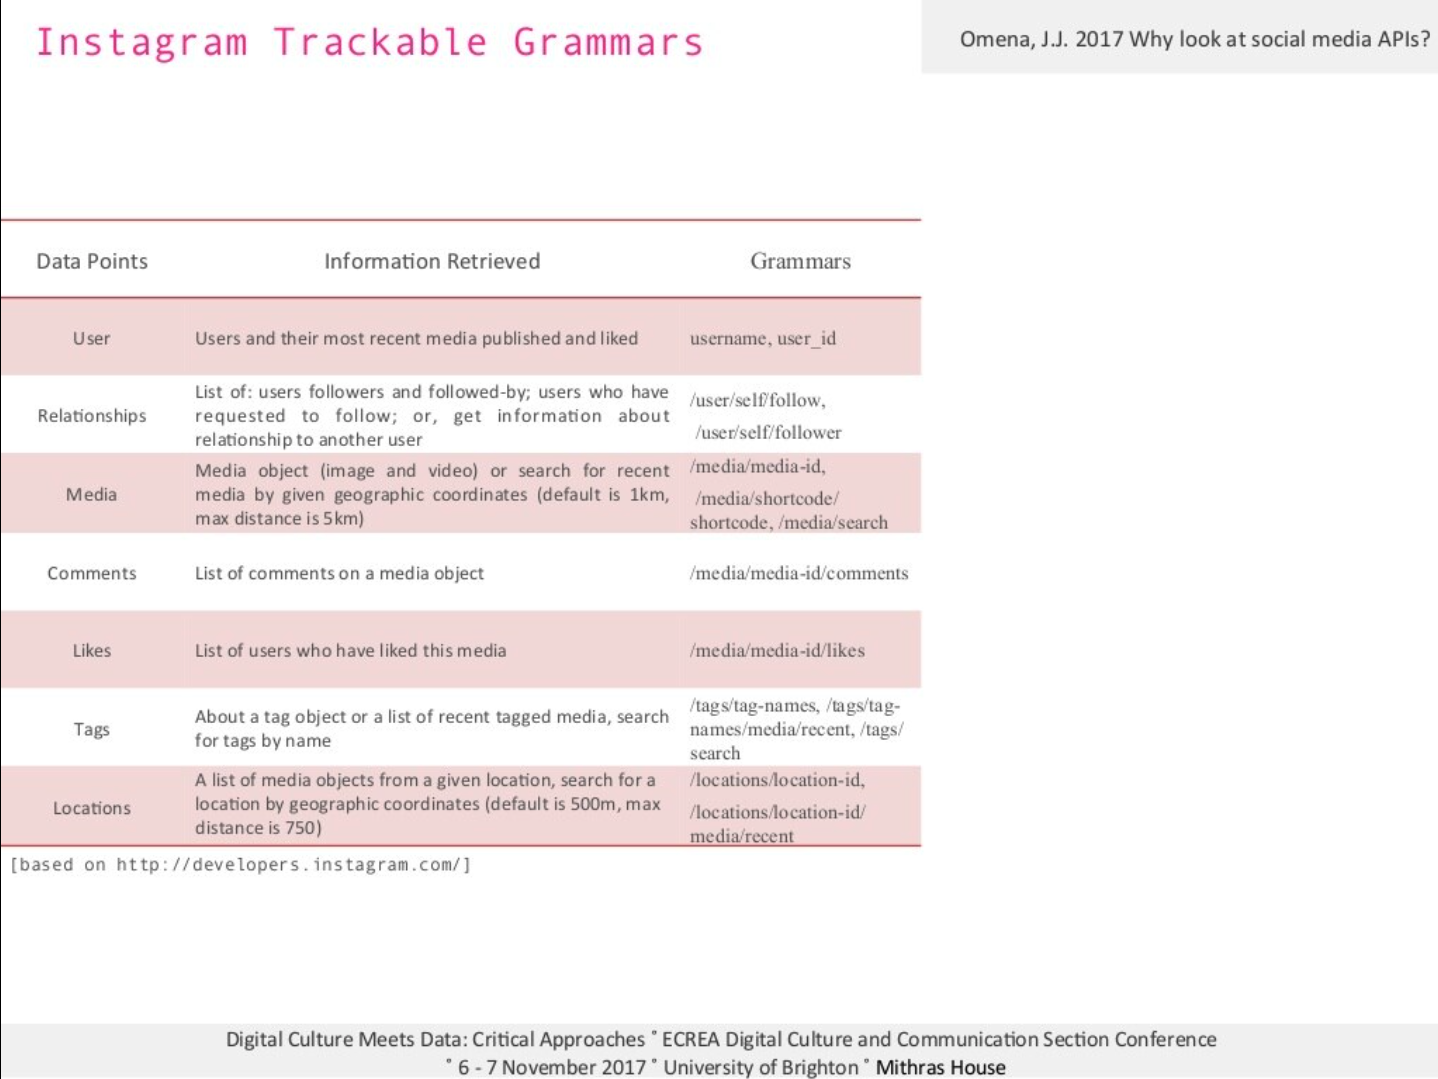
Instagram trackable grammar based on its Platform API. Year of documentation: 2017. Figure source: https://www.slideshare.net/jannajoceli/why-look-at-social-media-apis-81702316
When collecting data: how can I document data collection trials, errors and final attempts?
- Use data collection sheet documentation or text file to record decisions taken and tools used, register the methodological steps, and justify potential changes in list-making. This type of documentation should contain, at least, the chosen platform(s), query(ies), extraction software, date of data collection, chosen parameters, outputs, notes. See below some examples:
- This is the data collection sheet documentation for studying political polarisation in Brazil, 2016 pro- and anti- impeachment protests.
- This is the data collection sheet documentation for studying Portuguese Universities on Facebook.
- This is a text file that records the data collection process of Instagram’s Weekend Hashtag Project.
Exercises
Cross-platform data collection: this is an exploratory exercise and should not be taken as the final definition of your research design. The main objective is to get in touch with data collection tools and be practically aware of what information is associated with an image collection.
- Make a copy of the table below and save it on a separate document.
- Define your query design for each platform and according to its affordances.
- Use the suggested research software or web service data collection application
- Read the instructions carefully before running the software.
- Run the tool and save its output files.
- A good practice is to rename the file for better dataset organisation and create a dataset folder.
- Open the file, e.g. in a spreadsheet, and see what you have.
Platform | Query | Data extraction software | Date of data collection | Parameters | Outputs |
YouTube | Bolsonaro | 18 August 2021 | Iterations: 1 Ranked by relevance | The script has created a file with 50 rows. videolist_search50_2021_08_18-11_07_40.tab | |
YouTube | Add a search query or video(s) id(s), video list id(s), channel id(s)] | ||||
Tumblr | Add a tag | ||||
Wikipedia | Add a full URL to a Wikipedia article | Wikipedia Cross-lingual Images Analysis | |||
TikTok | Add one or more tags | ||||
Add keyword(s) or hashtag(s) or usernames URL(s) | |||||
Add page IDs or full URL |
How to prepare an image dataset?
🔛 Installing browser extensions
- Install DownThemAll and Download All Images on your web browser
[use: https://regex101.com/]
Define the list of image URLs (Exercise 1)
Cross-platform data collection: this is an exploratory exercise and should not be taken as the final dataset of your project/research. The main objective is to understand in practice how to prepare an image dataset.
- With the output of the extraction software, open the file using a spreadsheet and verify what information is associated with an image, e.g. in this Tumblr dataset, image url is on photo column and the other columns given information about the images such as type of blog post, date and time of publication, title, caption, blog name, note count, post url, tags, source url and source title.
- Find where the image URLs are located and identify the image unique identifier (id) in URL syntax, as illustrated in the table below. Identifying the image id is a crucial step that relates to image download and facilitates network building.
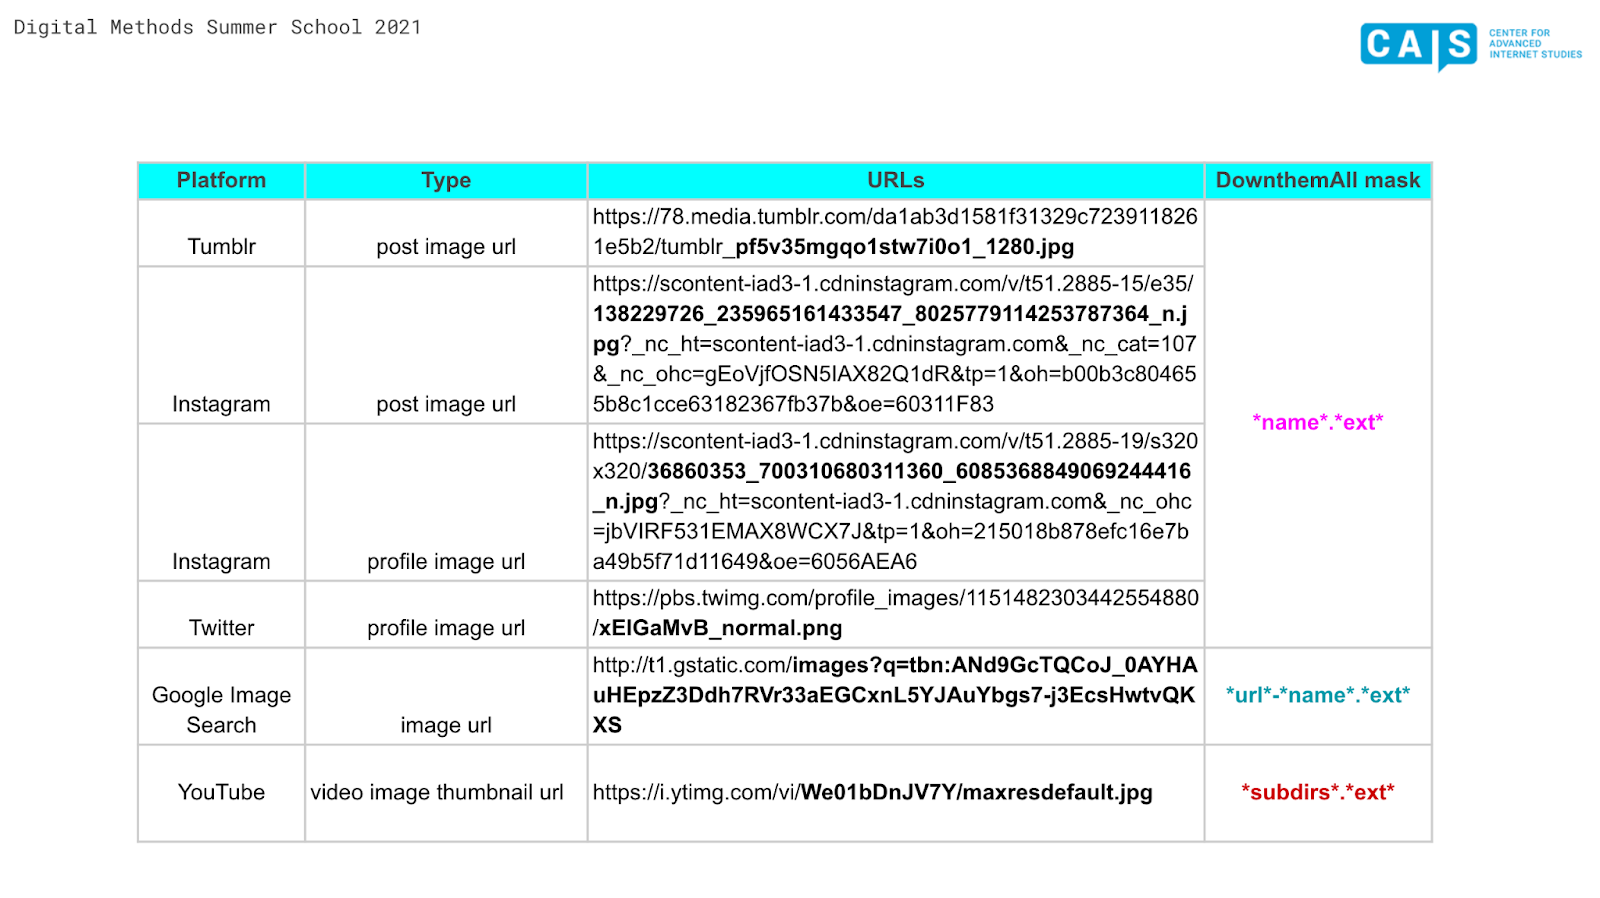
Different image URL syntax and associated masks. Image source: Omena & Jason (2021), retrieved from https://bit.ly/DMI21_ImageQueryTool
Follow the steps below and/or 📺 watch the video preparing an image dataset 1
- To visualise the thumbnails of the images, open the file in a Google spreadsheet, create a new column next to the image URL column and apply the =IMAGE formula. Copy and paste the formula to the other cells and explore the images according to their metadata.
- Before copying the list of image URLs to a text file, you should ask:
- Do I have duplicate posts?
- Make sure you get rid of duplicate posts, e.g. by using data>remove duplicates in post/tweet id (or URL) column.
- Do I need all the images?
- When downloading all images, you can later filter different image collections on demand, by using the Image Query and Extraction Tool. By ensuring you have the images, you avoid the risk of not having them because of the short life span of social media URLs.
- To download a partial list of image URLs, you should define what are the parameters to be adopted, e.g. period of time, geolocation, by filtering the corresponded column.
- Copy the image urls in a text file, e.g. TextEdit, (if using a MacBook, before pasting the urls, go to format>make plain text)
- Make sure you avoid copying blank rows or rows with errors.
- Rename the text file according to your dataset or project, e.g. tumblr_coronavirus_2021_IMGurls.txt
Download the images (Exercise 2)
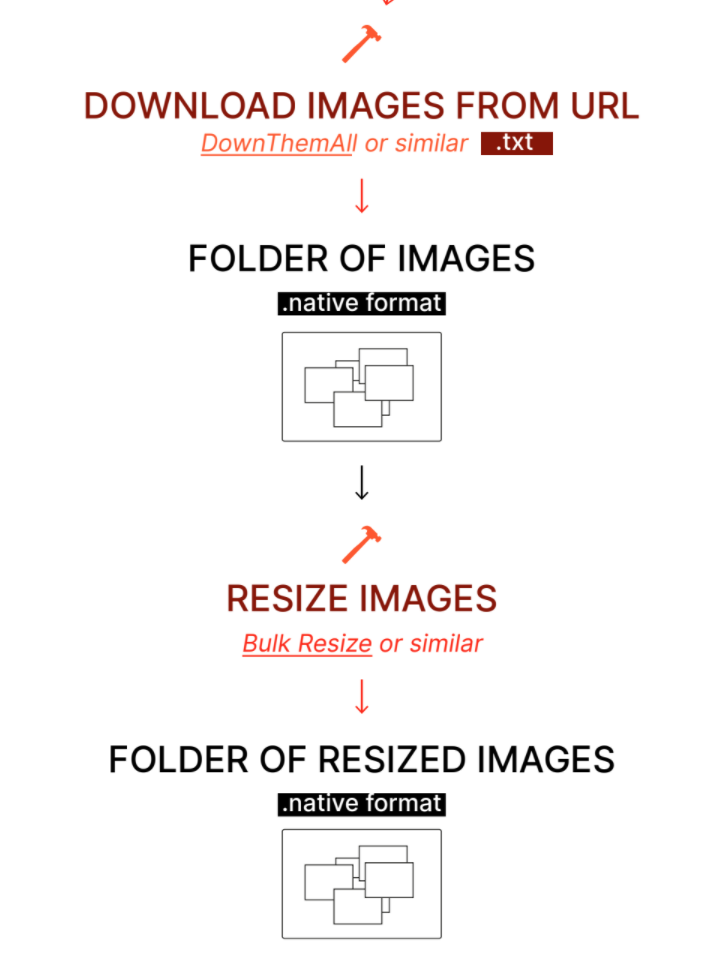
Follow the steps below and/or 📺 watch the video preparing an image dataset 2
- Use DownThemAll or Download All Images.
- To download images with DownThemAll, you first need to install the extension in your web browser (e.g. FireFox, Chrome or Opera).
- Click on the DownThemAll icon and go to the manager.
- Right click to import the text file containing the list of image URLs.
- Before downloading all images, make sure you are opting for an appropriate mask that should name the image file according to the image id found in the URL syntax.
- See below some examples of masks applied to extract image ids from different URL syntaxes. *name*.*ext* usually works well
- In DownThemAll manager:
- Import the text file and select two or three image urls. Choose the mask *name*.*ext* (if it does work, test other options!) and give a name to the image folder.
- Download the images, if the image name file corresponds to the image url syntax, download all the images!
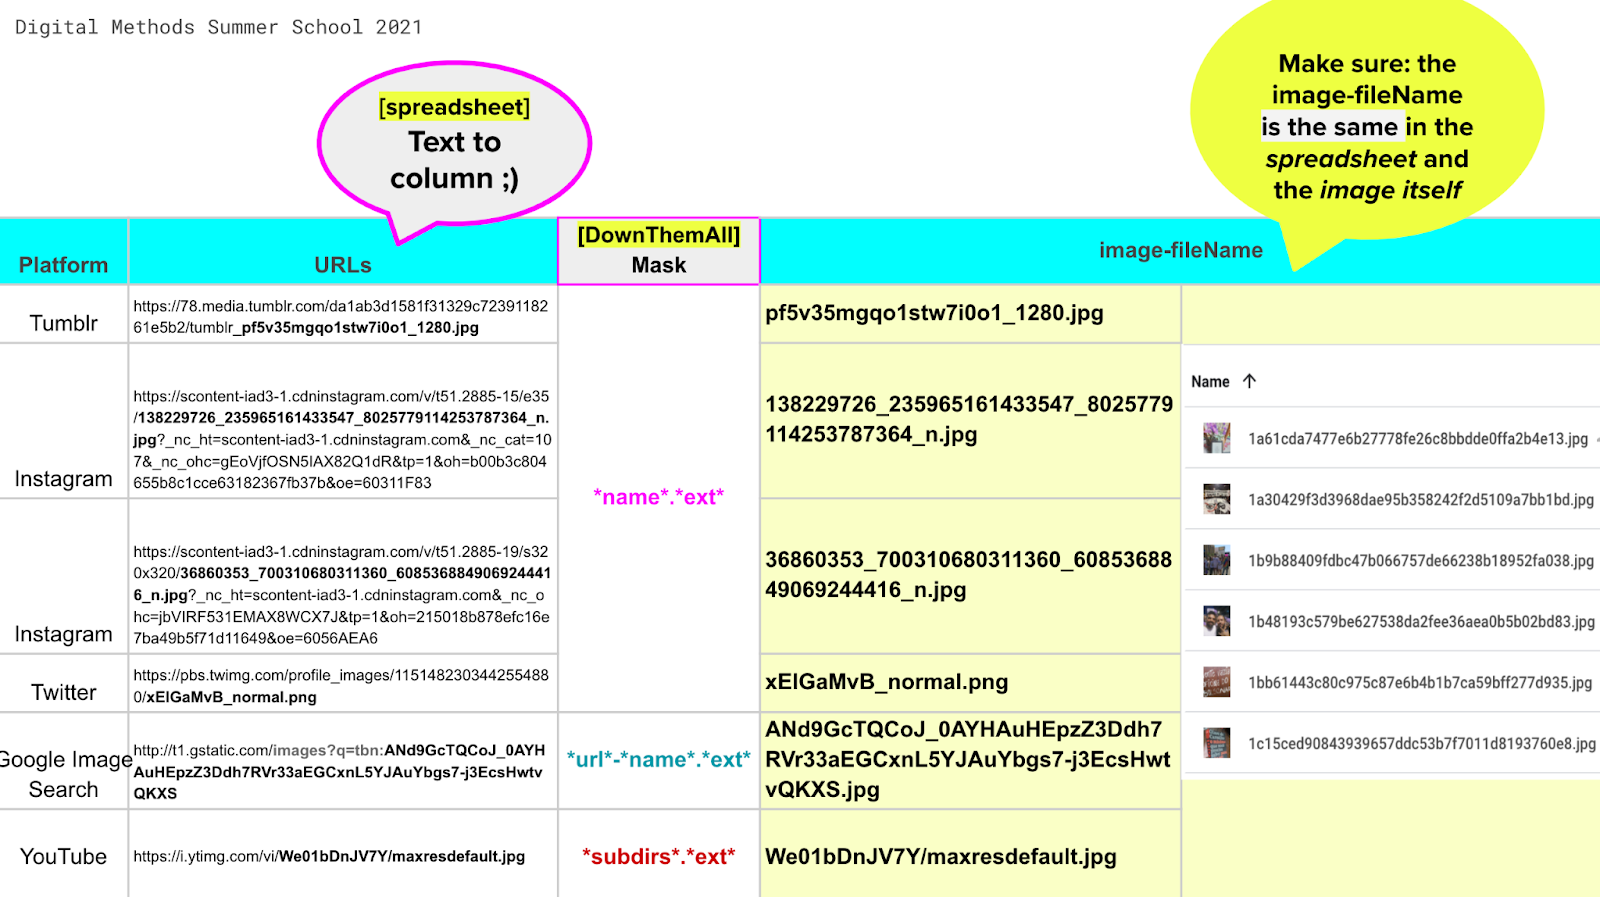
Figure xx. Different image URL syntax and associated masks. Image source: Omena & Jason (2021), retrieved from https://bit.ly/DMI21_ImageQueryTool
- If necessary, resize the image folder using web apps such as BulkResize.
Create a column to image id (exercise 2) or other image attributes
Now, you need to create an extra column in your spreadsheet to image id (this task can also be performed before image downloading 😉).
- Use data> split text to column>separator: costum (as suggested in the previous figure)
- The custom separator depends on the image URL syntax. Using figure xx as an example:
- For Tumblr: _
- For Instagram and Twitter: /
- For Google Image results: tbn:
- For YouTube: vi/
Don´t forget to make sure that you have the same image name file in your spreadsheet (img-id column) and in the image folder (img-file name).
Exercise
- Define a query design according to your project, justifying your final query and also document data collections parameters, using a spreadsheet or other resources.
- Download and analyse the images according to colour clusters using ImageSorter.
❣ Software references
Please go to https://bit.ly/research-software-sheet. In this software sheet you find all references and extra info about the list of research software and tools used in this section 🤓💪🏻
⚠️ What can go wrong?

⚙️👩🏻💻 Invoking Computer Vision APIs with Memespector GUI
⏮ What precedes network building?
- The image dataset and the computer vision API feature
- Some technical knowledge about the chosen computer vision feature
▶️ What can define network content?
- The image dataset and the computer vision API feature
- The researcher/student decision in creating new node attributes
Get familiar with the chosen computer vision feature
Visit the links available in the table below that correspond to the features you want to use. This method recipe focuses on two main capabilities of computer vision: image classification and web detection, highlighted below in grey.
(Open source model) | |||
Safety - adult, violent and racist elements Face - emotional expressions of faces Label - generalised labels defined by Google Web - web entities (inferred descriptions from similar images on the web), similar images, full/partial matching images, visually similar images and web pages with matching images Text - the text recognised Landmark - well-known or prominent sites Logo - logos of popular products | Adult - explicitly sexual, sexually suggestive and blood/gore Brands - logos of brands in consumer electronics, clothing and more Categories - 86-category taxonomy Description - a human-readable sentence that describes the image's contents Face - human faces with age and gender Objects - objects or living things with bounding box coordinates Tags - recognisable objects, living beings, scenery and actions | General - concepts including objects, themes, moods and more Apparel - fashion-related concepts Celebrity - recognised celebrities Color - dominant colours present Food - food items Moderation - gore, drugs, explicit nudity or suggestive nudity NSFW - nudity Textures and Patterns - common textures (feathers, woodgrain), unique/fresh concepts (petrified wood, glacial ice) and overarching descriptive concepts (veined, metallic) Travel - specific features of residential, hotel and travel-related properties | Labels from the ImageNet dataset Caution: The API that serves open source pre-trained computer vision models is experimental. It does not offer the same level of performance as the commercial APIs. The default endpoint in Memespector-GUI is for evaluation purposes only. |
Table xx. A summary of web-based computer vision features supported by Memespector GUI (Chao, 2021).
📝🔥Notes & lessons learnt
Label detection cross APIs
- Image classification provides ontological or topical structures that may change according to the machine learning models used by vision APIs services.
- One may be aware of how labels are delivered, understanding that textual descriptions are assigned to an image (e.g. labels or tags such as food) and these descriptions are always accompanied by high or low confidence scores (from 0 to 1) and ranked by topicality rating. This informs us about both the probability of the textual descriptions assigned to an image which follows a hierarchical way of classifying what is in an image, as in the example below.

Visual learning and computer vision outputs: an example of an ontological structure based on Wordnet (Fei-Fei & Deng, 2017). Image source: https://www.image-net.org/static_files/files/imagenet_ilsvrc2017_v1.0.pdf
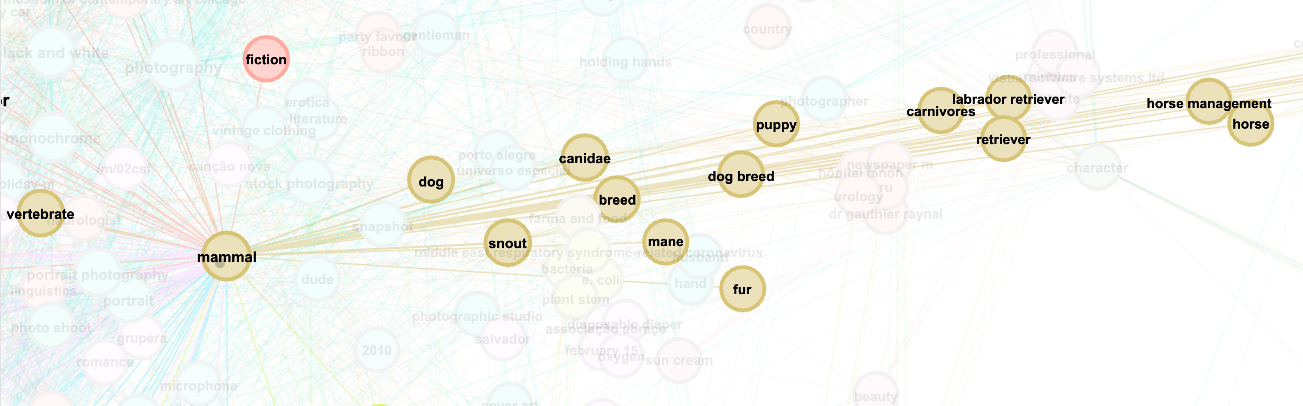
Visualising Google Vision’s topicality ranking within a network of web-entities co-occurrences.
Example 1: mammal>dog> dog breed>retriever>labrador retriever. Example 2: mammal>snout>mane>horse>horse management.
Google Vision’s web entities detection
- When are web entities contextual enough?
- Web entities can only provide contextual and temporal description if image context or what surrounds the image itself relates to relevant facts or information, found in established and/or trustful web pages.
- One may say that web entities are contextual enough when images mean something or are meaningful enough to be taken as a web entity. This decision is associated with what are relevant facts and information to Googl
When Google Vision’s web detection pages with full matching images are not really fully matched
- When using a collection of images that don't live on the Web (or at least no indexed by Google):
- Google Vision returns nothing
- In the network, the images will be isolated
- If the image is a meme using two pictures, one well known and the other not (as in the figure below):
- Google Vision prioritises indexed images (e.g. Duomo) over not indexed ones.
- In the network, the link domain would thus correspond to the indexed images (e.g. Duomo).
- If the image has the different visual elements and text:
- Google vision returns images with the same visual elements, but in a different language (as in the figure below)
- When using a list of webpages where fully matched images are found, it is possible that at the time of content analysis, some images may no longer be available because pages can remove or update (image) content and edit its URL syntax.
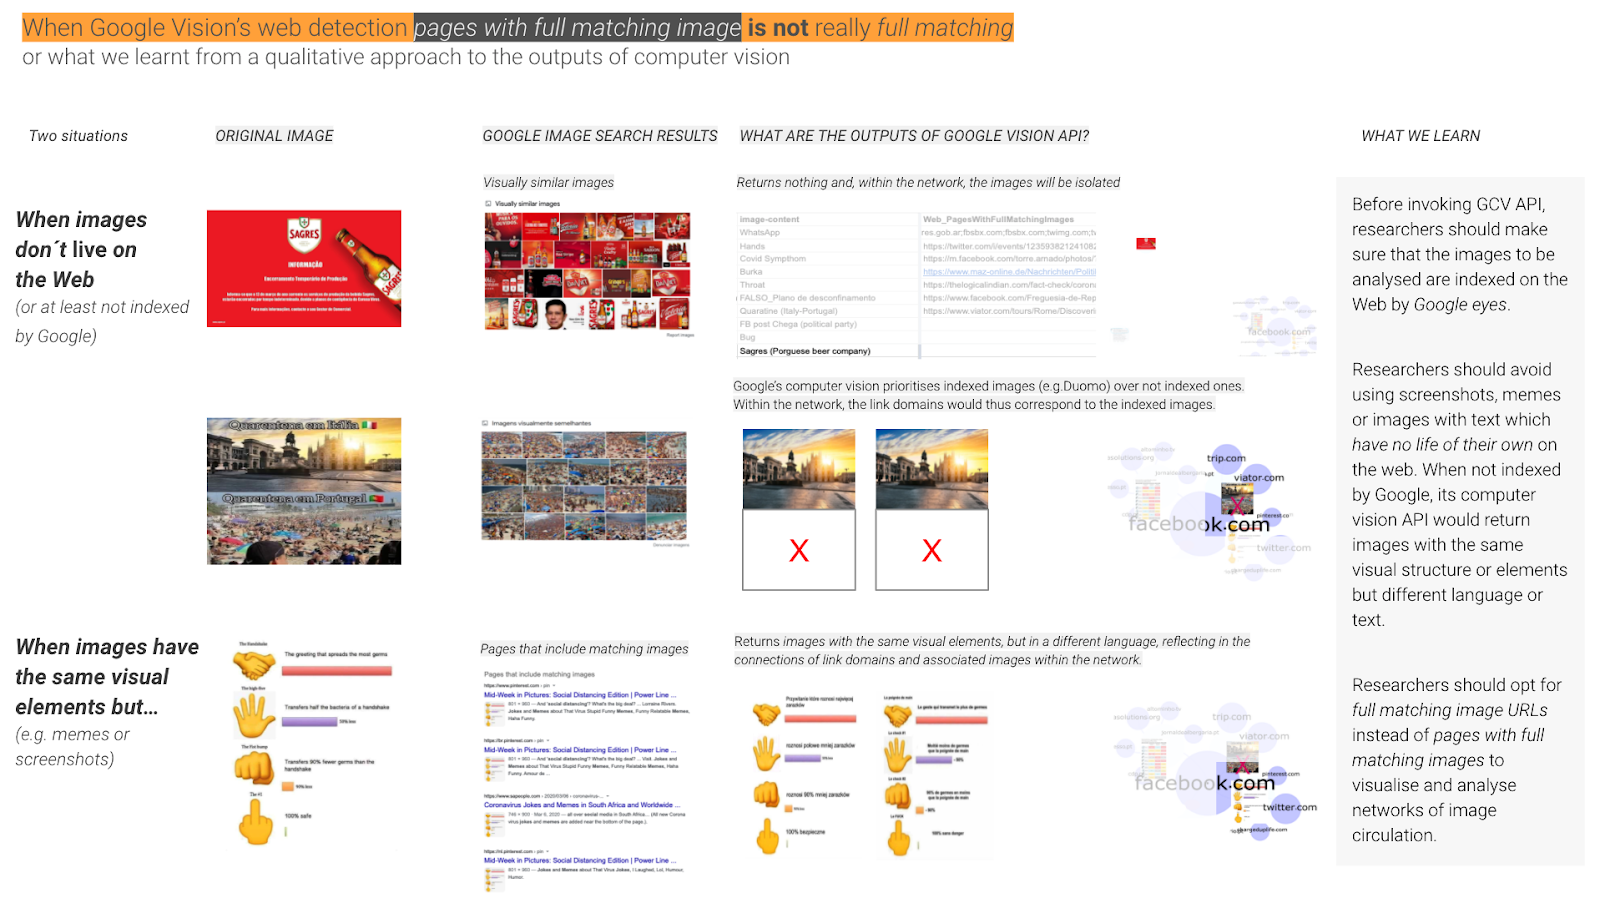
Gaining access to computer vision APIS
- To invoke vision APIS you need to get authentication keys and also associate your credit card to these web services. To sign up for different web vision APIs, follow the instructions by Jason Chao:
- Signing up for Google Cloud: https://github.com/jason-chao/memespector-gui/blob/master/doc/GetKeyFromGoogleCloud.md
- Save the credential file in a safe place on your computer.
Don´t share this file with others!
- Signing up for Microsoft Azure Cognitive Services: https://github.com/jason-chao/memespector-gui/blob/master/doc/GetKeyFromMicrosoftAzure.md
- Save the endpoint and subscription key in a safe place on your computer. Don´t share this info with others!
- Signing up for Clarifai Vision: https://github.com/jason-chao/memespector-gui/blob/master/doc/GetKeyFromClarifai.md
- Save the API key in a safe place on your computer.
- Don´t share this key with others!
- Commercial vision APIs offer a free trial budget that might be good enough for the development of a project with 10-15k images.
Installing and using Memespetor GUI
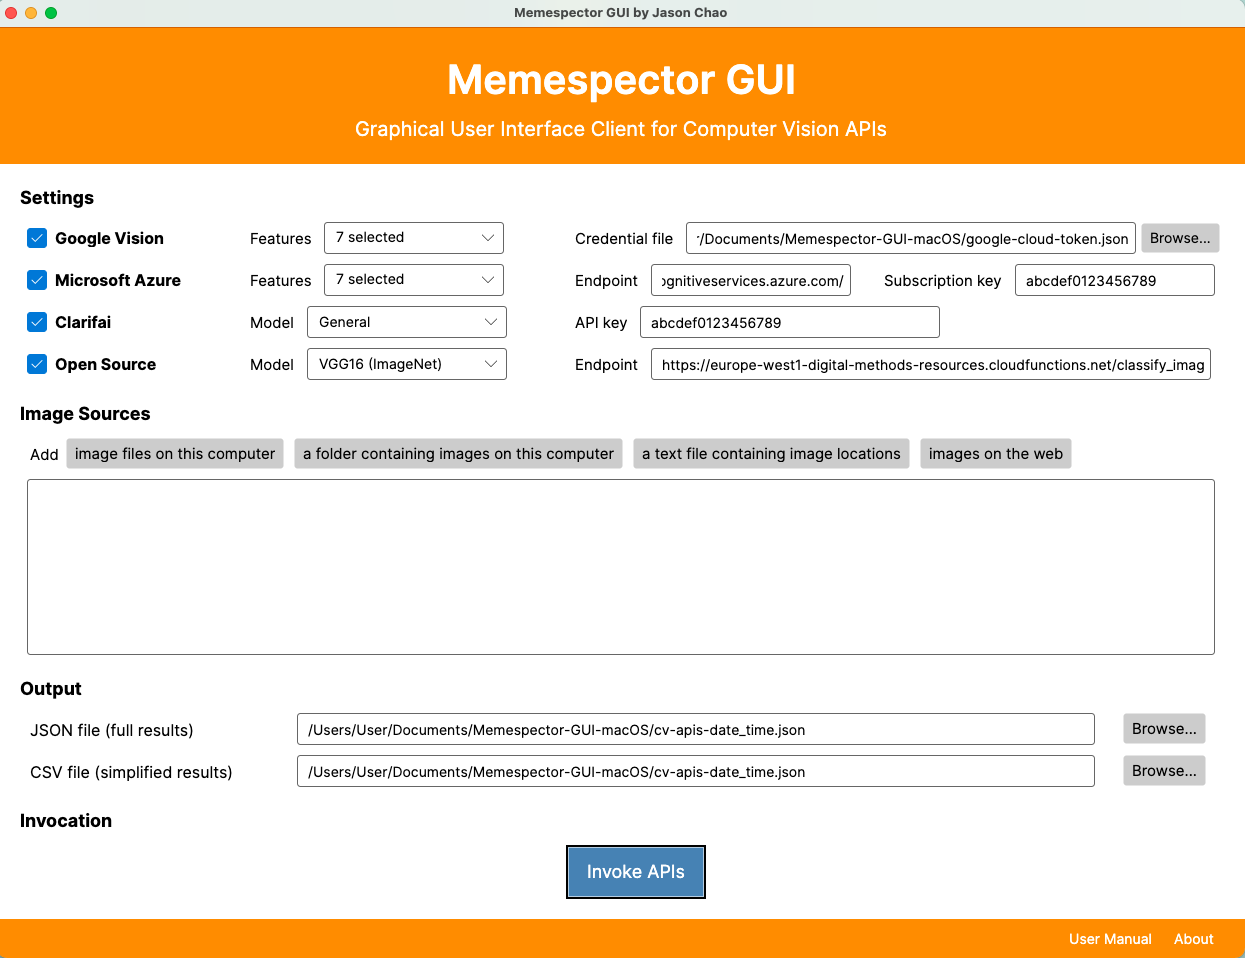
Memespector Graphical User Interface (GUI) is a research software developed by Jason Chao that supports multiple computer vision APIs, serving well the study of large image collections. With an user-friendly interface, Memespetor GUI assists researchers/students to use web-based vision APIs, particularly those who are less familiar with coding or running script files. The creation of this research software is inspired by the original memespector projects of Bernhard Rieder and André Mintz but distinguishing from the previous projects by its capacity to easily invoke multiple computer vision APIs. The first version of Memespector GUI (0.1) was launched in January 2021 at the SMART Data Sprint (watch the tutorial here), while the new version (0.2) was developed in the context of a collaborative project about computer vision networks at the Center for Internet Advanced Studies in Bochum, Germany.
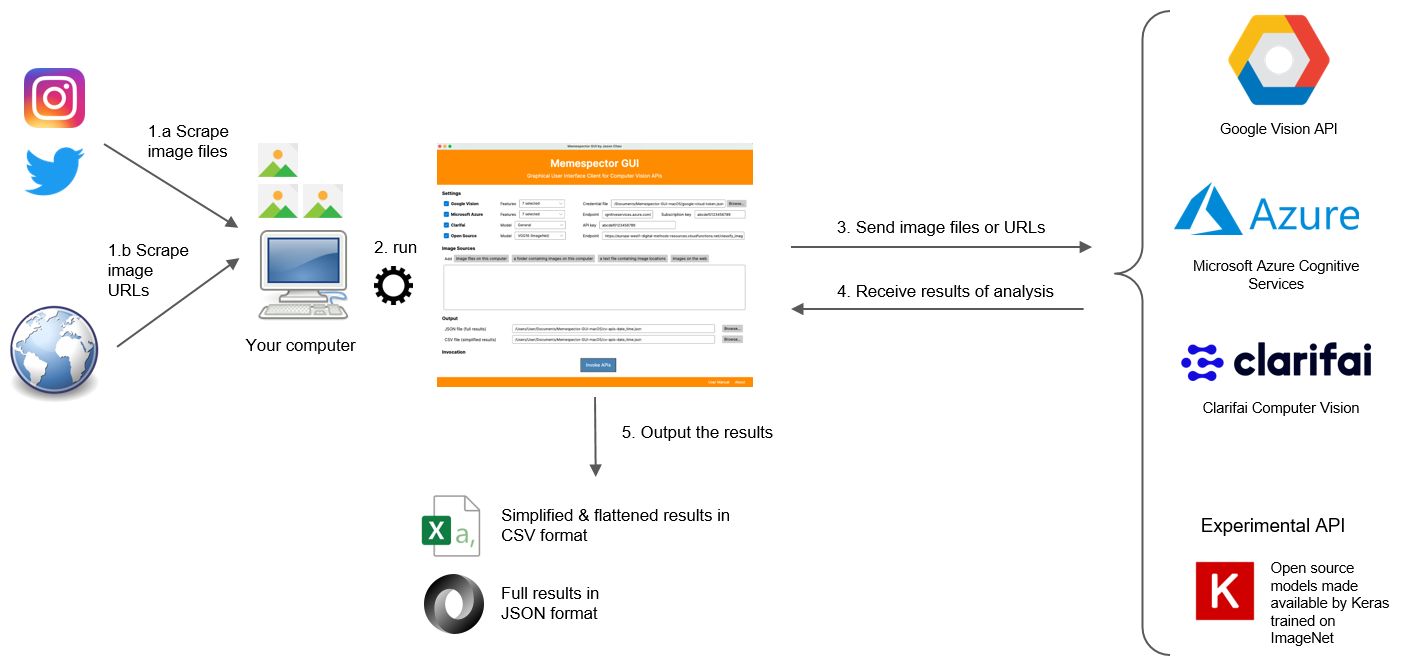
Using Memespector GUI. Protocol by Jason Chao.
About Memespector GUI: https://publicdatalab.org/2021/10/27/memespector-gui/
To download and install Memespector GUI go to: https://github.com/jason-chao/memespector-gui/releases/
- To learn how to use Memespector GUI read the instructions here:
https://github.com/jason-chao/memespector-gui; or 📺 watch the video the tutorials Using AI to enrich image data (version 0.0.1) or Enriching image data with AI (version 0.2.4) or follow the steps below:
- Open Memespetor GUI and upload your Google Cloud’s credential files, also inserting your Microsoft and Clarifie keys (they will be saved on memespector GUI)
- Select the vision API(s) and corresponding features.
- Add images to Memespector GUI.
- Make sure the image folder is saved on your computer or a list of image URLs is easily accessible.
- If the image dataset contains more than 6-7K images, use a text file containing image locations, rather than uploading an image folder in Memespetor GUI. (e.g. drag and drop the image folder on Terminal, copy the folder location to a text file and save the file [.txt]).
- Edit the name of the output files according to your project, e.g. climateEmergency_gcvapi_webdetect_resultsJAN2019.csv
- Click Invoke APIs after you have changed the APIs' settings, added image files or URLs to the Image locations box and/or edited the output filenames.
Exercise
- Use the image dataset that you have downloaded in the previous exercise and invoke one or more vision APIs.
- Choose one or more computer vision features according to your project (or curiosity).
❣ Software references
Please go to https://bit.ly/research-software-sheet. In this software sheet you find all references and extra info about the list of research software and tools used in this section 🤓💪🏻
⚠️ What can go wrong?

⚙️🧐 Situating an image dataset
⏺ List of useful videos
- Preparing an image dataset
- Situating an image dataset
🔛 Installing software
- Install Gephi & increase Gephi memory // Solving "Cannot find Java 1.8 or higher" Gephi Error: https://www.youtube.com/watch?v=AYtoXdJ4Fv0
💭Possible visualisations:
- Line or bar charts
- Dendongram
- Circle packing
- Rank flow
Image collection and metadata
In order to make sense of images situated context, impact and related actors, be aware of:
- OVERVIEW: obtaining a macro view of an image dataset
- Using pivot table to identify:
- Period of time vs. content (e.g. posts published) and actors
- What’s the time frame?
- How many unique actors vs. the total number of publications?
- Exploring the correlation between images, actors and engagement metrics
- Visualising textual and visual content (including URLs and emojis) & exploring platform grammatisation with RawGraphs
- DETAILED perspective: obtaining a specific view of an image dataset
- Identifying dominant/ordinary images, actors and respective activity
- Creating image grids with spreadsheets and Image Query Tool + Google Slides or PowerPoint (or similar software)
- Categorising content or actors
Before start working with spreadsheets, it is crucial to check:
→ Are there duplicates? Are there blank spaces?
→ How many unique actors?
→ How many posts?
→ How many unique images?
[use data> column statistics]
References:
Colombo, G., & Niederer, S. (2021). Diseña 19 | Visual Methods for Online Images: Collection, Circulation, and Machine Co-Creation. Diseña, (19), Intro. https://doi.org/10.7764/disena.19.Intro
Omena, J. J., Rabello, E. T., & Mintz, A. G. (2020). Digital Methods for Hashtag Engagement Research. Social Media + Society. https://doi.org/10.1177/2056305120940697
Pearce, W., & De Gaetano, C. (2021). Google Images, Climate Change, and the Disappearance of Humans. Diseña, (19), Article.3. https://doi.org/10.7764/disena.19.Article.3
Rogers, R. (2021). Visual media analysis for Instagram and other online platforms. Big Data & Society. https://doi.org/10.1177/20539517211022370
OVERVIEW: obtaining a macro view of an image dataset
Step 1: Using pivot table to situate and contextualise a collection of images (temporal aspects, content and actors)
>> For this activity, please make a copy of the following spreadsheet: instabots
- ARE THE DUPLICATES?
- Check the image urls or post/tweet urls or comments id column to remove duplicates.
- Select the column>Data>Remove duplicates>click the box: data has a header
- 202 duplicate rows found and removed.
- Period of time and actors activity and impact
- Data> Pivot Table> New sheet>Rows (username) + Columns (years) + Values (sum of likes)
- The column year is not working?
- Create a new column next to the post publish date and use the formula: =LEFT>Suggested auto-fill? yes!, e.g. =LEFT(G2,4)(don´t forget to name the new column as year)
- Or, create new columns next to the post publish and use: Split Text to Column>Separator custom: T> rename the cells> copy and paste the year, date and month in another cell>Split Text to Column>Separator custom: - > delete the date and month columns (don´t forget to name the new column as year)
- HOW MANY UNIQUE ACTORS? (select the username column in the pivot table> result: 118) HOW MANY POSTS ARE THERE? (select the post URL column in the original dataset> result: 4.601)
- Who are the accounts attracting more attention over time? (here you can use engagement metrics such as number of likes and comments or the sum of engagement metrics) Select the username and year columns> Insert>Chart
- To sum the total of engagement metrics use the formula: =SUM>Suggested auto-fill? yes!, e.g. create a new column next to likecount column> use: =SUM(E2+F2) Insert>Chart (e.g. check thegreyninja account or other ones)>copy the results in a sheet and create three columns: username, post-engagement, post-activity (don´t forget to paste special>values only)
- Now let’s look at the temporal perspective and type of posts: Pivot Table> Rows (year) + Columns (type) + Values (sum of likes and comments)>Insert> Chart
- Who are the most active users posting images with the hashtag #instabots? (in terms of engagement metrics) Pivot Table> Rows (username) Values (instagrampostURL)> Insert> Chart>copy the results in the new sheet and insert in the column post-activity
- Comparing post-engagement with post-activity:
- Open https://rawgraphs.io/
- Copy the results from the sheet containing the columns username, post-engagement, post-activity, and paste on Rawgraphs
- Opt for Stacked bar chart, then map and customize the chart as it follows:
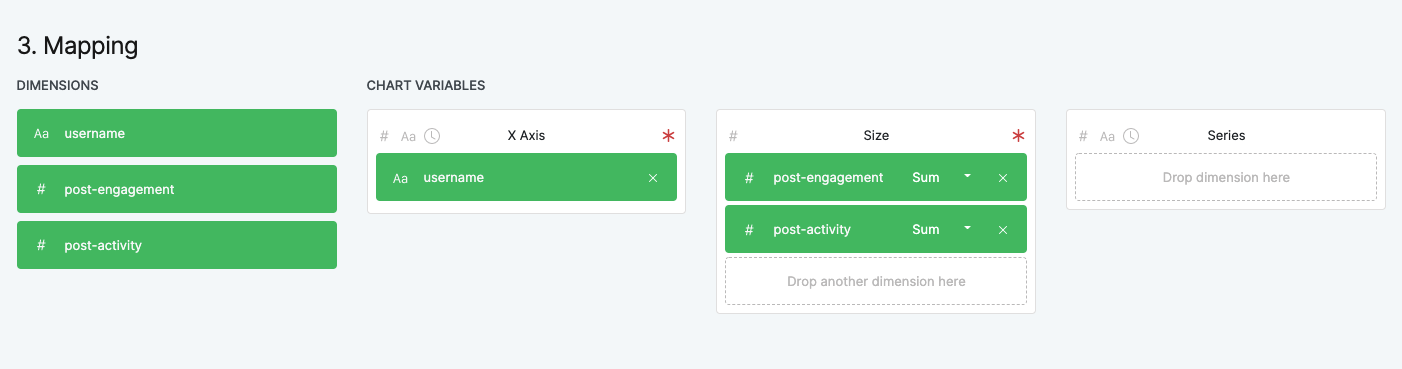
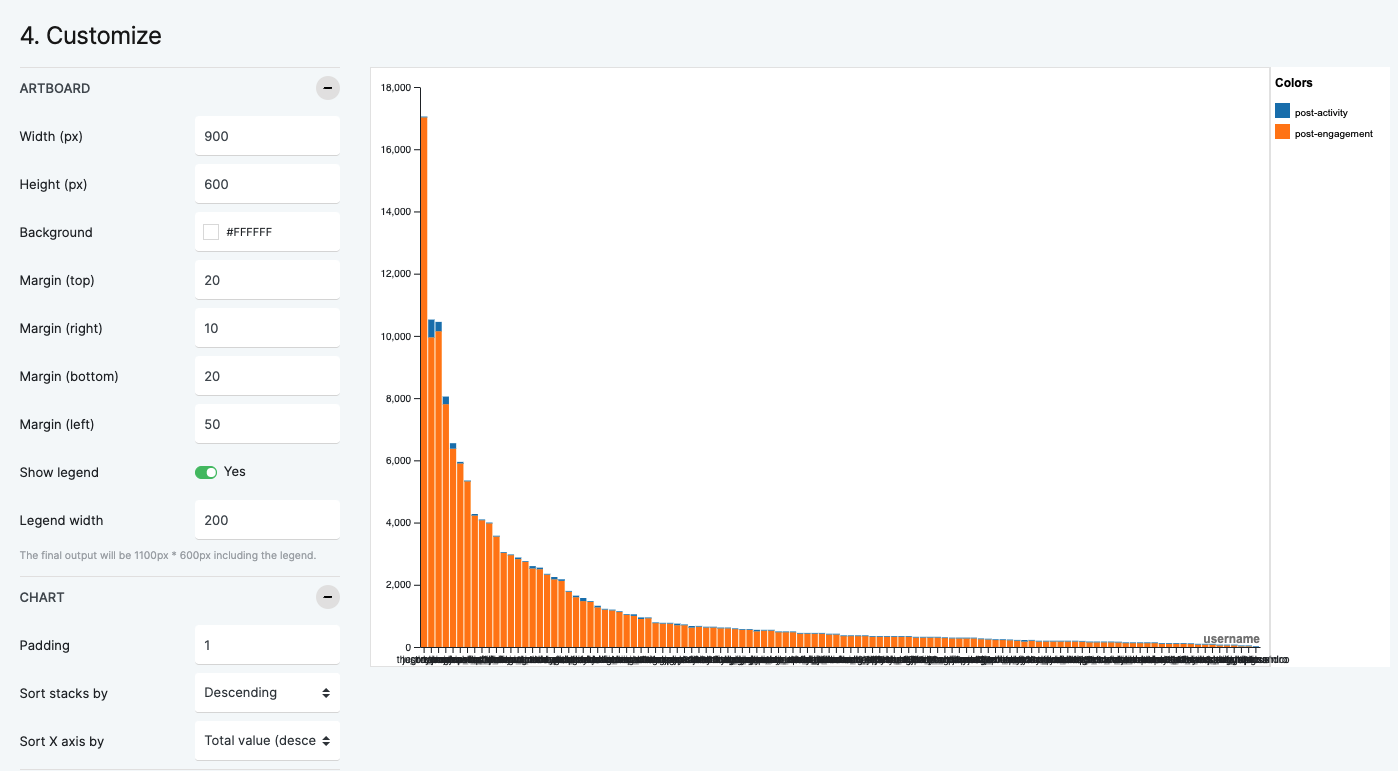
Step 2: Visualising textual and visual content & exploring platform grammatisation (with TagCrowd or WordWonderer or VoyantTools, TextAnalysis, Word Tree, RawGraphs, ImageSorter, Table2Net & Gephi)
>> For this activity, please make a copy of the following spreadsheets: instabots + result-9245-comments + tumblr_deforestation_2021_10_15-05_26_07_media.tab and this image folder. Follow the proposed steps:
- Visualising word frequency with TagCrowd or WordWonderer or VoyantTools (these tools don't work when text is larger than 500 kb)
- Open tumblr_deforestation_2021_10_15-05_26_07_media.tab and open the highlighted tools.
- ARE THE DUPLICATES?
- Check the image urls or post/tweet urls columns to remove duplicates.
- Select the column>Data>Remove duplicates>click the box: data has a header
- No duplicate rows were found.
- In the spreadsheet:
- Use filter in the first row, go to title column and get rid of the blank rows
- Copy the text from the column title and paste it on the tools
- WordWanderer and Voyant are interactive text visualisation tools, make sure you spend some time exploring the results ;)
- You may see something like this:
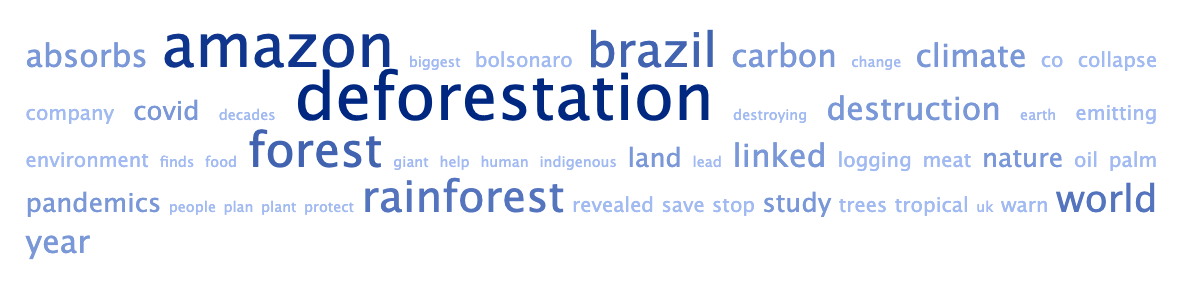
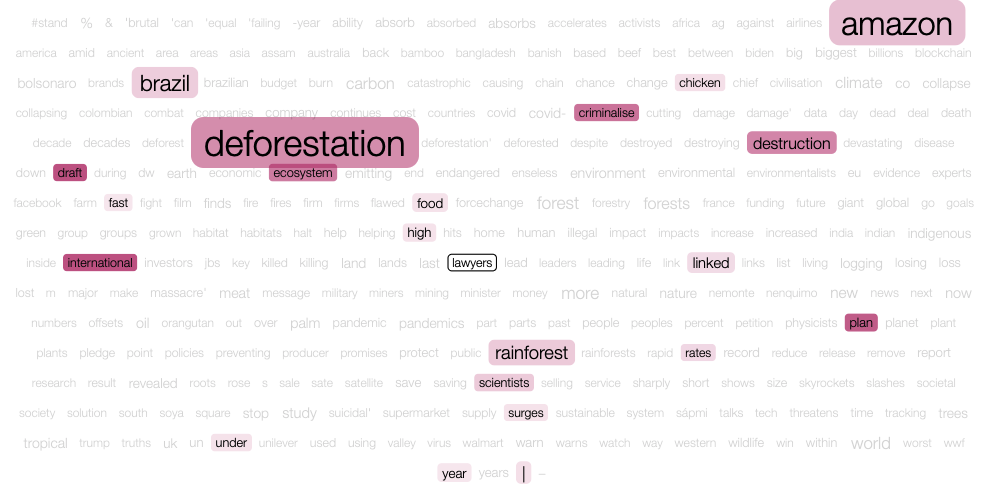
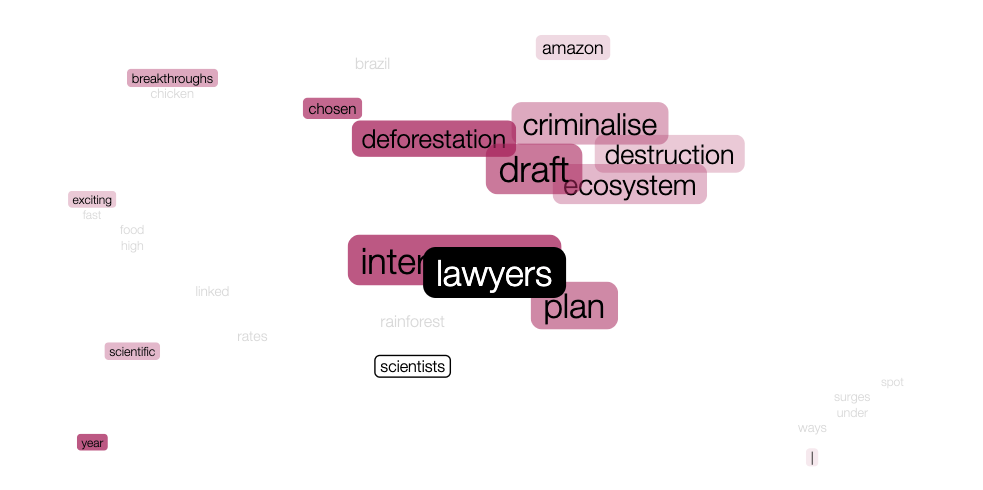
The results from TagCrowd (top right-hand side), WordWonderer (right side down and left side up),
VoyantTools (left side down).
- Generating emoji and bigram/collocation statistics with Text Analysis and creating an emoji treemap with Google spreadsheet and RawGraphs
When using TextAnalysis, ask: Is there a common use of emojis? How about word frequency? What do emojis and bigrams can tell about the subject of analysis?
- In the spreadsheet:
- Use filter in the first row, go to title column and get rid of the blank rows
- Open result-9245-comments
- In the spreadsheet:
- ARE THE DUPLICATES?
- Check the image urls or post/tweet urls columns to remove duplicates.
- Select the column>Data>Remove duplicates>click the box: data has a header
- 18280 duplicate rows found and removed.
- Create a new sheet, renaming it as emoji frequency
- Copy the text from the column comment and paste it on Text Analysis
- In analysis: opt for: emoji statistics
- Copy the TextAnalysis outputs (from emoji stats) and paste it on the newly created sheet.
- The Brazilian flag 🇧🇷 is significantly majority in the comments, this can make the visualisation difficult to read. Let's see what we can do?
- Now, open RawGraphs and copy the emoji stats results there.
- Choose the treemap chart>Hierarchy: frequency>Size: frequency>Color: frequency>Label: alias
- Go back to Load your Data and delete the first row, the one containing 🇧🇷
- Customize the chart:
- Width (px): 900 // Height (px): 600
- Show legend: yes
- Repeat the previous step-by-step, now using instabots
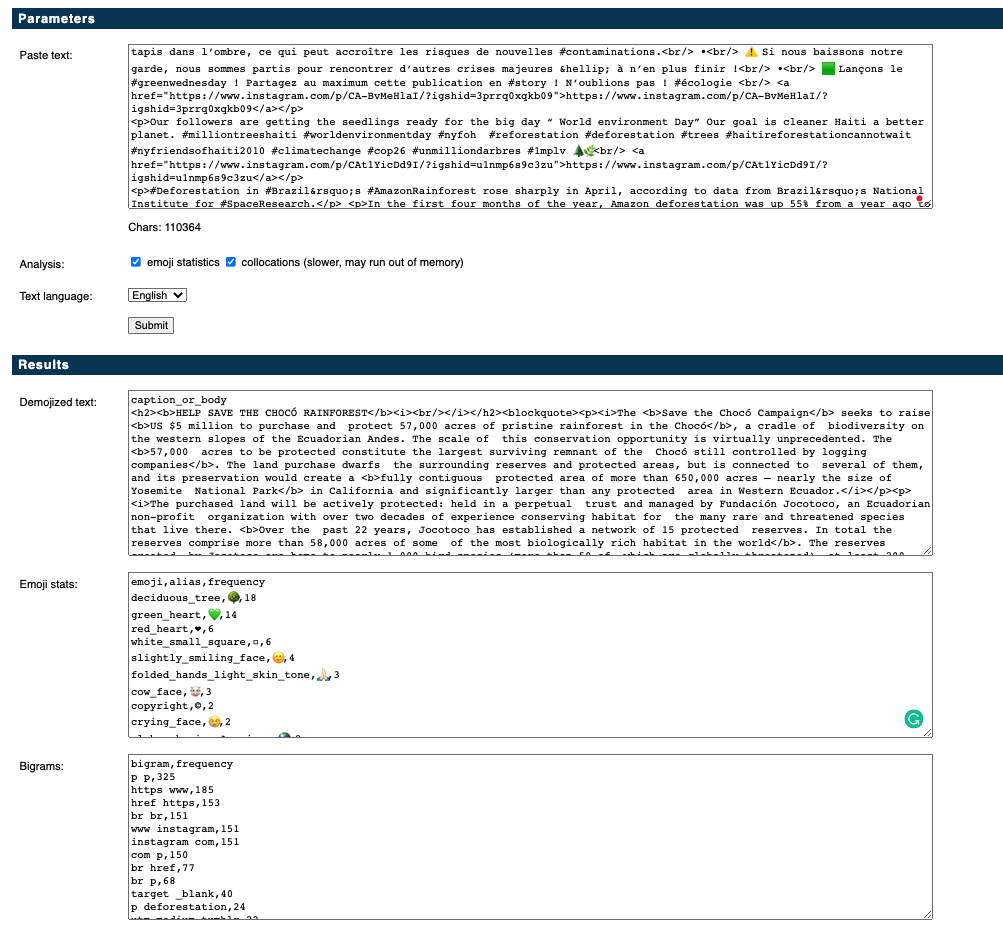
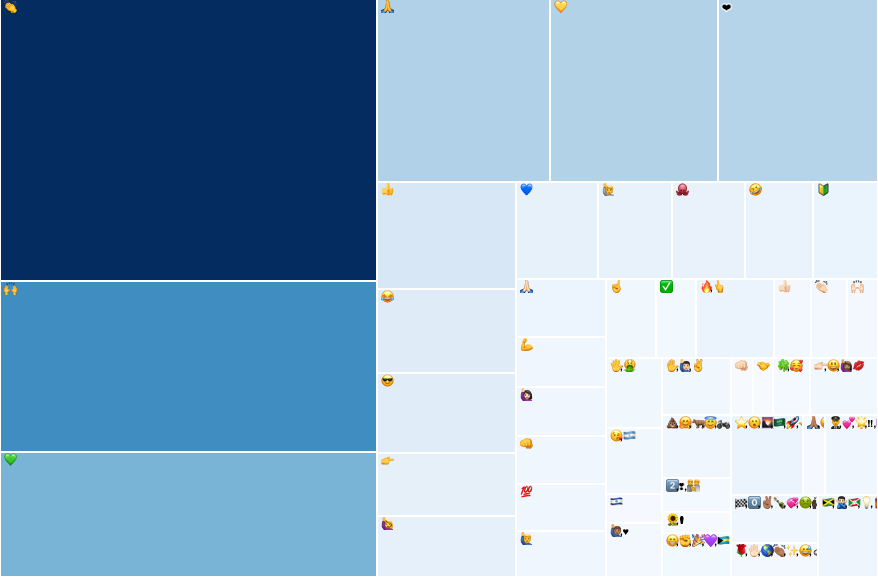
Results from TextAnalysis (left side) and RawGraphs tree map (right).
- Navigating textual content and retrieving information with word trees (Wattenberg & Viégas, 2007) (WordTree)
When using WordTree, which are the most interesting keywords? When searching for #, ask: what are the prominent hashtags? What can these tell? Are there any unexpected hashtags? When searching for http or https, ask: where is content shared? Are there short links? If so, which type (e.g. bit.ly)? Can you identify what type of content is related to these links? When searching for @, ask: who are being mentioned? Are there any patterns or repetition in account mentioning? When searching for emojis, ask: what textual content or actors are related to emojis? What can the results tell?
- Open: instabots
- Copy the text from the column description on WordTree
- Navigate the text, trying out keywords related to the subject of analysis (when identifying interesting insights, don´t forget to take screenshots!)
- Now, search for:
- #
- http or https
- @
- emojis
- Repeat the previous step-by-step, now using tumblr_deforestation_2021_10_15-05_26_07_media.tab
- Using ImageSorter to verify patterns of image repetition or similarities by colour
- Upload this image folder on ImageSorter
- Zoom in and out (when identifying image repetition or similarities, don´t forget to take screenshots!)
- Tip: when using ImageSorter always take a screenshot of the whole and detailed clusters ;-)
- How to navigate ImageSorter and how to display the results?
- 📺 watch the video:
https://drive.google.com/file/d/15EXyszJ03GRmvtwk2-296cl9YYqcNkuv/view?usp=sharing
- Use https://ezgif.com/maker (screenshots and or videos)
- See other examples of displaying the outputs of image analysis with ImageSorter: https://wiki.digitalmethods.net/Dmi/WinterSchool2021Deepfakes#A_4.2._Image_vernaculars_and_trends
& see different ways of displaying the output of image analysis with ImageSorter: https://wiki.digitalmethods.net/Dmi/WinterSchool2021Deepfakes#A_4.2._Image_vernaculars_and_trends
- Creating a network of hashtag co-occurrences
- Open this file: tumblr_deforestation_2021_10_15-05_26_07_media.tab (the step-by-step of this task is available in the following sections)
- Follow my instructions ;)
- Detect the column containing hashtags>Copy this info in a new sheet>Download it as CSV file>Open Table2net>Upload the CSV file containing hashtags>Choose the type of network (monopartite or normal)>Chose the column the define the node (tags)>One expression per cell: comma separated>Define the column the defines the links(row number)>Add weight to edges
>> Let’s re-do steps 1 and 2, now using your own spreadsheet (s)?
Please visit the list of research software and tools: https://bit.ly/research-software-sheet There you will find more options of tools to explore and also the referenced and tutorials related to TagCrowd or WordWonderer or VoyantTools, TextAnalysis, Word Tree, RawGraphs & ImageSorter.
DETAILED PERSPECTIVE: obtaining a specific view of an image dataset
🔜
Step 1: Using spreadsheet formulas to detect dominant/ordinary actors and the Image Query Tool to visualise their related images
Step 2: Using ImageSorter to identify dominant and ordinary groups of images (considering image repetition and temporal aspects)
Step 3: Creating image grids
Filtering and visualising images according to keywords, hashtags, emojis, engagement metrics, accounts, etc.
>> For this activity, and considering the short life span of image URLs, you should use a fresh image dataset. please make a copy of the following spreadsheet:
- Creating image grids with Google Spreadsheet
- Filter engagement metrics (e.g. note counts, likes, comments), keywords (e.g. pollution) and or emojis (e.g.🌳)
- →get rid of blank rows
- Copy the top 20 results in a new sheet and the respective image URLs
- In the new sheet, copy the info and paste special (transposed)
- First copy the values then the related image URLs
- Now add a row for each topic, using the Image URL formula
- Hide the URLs rows (right click>Hide Column), leaving visible only the images.
- Name each row (ex. Top note counts, pollution and 🌳)
- Select the row with values (e.g. engagement metrics) and go to Format>Conditional Formatting>scale min/max/midpoint values (don´t forget to take a screenshot!!)
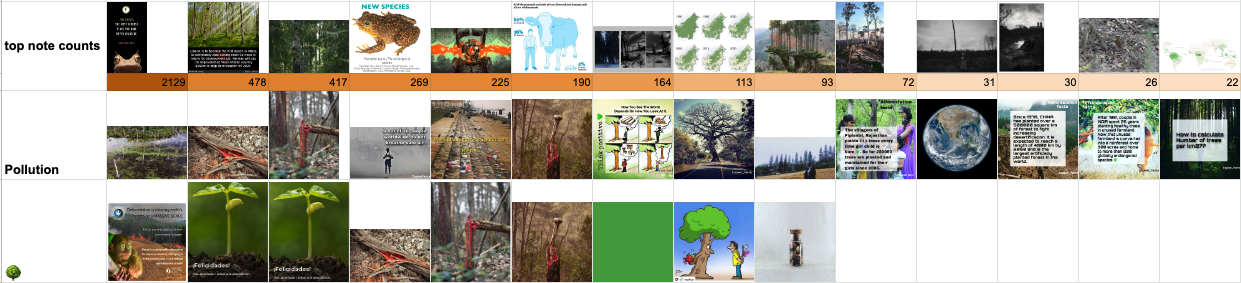
Image collection and computer vision outputs
Data Exploration (with Google’s Best Guess Label on Instagram: Understanding Images and its circulation)
>> Use the recipe created by Francisco W. Kerche:
Image description with labels or web entities
(using Google Vision’s “label” or “web entities” or Microsoft Azure’s “tags” or Clarifai’s “concepts” or ImageNet’s “label”)
>>Use your own dataset or one of the following spreadsheets:
microcefalia_labels&webEntities
>>Folder containing the files of the following step-by-step proposal:
https://drive.google.com/drive/folders/1vluLhLbOp-42iDrKftHfqDrLId1QYdrG?usp=sharing
Follow the steps below and/or 📺 watch the video:
Making sense of the visual content through labels or web entities co-occurrence networks
>> Network of co-occurrence of labels or web entities
> Copy the label or web entity column in a new sheet
Choose one of the following columns:
- GV_Label_Descriptions
(textual descriptions based on the image material content)
- GV_Web_Entity_Descriptions
(textual descriptions based on web content)
> Get rid of blank spaces (if there are any)
> Download the sheet as a CSV file.
> Upload the file on Table2Net:
Type of Network: normal
Nodes: the label or web entity column in your file
One expression per cell: semi-colon separated “;”
Links: row number
> Build and download the network (GEXF file).
> Open the GEXF on Gephi
> > To shape and make the network ready for exploration use ForceAtlas2 (or other force-directed algorithm), colour and size the nodes.
Visualising image descriptive clusters with a circle packing chart
Memespector GUI output>Gephi>Spreadsheet> RawGraphs>Circle Packing
>> Detecting visual content clusters with a circle packing chart
> In Gephi, run modularity.
> Go to Gephi Data Laboratory and Export table
> Open the exported file on Excel, for example.
> Copy and paste the table on RawGraphs 2.0
> Opt for the Circle Packing chart, and the chart variables as defined below:
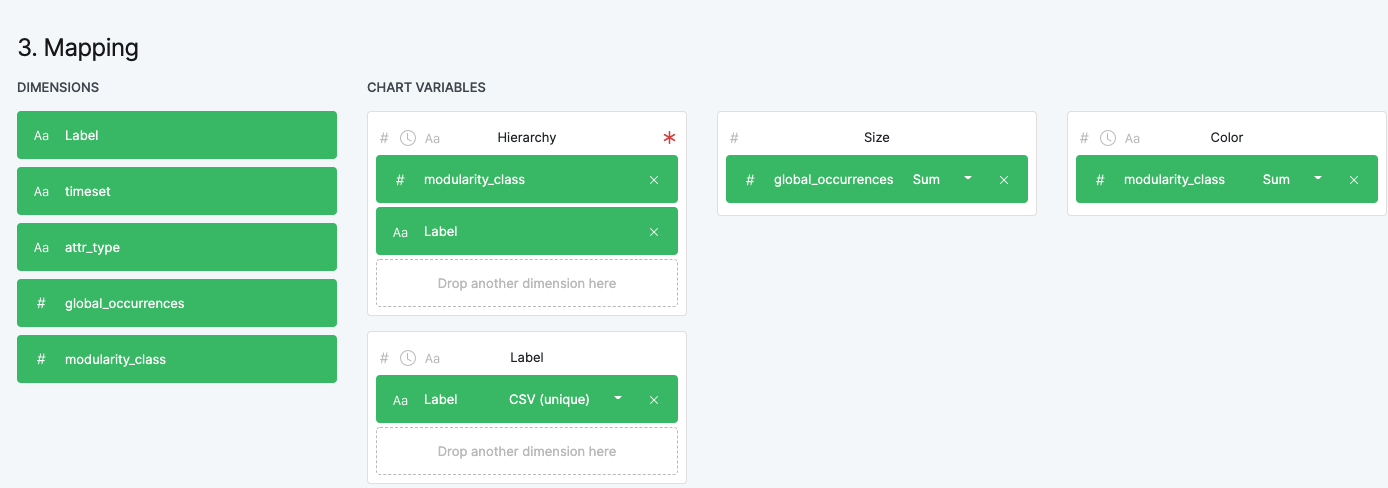

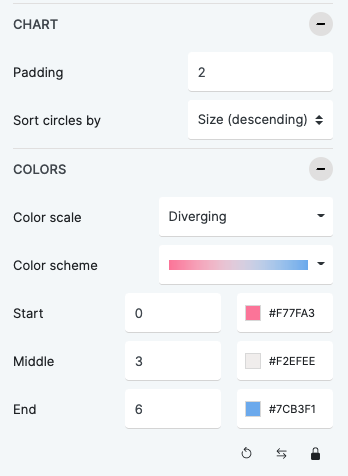

You may see something like this:
(the same cluster you find on the co-occurrence network, you can also detect with a circle packing)
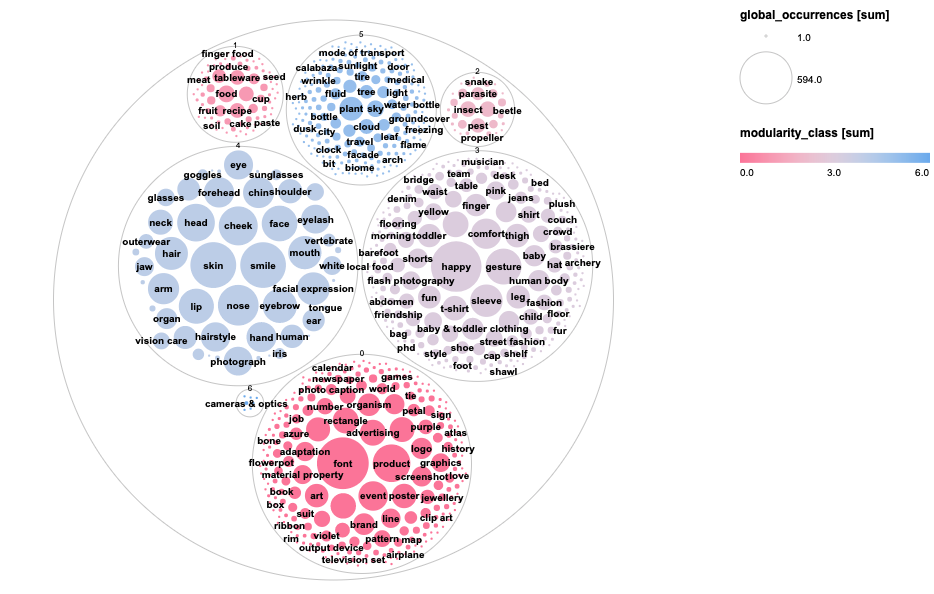
If using Memespector scripts by Rieder or Mintz, to get rid of GV labels and/or web entities scores, follow the proposed steps: (Regex expressions by Fábio Gouveia)
> Open the .csv file in a text editor (e.g. BBEdit)
> In Find & Replace opt for matching: Case sensitive, Grep, Show matches then use the Regex:
Find: ‘ \([0-9.]*\)(;|,)’
Replace: \1
> Click replace all
> Save the file (save as)

(get rid of none node)
Web entities overtime
(using Google Vision’s “web entities”)
>>Use your own dataset or the following spreadsheet:
GoogleImages_deepfakes_WebEntities-overtime
>>Folder containing the files of the following step-by-step proposal:
https://drive.google.com/drive/folders/1ic5hXksB6sFAfpwCyockfKPu9yfuxjfE?usp=sharing
Using RankFlow to visualise web entities overtime (with different collections of images) Memespector GUI output>spreadsheet>Table2Net> Gephi>Spreadsheet>RankFlow
> Option 1: use different image collections, one for each year (or time period), using Memespector GUI just once. This is the case of the shared spreadsheet.
> Option 2: use the same image collection, using memespector in different periods of time to follow the evolution of web entities over time.
Memespector GUI output>Spreadsheet>Table2Net>Gephi>Spreadsheet>RankFlow
>> Visualising the correlations of web entities used to describe the images suggested by Google Image Search when searching for deepfake(s)
>> Follow all the steps previously proposed to build networks of web entities co-occurrence.
> Create a workspace for each network.
> In Gephi Data Laboratory, click on Occurrences Count to place the nodes with the highest occurrences on the top, then select the number of rows you want to visualise e.g. top 40 or top 100 web entities. (click on shift and keeping pressing it while you select the rows)
> Copy (cmd+c) the selected rows to a spreadsheet (cmd+v).
> In the spreadsheet, organise the final results as the figure below demonstrates:
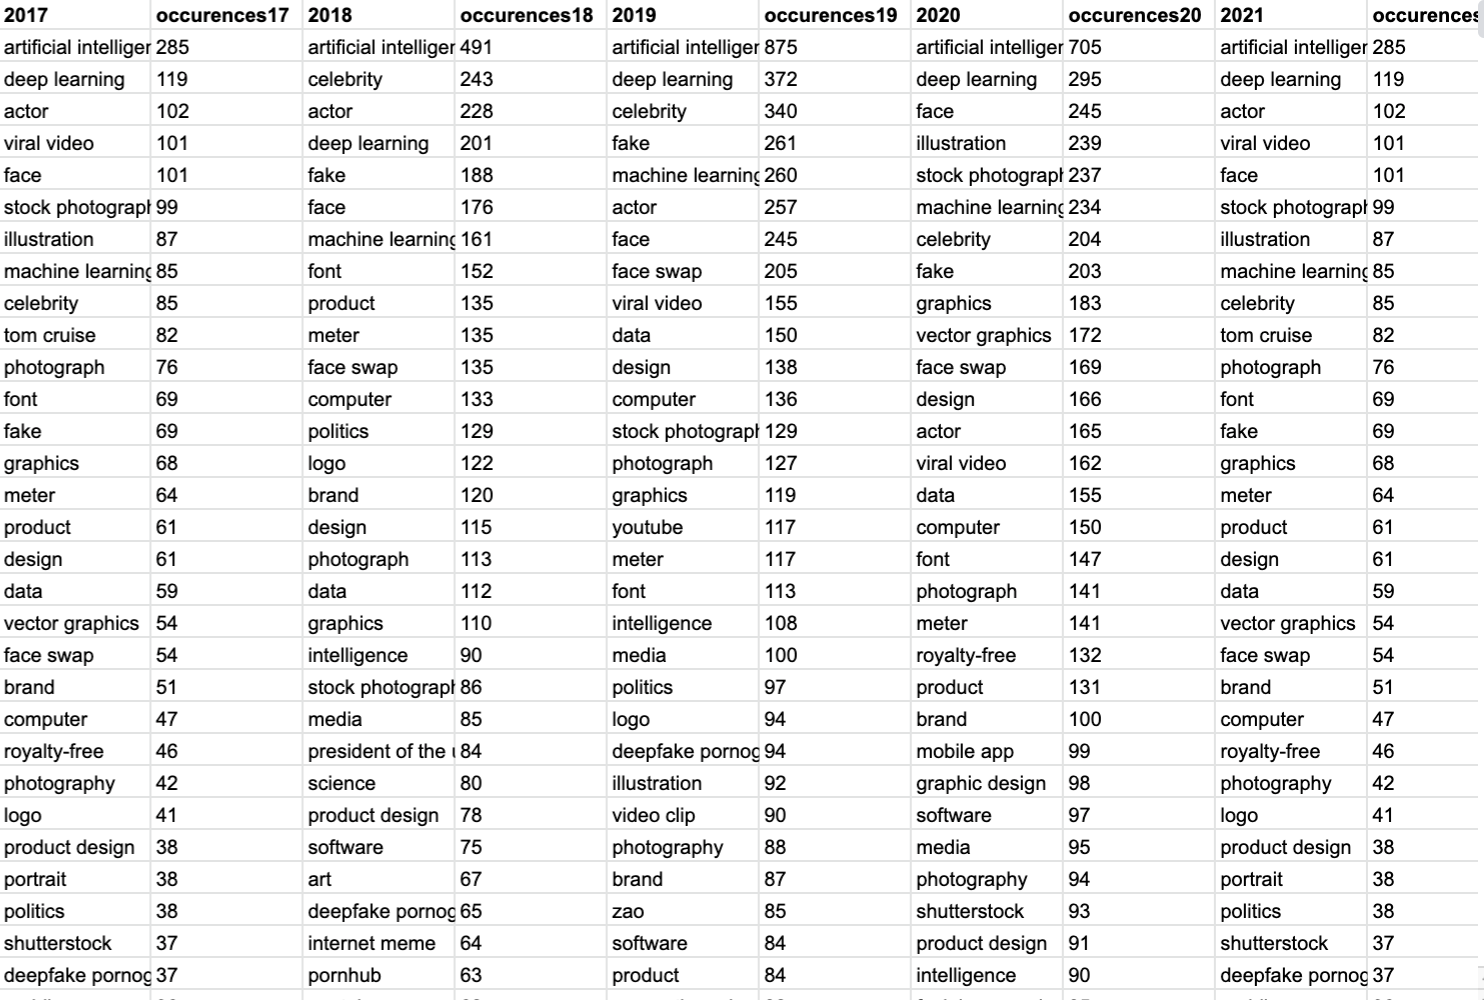
> Copy the info from the spreadsheet to RankFlow, generate visualisation. The chosen parameters may vary according to your choices, but you may see something like that:
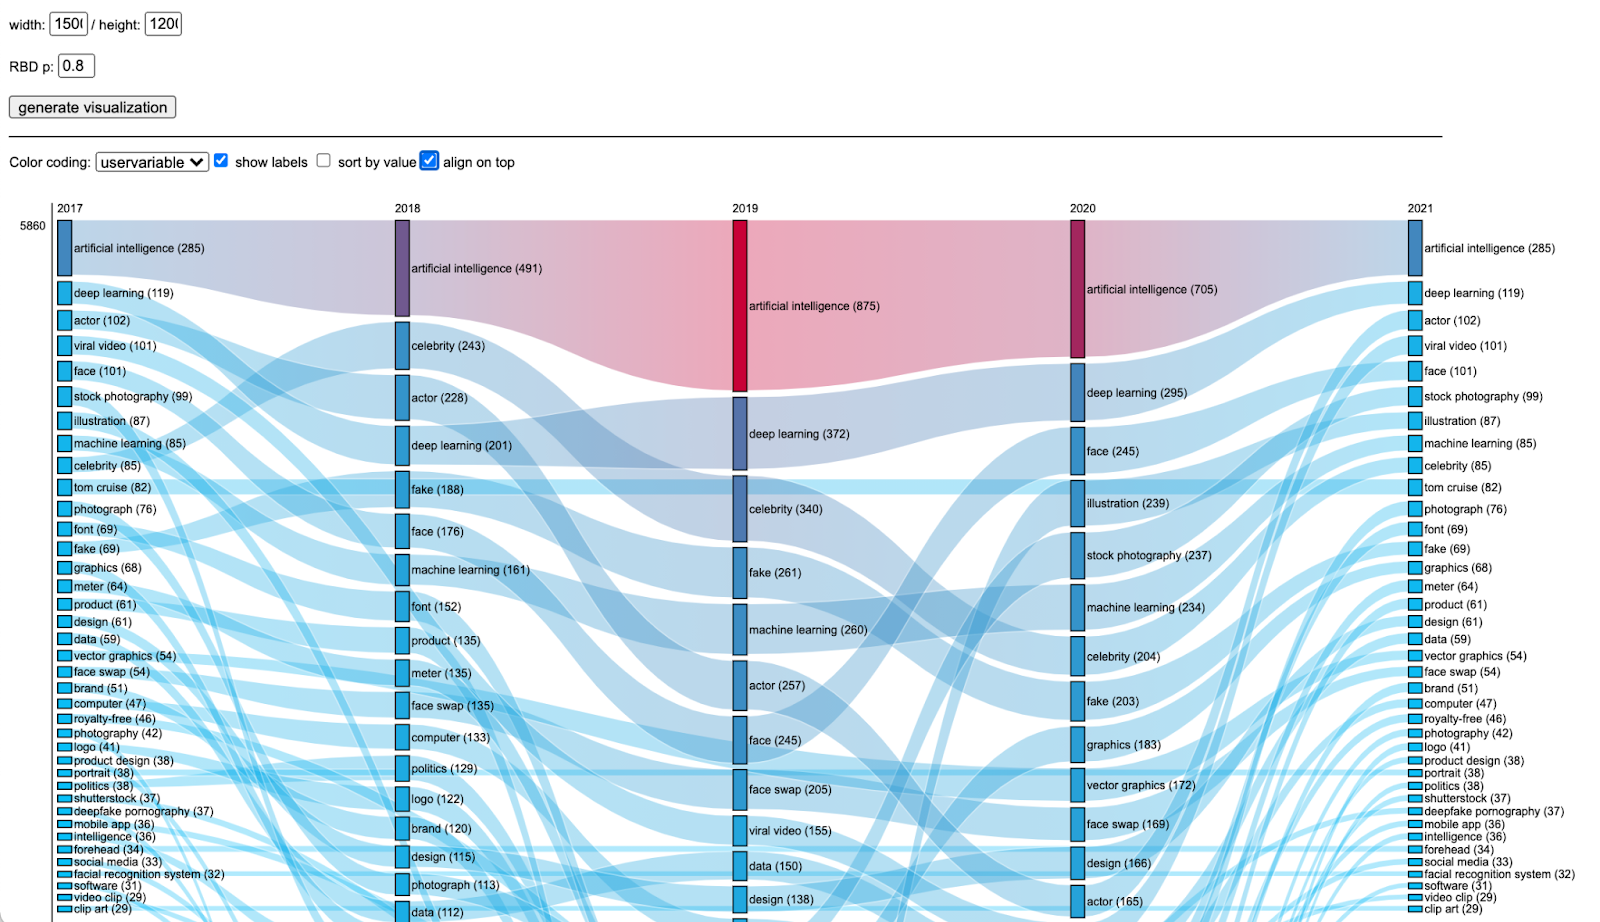
Image circulation with Google Vision
Use your own dataset or the following spreadsheet:
dmi21-memespector-recipes(sheet: image-circulation)
- Choose one of the following columns:
GV_Web_FullMatchingImages
(a list of URLs where fully matched images are found)
GV_Web_PagesWithFullMatchingImages
(a list of webpages where fully matched images are found)
Detecting dominant link domains in which images are found
Memespector GUI output>Google spreadsheets>Domain Name Extraction>Table2Net>Gephi>RawGraphs>Tree map
To extract the top domain level from images URLs or webpages, follow the steps below or 📺 watch the video From spreadsheets to networks (1): working with Google Cloud Vision API results.
> Open the csv file on a Google spreadsheet and create a column next to the column GV_Web_FullMatchingImages or GV_Web_PagesWithFullMatchingImages.
> Name the new column as top-level-domains
> Filter the rows that do not contain blank spaces, and copy and paste the URLs in Domain Name Extraction (Chao, 2021). (when using this tool, the copy and paste operations should be from Google Spreadsheet to Domain Name Extractor and back)
(optional)
> If your image id column does end with ‘.jpg’, use a formula to add this information to it, e.g.: =B2&".jpg"
(image id before: CD7W8uEp5c_ and image id after: CD7W8uEp5c_.jpg)
Analyse the results with RawGraphs 2.0, detecting the sites of image circulation
>> Treemap: visualising the occurrences of domains
> With the outputs of Domain Name Extraction (you have now two columns: Image-BaseName and top-level-domains), download Google spreadsheet as CSV file
> Upload the file on Table2Net:
Type of Network: bipartite
First type of node: image name file
Second type of node: top-level-domain
One expression per cell: semi-colon separated “;”
> > Build and download the network (GEXF file). Open the GEXF on Gephi
> Go to Gephi Data Laboratory and Export table
> Open the exported file on Excel, for example, and filter the column type by top-level-domains
> Copy and paste the table on RawGraphs 2.0
> Opt for the Treemap chart, and the chart variables as defined below:
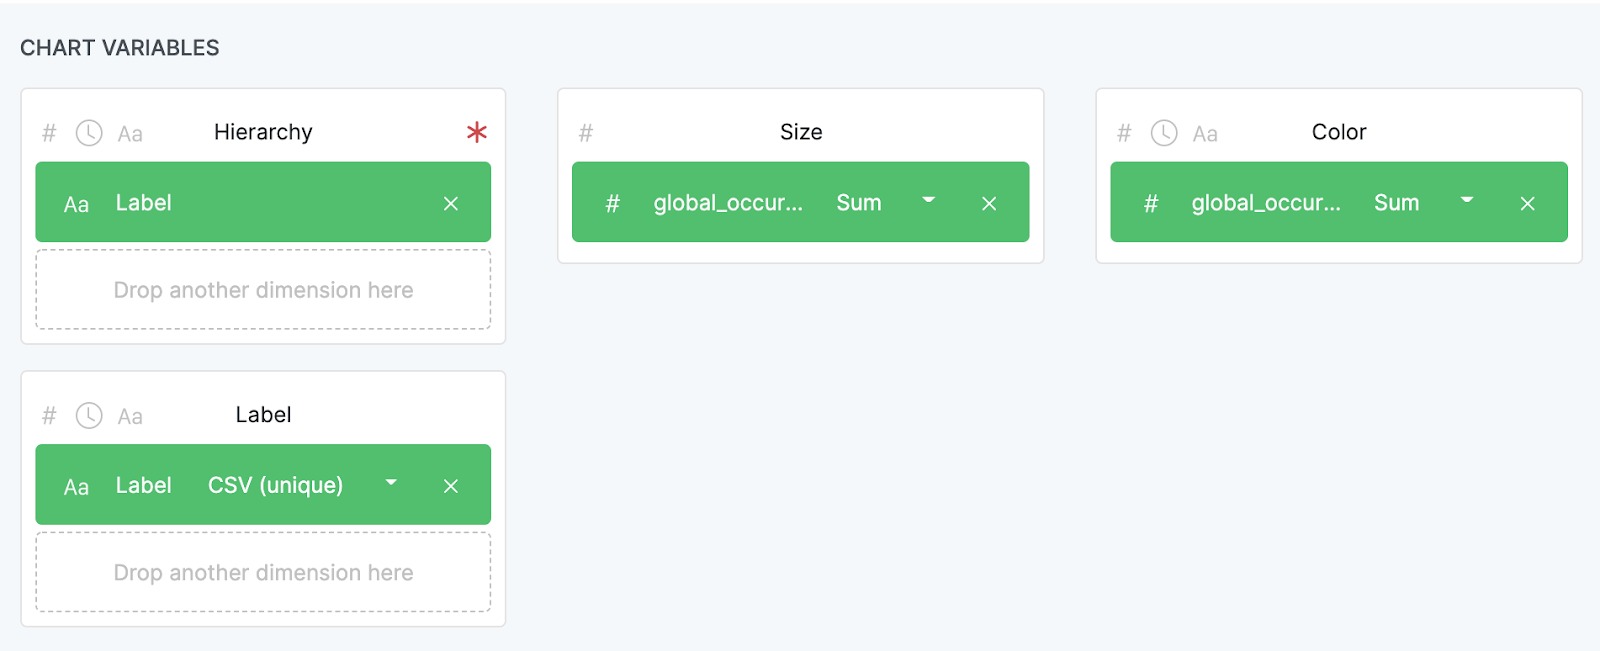
> Customize the chart as you wish
> If you used this dataset: dmi21-memespector-recipes(sheet: image-circulation), you may see some like the visualisation below
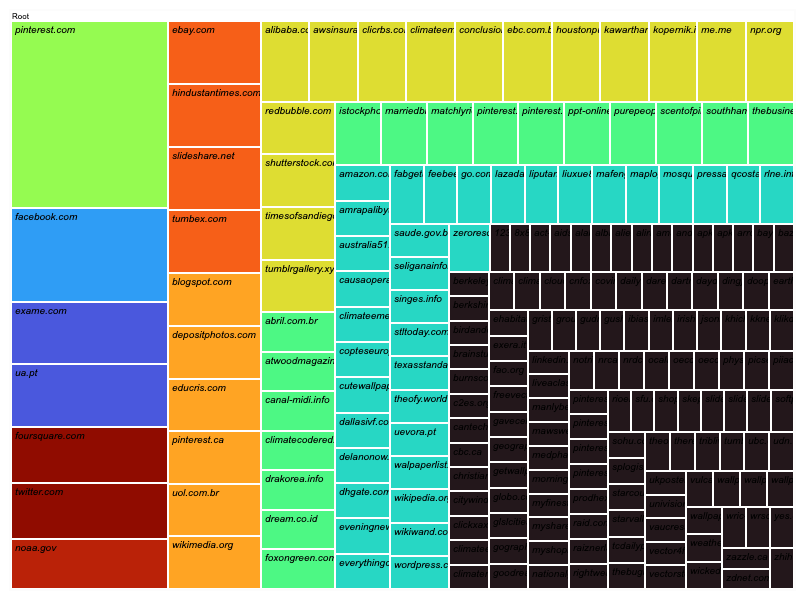
⚙️👩🏻🎨 Network Building & Visualising
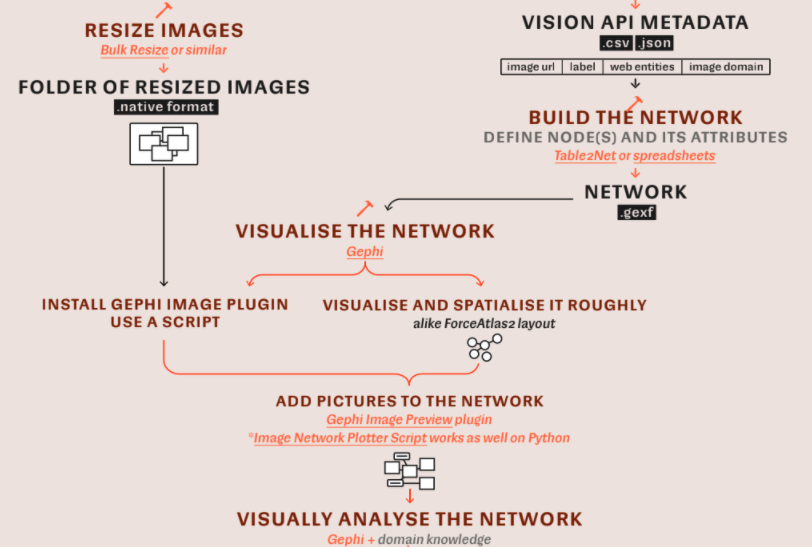
⏮ What precedes network building?
- To consider the research questions in relation to image metadata and computer vision features/outputs, considering technological grammar.
- To consider the creation of node attributes by eliciting technical imagination in data exploratory analysis while accounting for the research questions.
▶️ What can define network content?
- The image dataset and where the images come from.
- The outputs of the computer vision API.
- Researcher’s decision when creating/associating new nodes attributes.
- Graph layout algorithm logic of work (e.g. ForceAtlas2)
⏺ List of useful videos
- From spreadsheets to networks
- From spreadsheets to networks(1): working with Google Cloud Vision API results
- From spreadsheets to networks (2): working with Google Cloud Vision API results & Table2Net
- From spreadsheets to networks(3): creating a network of image circulation
- Network visualisation & exploration
- Visualising computer vision networks (1): network spatialisation with ForceAtlas2 & more
- Visualising computer vision networks (2): from spreadsheets to node as images with ImagePreview
- Visualising & exploring the network (1): node colour as year
- Visualising & exploring the network(2):node colour as years, node as images, highlighting neighbours
- Exploring a computer vision network with Gephi overview, the image network and the web environment.
- Tutorial: Analysing Images by content similarity with computer vision (CLARIFAI) | #SMARTDataSprint 2021 by Antonella Autori, Andrea Elena Febras Medina and Matteo Benetti.
▶️ 👩🏻💻 General STEP-BY-STEP
- From spreadsheets to networks: Memespector output file (CSV)>Table2Net> Gephi Data Laboratory.
- Install ImagePreview Gephi plugin!
- In Gephi Data laboratory create an image column!
- Visualise and explore the network using different techniques and always getting advantage of Gephi data laboratory, the spreadsheet, web environment and image folder.
- Cluster analysis.
- Ego networks.
- By saving different pdf files to visually explore the network.
Networks of image description
The proposed outputs serve the analysis of two types of networks:
Image-label networks: image descriptions from its material content using Google Vision’s “label” or Microsoft Azure’s “tags” or Clarifai’s “concepts” or ImageNet’s “label”. Nodes are images and labels. Connections mean the occurrence of labels in relation to images.
Image-web entities networks: image description from web content using Google Vision’s “web entities”. Connections mean the occurrence of web-entities in relation to images.
These networks have two types of nodes (bipartite graphs): one being always the image, whereas the other stands for the vision API chosen feature.
Install Gephi Image Preview plugin
Close and reopen Gephi.
Use your own dataset or the following spreadsheet and folder of images:
dmi21-memespector-recipes(sheet: image-label)
https://drive.google.com/drive/folders/1g3kW378QAw9hiupUAFVHNWN3_PosZbaY?usp=sharing (folder of images)
Memespector GUI output(CSV file)>Table2Net>Gephi>PDFfile
Follow all the steps previously proposed. Here the work starts with the GEXF file provided by Table2Net.
To create a bipartite graph depicting images and their literal or contextual descriptions: Follow the steps below and/or 📺 watch the video From spreadsheets to networks (2): working with Google Cloud Vision API results & Table2Net
> With CSV file provided by Memespector GUI and use Table2Net
> After uploading the CSV file on Table2Net: set the first type of node as image and the second type of node as a computer vision feature, e.g. Google Vision’s “label” or “web entities”, Microsoft Azure’s “tags”, Clarifai’s “concepts” or ImageNet’s “label”. In this latter, choose: one expression per cell - semicolon separate.
> If needed, create node attributes to the image, e.g. engagement metrics, file extension, post link, account name, year.
> Use node attributes to both nodes (or only the image nodes?) , e.g. the computer vision api feature, image/post link, account name, label (to facilitate the analyses)
> Build and download the network (GEXF file).
> Rename the .gexf file according to your project (don´t forget to indicate what and which type of computer vision are you´re working with, e.g. climateEmergency-GVnet-labels.gexf
> Open the .gexf file on Gephi, opt for mixed graph type.
> In the Gephi Data laboratory, create a new column named as image, then copy data from label column to image column.
In the image column select the computer vision feature (e.g. labels, web entities), right-click to edit all nodes. Clean the cell related to the image column. By doing this, you are making your dataset ready to use the ImagePreview Gephi Plugin.
In the label column select all images (e.g. 2008--001.jpg), right-click to edit all nodes. Clean the cell related to the label column. By doing this, you will visualise the images, avoiding the overlapping of image name (e.g. 2008--001.jpg) and the image itself.
> To shape and make the network ready for exploration use ForceAtlas2 (or another force-directed algorithm), node colour or size depending on your research questions or objectives.
> Run ForceAtlas2.
> Use metrics such as modularity or degree centrality.
> Adjust node size, make sure nodes are not overlapping.
> When working with a large network, use Filter>Topology>drag and drop Giant Component on Queries>Filter
> Active Image Preview plug-in, informing the image path, e.g. /Users/jannajoceli/Documents/25topics
> Export the final network as a pdf file.
> Optional videos:
📺watch the video visualising & exploring the network (1): node colour as year
📺watch the video visualising & exploring the network(2):node colour as years, node as images, highlighting neighbours
You may see something like this:
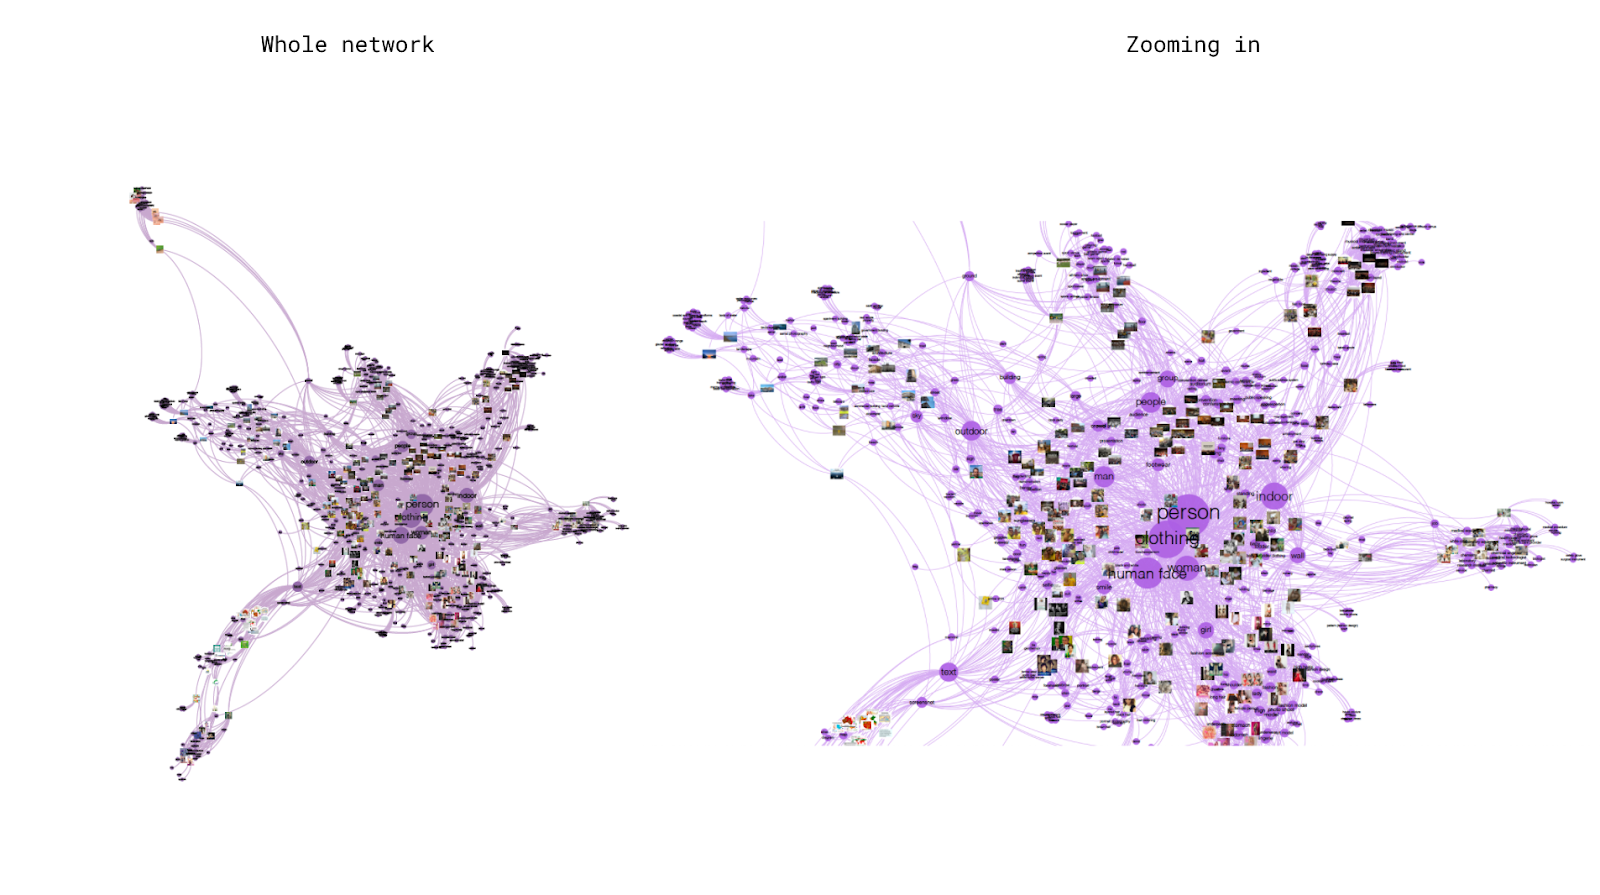
Networks of image circulation
Google spreadsheets>Domain Name Extraction>Table2Net>Gephi>PDFfile
Follow all the steps previously proposed. Here the work starts with the GEXF file provided by Table2Net.
Use your own dataset or the following spreadsheet and folder of images:
dmi21-memespector-recipes(sheet: image-circulation)
https://drive.google.com/drive/folders/1g3kW378QAw9hiupUAFVHNWN3_PosZbaY?usp=sharing (folder of images)

To extract the top domain level from images URLs or webpages, follow the steps below or 📺 watch the video From spreadsheets to networks (1): working with Google Cloud Vision API results.
> Open the csv file on a Google spreadsheet and create a column next to the column GV_Web_FullMatchingImages or GV_Web_PagesWithFullMatchingImages.
> Name the new column as top-level-domains
> Filter the rows that do not contain blank spaces, and copy and paste the URLs in Domain Name Extraction (Chao, 2021). (when using this tool, the copy and paste operations should be from Google Spreadsheet to Domain Name Extractor and back)
(optional)
> If your image id column does end with ‘.jpg’, use a formula to add this information to it, e.g.: =B2&".jpg"
(image id before: CD7W8uEp5c_ and image id after: CD7W8uEp5c_.jpg)

To visualise a network of image circulation by Google Vision API: Follow the steps below and/or 📺 watch the video From spreadsheets to networks: creating a network of image circulation (3)
> Install Gephi Image Preview plugin
> Close and reopen Gephi.
> Open the .gexf file on Gephi, opt for mixed graph type.
> In the Gephi Data laboratory, create a new column named as image, then copy data from label column to image column.
In the image column select the computer vision feature, right-click to edit all nodes. Clean the cell related to the image column. By doing this, you are making your dataset ready to use the ImagePreview Gephi Plugin.
In the label column select all images, right-click to edit all nodes. Clean the cell related to the label column. By doing this, you will visualise the images, avoiding the overlapping of image name and the image itself.
> To shape and make the network ready for exploration use ForceAtlas2 (or another force-directed algorithm), node colour or size depending on your research questions or objectives.
> Run ForceAtlas2.
> Use metrics such as modularity or degree centrality.
> Adjust node size, make sure nodes are not overlapping.
> When working with a large network, use Filter>Topology>drag and drop Giant Component on Queries>Filter
> Active Image Preview plug-in, informing the image path, e.g. /Users/jannajoceli/Documents/25topics
> Export the final network as a pdf file.
> Optional videos:
📺watch the video visualising & exploring the network (1): node colour as year
📺watch the video visualising & exploring the network(2):node colour as years, node as images, highlighting neighbours
You may see something like this:
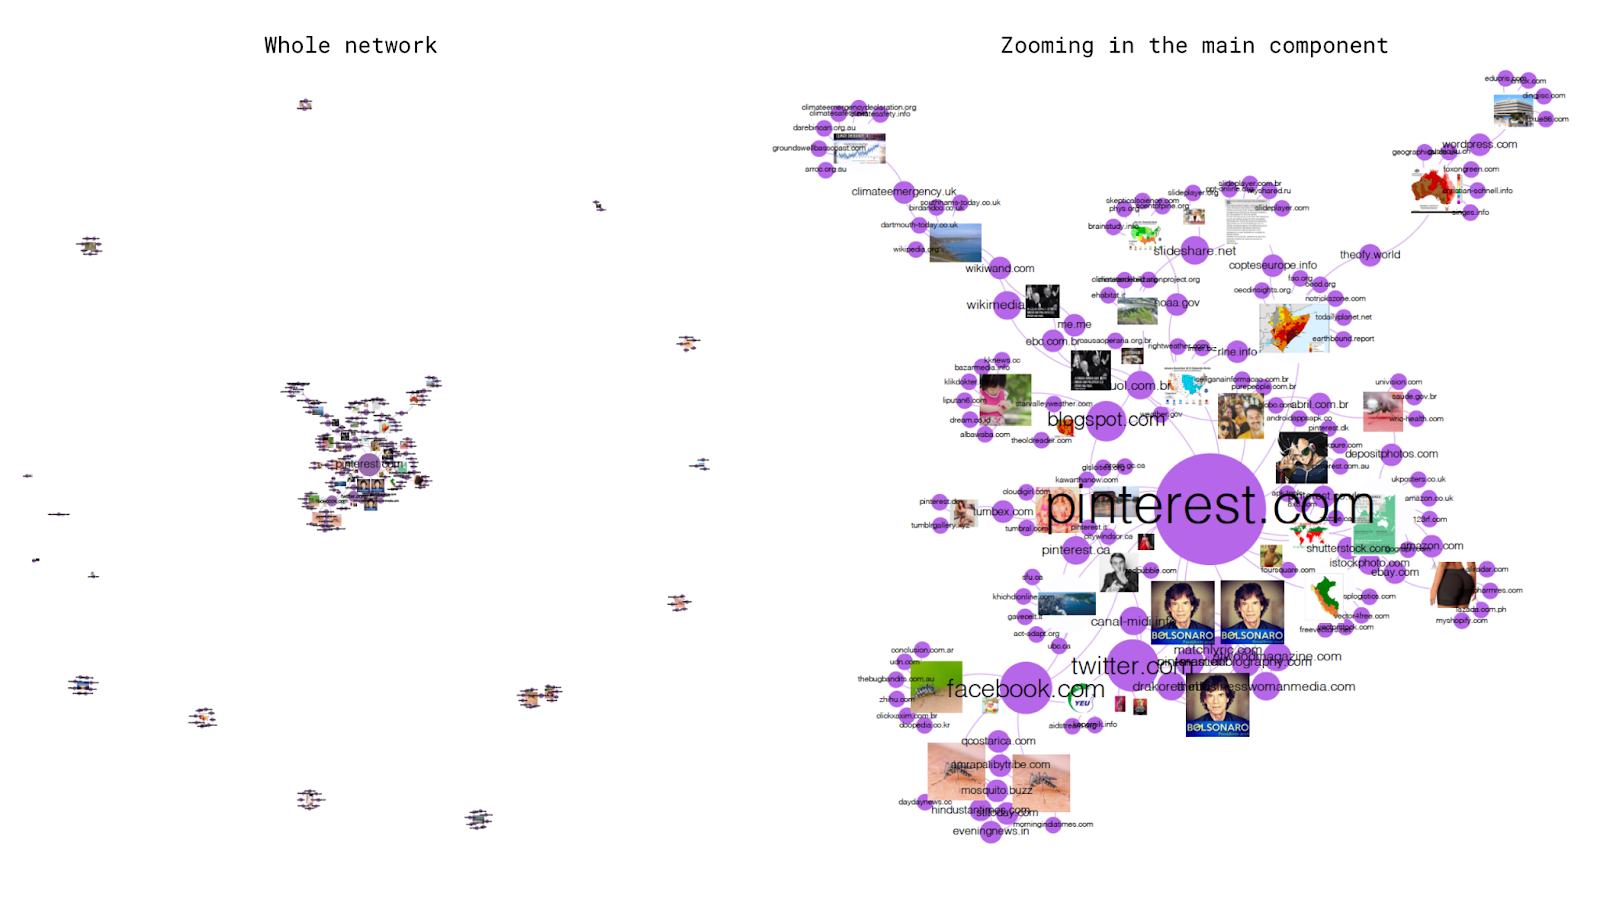
Networks of cross vision APIs outputs
We will build a simple bipartite network to compare the different labels used by Google Vision, Microsoft Azure, Clarifai and ImageNet machine learning models to classify images.
(see analysing cross-vision APIs with networks, ongoing project in collaboration with chao@jasontc.net)
Use your own dataset or the following spreadsheet and folder of images:
dmi21-memespector-recipes(sheet: comparing-labels)
Memespector output file>Spreadsheet>Table2Net>Gephi>PDFfile
To create a bipartite graph depicting different computer vision APIs and correlated labels: Follow the steps below:
> Open the CSV file provided by Memespector GUI, create a new sheet and name the first column as computer vision apis, and the second column as labels.
> In the first column inform the computer vision API, in the second column paste its outputs. The spreadsheet should be organised as the example below:
> Save as a CSV file and use Table2Net:
Type of Network: bipartite
First type of node: computer vision APIs
Second type of node: labels
One expression per cell: semi-colon separated “;”
> Build and download the network (GEXF file).
> Open the .gexf file on Gephi.
> To shape and make the network ready for exploration use ForceAtlas2 (or other force-directed algorithm), node colour or size depend on your research questions or objectives. (If using dmi21-memespector-recipes, sheet comparing-labels, see the suggested parameters below)

You may see something like this:
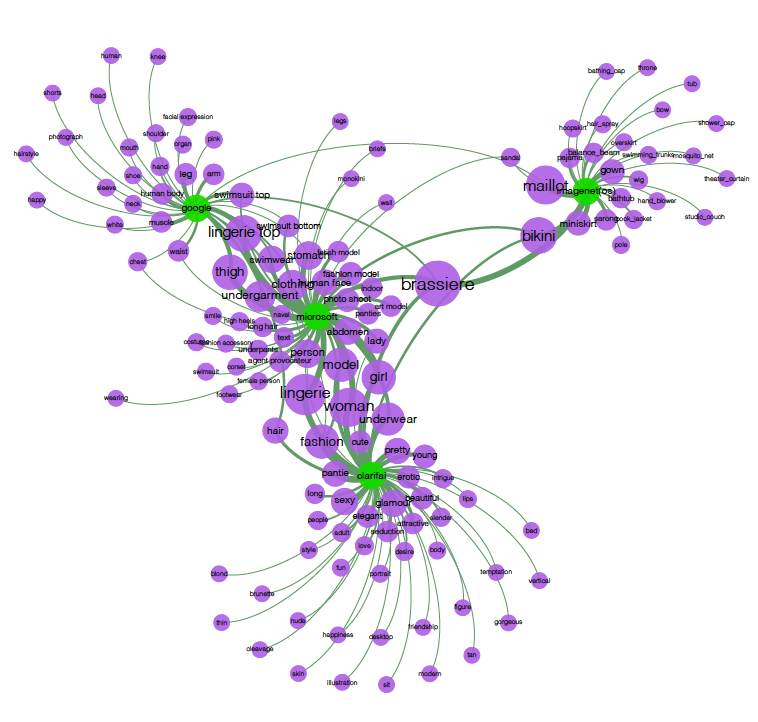
Networks of computer vision feature (first node type) and platform grammatisation or topic modelling (second node type)
Proposed methodology in collaboration with Giulia Tucci in the context of 2020 DMI Summer School.
> Recipe: Creating Bipartite Networks using Computer Vision features and Twitter data
> Folder: https://drive.google.com/drive/folders/1TdYufYX6GJXjZWtAB1KbYJgZtqrIp4Ep
Twitter data related to 459 geolocated images: https://docs.google.com/spreadsheets/d/1pi-QmM8n_tfVUfWxJKPJqj1YdE5kxpsLG25AhbLH1Fc/edit?usp=sharing
Folder containing 459 geolocated images: https://drive.google.com/drive/folders/1NGKJIkD7CFIeXkexVU9HVPZfxmmn8soC?usp=sharing
Data extracted from Google Vision API: https://docs.google.com/spreadsheets/d/17EI7nfDKcVgKeSELqMKeA7zZ-L189yIa1tWHjTIf6og/edit?usp=sharing
Flags repository: https://hampusborgos.github.io/country-flags/
Nodes as computer vision feature and Twitter geolocation (countries)
- Step-by-step available here: https://docs.google.com/document/d/1ARW-SrxdOdWitbbCnWHld1IfvnIA2ihqWhCEKMfh-qA/edit?usp=sharing
- Project references:
- Methodology: https://wiki.digitalmethods.net/Dmi/WinterSchool2021Deepfakes#A_4.3.3._Geographical_mapping_40Twitter_data_38_web_entities_41
- Findings: https://wiki.digitalmethods.net/Dmi/WinterSchool2021Deepfakes#A_5.3.3._Geographical_mapping:_Twitter_hashtags_and_Google_Vision_web_entities
Using an image circulation network to further explorer insights taken from topic modelling networks
Proposed methodology in collaboration with Francisco W. Kerche.
Methodology (topic modelling): https://wiki.digitalmethods.net/Dmi/WinterSchool2021Deepfakes#A_5.3.3._Geographical_mapping:_Twitter_hashtags_and_Google_Vision_web_entities
Findings (Bipartite network of topics and profile images): https://wiki.digitalmethods.net/Dmi/SummerSchool2021BolsobotsNetworks#A_5.2._Issue_alignments_38_Behaviours
❣ Software references
Please go to https://bit.ly/research-software-sheet. In this software sheet you find all references and extra info about the list of research software and tools used in this section 🤓💪🏻

⚙️👩🏻🏫 Reading computer vision networks
⏺ List of useful videos
- Talks:
- How to read cross-platforms digital networks? (2019) https://www.youtube.com/watch?v=DpiU4IoQgyI
- Analytic applications of network visualization by Mathieu Jacomy
- Reading digital networks I Practical Lab I SMART Data Sprint 2021 https://www.youtube.com/watch?v=XPR-Kpsf9hg
- Computer vision networks I CAIS Colloquium I 2021 https://www.youtube.com/watch?v=F6XNW0FOhqk&list=PLuAgGxzD7fdzrSr5zrD77wD2HC8nJOVk5&index=2
- Gephi tutorials:
- Layouts, clusters, and where to find them by Mathieu Jacomy
- Filtering Labels in Gephi - Data Pitman Answers by Fábio Gouveia
- How to increase the size of the exported graph in Gephi - Data Pitman Answers by Fábio Gouveia
- How are they funded? Exploring ad architecture of anti vaxxers with Gephi and DMI Tracker Tracker by Mathieu Jacomy and Jonathan Gray
💭Possible visualisations [folder]
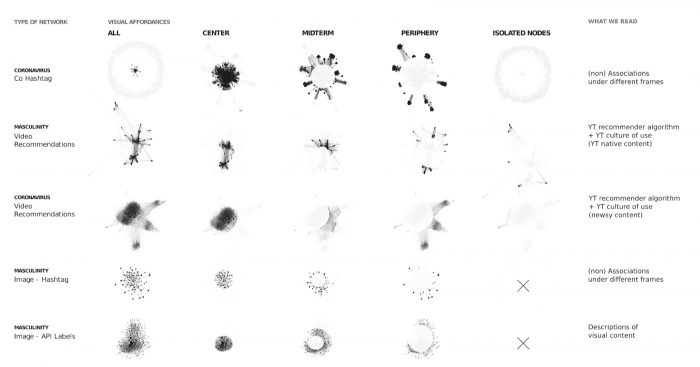
Reading networks. Image source: https://smart.inovamedialab.org/2020-digital-methods/project-reports/cross-platform-digital-networks/
⏮ What precedes the interpretation of the network?
Researcher/student is aware of the possible lines of enquiry:
- The possible lines of enquiry
- That the technique for visually analysing the network should account for knowledge about where the images come from, platform grammatisation and the technicity-of-the-mediums.
Researcher/student reads:
- The context and the content of the network, including technical features, software content and practices, networked content, the nature of computer vision and, in the case of Google’s web detection, the hierarchical infrastructure of the Web.
Researcher/student knows that the network itself reflects:
- A second order of grammatization that results not only from methodology or the affordances and limitations of digital records-software-technological grammar, but from various technical layers and the researcher/student's own intervention, decisions, and analytical choices.
Types of network | ||||
Understand | Image Description | Image Circulation | Cross-Vision AI (image classification) | Web Entities-platform grammar |
What we see | → Visual vernacular associated with where the images come from → IMG collection associated with platform metadata & mechanisms | |||
→ Visual AI outputs for image classification or Google’s web entities (based on its ranking systems & Knowledge Graph) | → Sites where fully matched images are found (Google’s lens) | → The outputs of different machine learning models to classify the same image collection | → Google’s web entities and image metadata, e.g. geolocation | |
Network spatialisation (Force-directed algorithms, ForceAtlas2) | → The position of images reflects their literal or contextual descriptions → Image clusters indicate similar visualities | → Node position is driven by the sites of image appearance → Node position can indicate: Central and ordinary actors images that stick and flow out of a platform Cluster of actors sharing the same image image Cluster of actors sharing particular images | → Node position indicates exclusive and shares labels cross-vision APIs | → Node position indicates image contextual description according to chosen platform grammar |
→ What is in the images? → What is the image context or associated representations? → What are the dominant and ordinary image clusters? → What can ego networks say/signify/reveal? (using key web entities) | → What are the sites of image circulation? → Who are the central actors? → What visualities stick and flow? → What visualities are shared or exclusive? → What can the images in the periphery (or isolated) reveal? | → What are the exclusive and shared visual topics (labels)? → How about the precision in image classification or lack of it? | → How can the interpretation of image content through web entities be useful? → What are the advantages and disadvantages of this approach? | |
How to read | → Technical features and networked content | |||
→ Close reading image clusters → Combine image clusters categories w/ image metadata (timestamp or year, likes, usernames, etc.) → Use ego networks for image-web entities networks | → Close reading the centre of the network and its isolated and/or peripheral zones | |||
→ Visually identify and analyse: Core actors and their neighbours Stick and flow dynamics Clusters of links domains sharing the same images | → Close reading bridging clusters | → Explore the network! → Experiment with ego networks. | ||
What to narrate | → Dominant and ordinary visual topics → Visual particularities and related issues → Web-based contextual descriptions | → The sites of image circulation and to whom images (don´t) matter → Web hierarchies and societal concerns | → Machine learning potentials and limitations for image classification → How commercial APIs structure image classification | → Let's figure it out together! ;p |
Some examples of what we read
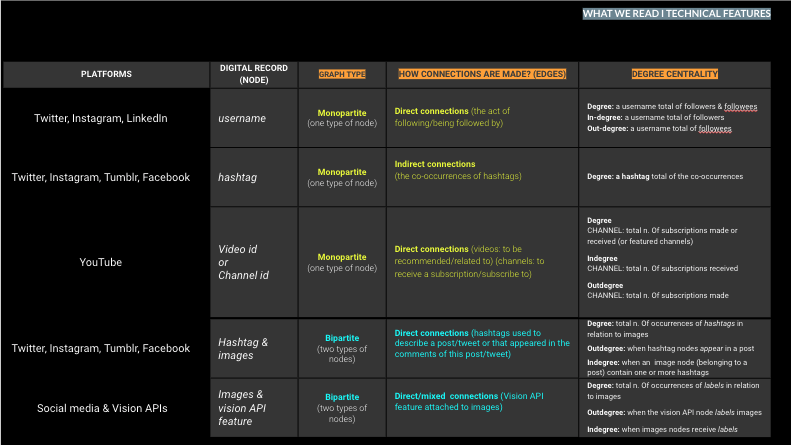
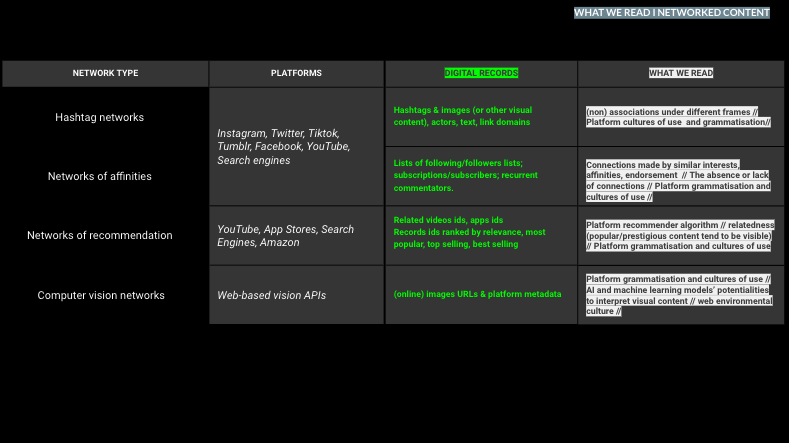
🖥🕸️📝Network Vision Analysis
The story to be told
Image classification: labels and web entities
These networks include Vision API efforts to classify images according to machine vision algorithms and the Web environments, such as labels, best guess labels, web entities. This approach would allow an analytical glance at literal and web-contextualised descriptions.
- When building the network, researchers have previously considered:
- Platform grammatisation and technicity-of-the-mediums
- Software affordances
- Engagement metrics (questions about audience)
- The site of image itself
- The circulation of the images
- When reading the network, researchers should consider the context and content of the networks. They understand
- Where do the images come from
- That the network has two types of nodes; one being
- A whole overview of the network and what particular zones or path can tell, e.g. looking at clusters of images or labels, and keywords considering topical or underspeciefied and specified words.
- Delete the most common labels? E.g. Internet meme and meme when using web entities
Image circulation: web page and image host detection
These networks GV Vision API efforts to classify images according to machine vision algorithms and the Web environments, such as labels, best guess labels, web entities.
- What researchers should consider:
A whole overview of the network and what particular zones or path can tell, e.g. looking at clusters of images or domains and keywords considering topical or underspecified and specified words; following the path of clusters of images.
- It is crucial to interrogate what you see as big nodes, because it not only reflects the outputs of the vision api but also the layered structure of the Web // hierarchical infrastructure and how Google reacts, use and appropriate of that.
Images over time: how to explore and analyse time-based datasets?
→ How to visualise image content? (1. rankflow with most common labels and less common, and unique type of classification per year; one column for each year) (or use the percentile)
(2. Selecting labels according to keywords: specified and underspecified: ego nets over time, use Radar chart)
→ How to visualise the domains and hosts in which images have appeared? (rankflow and Radar chart according to web hierarchy: top layer, second and third)
Case studies: climate emergency, tumblr nipples, universidades
Mapping AI taxonomies:
❣ References
List of research software: https://bit.ly/research-software-sheet
[to be updated]
Bastian, M., Heymann, S., & Jacomy, M. (2009). Gephi: An Open Source Software for Exploring and Manipulating Networks. Third International AAAI Conference on Weblogs and Social Media.
Chao, T. H. J., (2021). Memespector-GUI: A cross-platform GUI Client for Google Vision API. Source code and releases available at https://github.com/jason-chao/memespector-GUI/
Chao, T. H. J., (2020). AppTraffic: A scalable research tool for studying the network traffic of mobile applications. Source code available at https://github.com/jason-chao/apptraffic/
Chao, J. (2021). Domain Extractor. Available at https://colab.research.google.com/drive/1NE35PpE05U2TngM5P1wdNI3i-TCqm89-?usp=sharing
Colombo, G. (2018). The design of composite images: Displaying digital visual content for social research.
D’Andréa, C., & Mintz, A. (2019). Studying the live cross-platform circulation of images with computer vision API: An experiment based on a sports media event. International Journal of Communication, 13, 1825–1845.
Geboers, M. A., & Van De Wiele, C. T. (2020). Machine Vision and Social Media Images: Why Hashtags Matter. Social Media and Society, 6(2). https://doi.org/10.1177/2056305120928485
Niederer, S., & Colombo, G. (2019). Visual Methodologies for Networked Images: Designing Visualizations for Collaborative Research, Cross-platform Analysis, and Public Participation. Diseña, 14, 40–67. https://doi.org/10.7764/disena.14.40-67
Omena, J. J. (n.d.). Digital Methods and technicity-of-the-mediums. From regimes of functioning to digital research. Universidade NOVA de Lisboa.
Omena, J. J., & Granado, A. (2020). Call into the platform! Revista ICONO14 Revista Científica de Comunicación y Tecnologías Emergentes, 18(1), 89–122. https://doi.org/10.7195/ri14.v18i1.1436
Omena, J. J., Rabello, E. T., & Mintz, A. G. (2020). Digital Methods for Hashtag Engagement Research. Social Media + Society, (July-September), 1–18. https://doi.org/10.1177/2056305120940697
Pearce, W., Özkula, M., Greene, A., Teeling, L., Bansard J., Omena JJ. & Rabello, E. (2018). Visual Cross-Platform Analysis: Digital Methods to Research Social Media Images. Information, Communication & Society, 23(2),161-180, https://doi.org/10.1080/1369118X.2018.1486871
Rose, G. (2016). Visual Methodologies (4th Edition). UK: Open University.
Ricci, D., Colombo, G., Meunier, A., & Brilli, A. (2017). Designing Digital Methods to monitor and inform Urban Policy. Retrieved from https://hal.archives-ouvertes.fr/hal-01903809
Silva, T., Barciela, P. & Meirelles, P. (2018). Mapeando Imagens de Desinformação e Fake News Político-Eleitorais com Inteligência Artificial. 3o CONEC: Congresso Nacional de Estudos Comunicacionais Da PUC Minas Poços de Caldas - Convergência e Monitoramento, 413–427, 2018. Retrieved from https://www.researchgate.net/publication/329525177_Mapeando_Imagens_de_Desinformacao_e_Fake_News_Politico-Eleitorais_com_Inteligencia_Artificial
Silva, T. Mintz, A., Omena, J.J., Gobo, B. Oliveira, T., Takamitsu, H.T., Pilipets, E., Azhar, H. (2020) APIs de Visão Computacional: Investigando Mediações Algorítmicas A Partir De Estudo de Bancos de Imagens. Logos: Comunicação e Universidade 27(1): 25-54. DOI: https://doi.org/10.12957/logos.2020.51523
Danowski, J. A. (2013). WORDij version 3.0: Semantic network analysis software. Chicago: University of Illinois at Chicago.
Gephi Consortium. (2017). Gephi (0.9.2) [Computer software]. https://gephi.org/
Graf, A., Koch-Kramer, A., Lindqvist, L., Peeters, S., & Dāvis. (2019). Instaloader (4.2.8) [Computer software]. https://instaloader.github.io/
Google Cloud (2017). Pricing (https://cloud.google.com/vision/docs/pricing: 17 April 2017), archived at Wayback Machine, https://web.archive.org/web/20170413081619/https://cloud.google.com/vision/docs/pricing
Li et al. 2017. Knowledge-based entity detection and disambiguation
Jacomy, M., Venturini, T., Heymann, S., & Bastian, M. (2014). ForceAtlas2, a continuous graph layout algorithm for handy network visualization designed for the Gephi software. PLoS ONE, 9(6). https://doi.org/10.1371/journal.pone.0098679
Jünger, Jakob / Keyling, Till (2019). Facepager. An application for automated data retrieval on the web. Source code and releases available at https://github.com/strohne/Facepager/.
Maier, N. (2019). DownThemAll (Version 4.1) (software). Available at https://www.downthemall.org/
Mintz, A. (2018a). Image Network Plotter. https://github.com/amintz/image-network-plotter
Smith, M., Ceni A., Milic-Frayling, N., Shneiderman, B., Mendes Rodrigues, E., Leskovec, J., Dunne, C., (2010). NodeXL: a free and open network overview, discovery and exploration add-in for Excel 2007/2010/2013/2016, from the Social Media Research Foundation, https://www.smrfoundation.org
Steinbock, Daniel. Tagcrowd. Available at https://tagcrowd.com/
Visual Computing. (2018). ImageSorter. Visual Computing Group at the HTW Berlin. Retrieved from https://visual-computing.com/
Rieder, B., Den Tex, E., & Mintz, A. (2018). Memespector. https://github.com/bernorieder/memespector
D’Andréa, C., & Mintz, A. (2019). Studying the live cross-platform circulation of images with computer vision API: An experiment based on a sports media event. International Journal of Communication, 13, 1825–1845.
Geboers, M. A., & Van De Wiele, C. T. (2020). Machine Vision and Social Media Images: Why Hashtags Matter. Social Media and Society, 6(2). https://doi.org/10.1177/2056305120928485
Ricci, D., Colombo, G., Meunier, A., & Brilli, A. (2017). Designing Digital Methods to monitor and inform Urban Policy. Retrieved from https://hal.archives-ouvertes.fr/hal-01903809
Rogers, R. (2013) Digital Methods. Cambridge, MA: MIT Press.
Rogers, R. (2019). Doing digital methods. London: Sage.
Rose, G. (2016). Visual Methodologies (4th Edition). UK: Open University.
Robinson, S. (2017). Exploring the Cloud Vision API. The Medium. Retrieved from https://medium.com/@srobtweets/exploring-the-cloud-vision-api-1af9bcf080b8#:~:text=What%20is%20the%20Vision%20API,used%20to%20power%20Google%20Photos.
Silva, T., Barciela, P. & Meirelles, P. (2018). Mapeando Imagens de Desinformação e Fake News Político-Eleitorais com Inteligência Artificial. 3o CONEC: Congresso Nacional de Estudos Comunicacionais Da PUC Minas Poços de Caldas - Convergência e Monitoramento, 413–427, 2018. Retrieved from https://www.researchgate.net/publication/329525177_Mapeando_Imagens_de_Desinformacao_e_Fake_News_Politico-Eleitorais_com_Inteligencia_Artificial
Sullivan, D. (2020). Google’s Knowledge Graph and Knowledge Panels. Blog.Google. https://blog.google/products/search/about-knowledge-graph-and-knowledge-panels/
Appendice
Forcing bots into action Instagram bots following net visible 388.665 rows 281 visible bot accounts (detect by purchasing) Table2Net → NODE ATTRIBUTE 1 (visible_bots) info about the query: visible botted accounts Error: no_error388588 Can't access private account list63 Broken link or page has been removed9 Profile follows no one5 → NODE ATTRIBUTE 2 (following_username) info about following accounts is_private Private87091 Public301574 is_verified Not-verified373279 Verified15386 Followed by viewer Followed By Viewer1158 Not-followed-by-viewer387507 | Entering bots agency situations Instagram bots following net invisible 189.629 rows 461 invisible (hidden) bots Table2Net → NODE ATTRIBUTE 1 (hidden_bots) info about the query: invisible botted accounts Error everything-ok189465 Can't access private account list122 Profile follows no one26 Broken link or page has been removed16 → NODE ATTRIBUTE 2 (username) info about following accounts is_private Private46577 Public143052 is_verified Not-verified172470 Verified17159 Followed by viewer Followed By Viewer89 Not-followed-by-viewer189540 |
Instagram bots follower net visible | Instagram bots follower net invisible |
[1] For instance, when researchers download the .gdf or .gexf files afforded by YouTube Data Tools (Rieder, 2015) or 4CAT (Peeters & Hagen, 2018) that feed network visualisation software like Gephi (Bastian, Heymann, & Jacomy, 2009).