Analytics for People
Practical Google Analytics and best practices for analyzing and storytelling with data
By Nico Brooks
2021-3-1 revision
Copyright 2021 Two Octobers, LLC
Table of Contents
Tracking Interactions Other Than Page Views
2. An Introduction to Google Analytics
Terminology and Functionality in Google Analytics
Using Audience Reports To Do a Persona Analysis in GA
Audience: Answering Questions with Data
6. Conversions & Multi-channel Funnels
Multi-channel Funnel Reporting
Conversions: Answering Questions with Data
Tutorial: What Are My Top Audiences?
Tutorial: How Are My Marketing Channels Contributing to Revenue?
Analytics Tutorial: Content Deep Dive
8. Analysis Versus Observation
Segments, Secondary Dimensions, and Custom Reports
Going Past the First Layer of Data
The Ingredients: People and Tools
Introduction
I have been implementing, using and teaching Google Analytics since before it was officially born. This document evolved out of lecture notes and presentations I do in the course of my work as an affiliate professor at the Daniels College of Business, leading the analytics practice at Two Octobers, and as an organizer of the Denver Marketing Analytics Meetup.
When I teach, I always try to impart practical information, but I also try to get to the “why” behind things. In the case of digital analytics, the obvious “why” is the seductive notion that we can gather and analyze comprehensive data about people and their behavior online. That certainly compels me. There is ridiculous power in Google Analytics, which I hope to help you unleash.
There are also cautionary tales throughout what follows. Seeing a neat table of data, with carefully named and thoroughly documented column headers is persuasive. We want to believe that metrics such as New Users and Conversion Rate are what they say they are. The truth, however, is nuanced. I encourage you, here and always, to think critically. There is a fair amount of how-to information here, but most of all this is about how to be a good analyst. That is something people can do and machines can’t.
The Google Analytics demo account
If you have access to a Google Analytics account, you are encouraged to use it to follow the examples given here. If you don’t, you can use the Google Analytics demo account. The demo account is a GA property configured on a real, live website: https://shop.googlemerchandisestore.com/ . To access the demo account, go here:
https://support.google.com/analytics/answer/6367342?hl=en#access
1. How Web Tracking Works
We’re going to start with the mechanics of web tracking, which is important background and context for tracking and reporting on website visitor behavior in Google Analytics. Note that GA can also track mobile app behavior, but we are not going to discuss the specifics of that here.
What Happens When You Open a Web Page in a Browser?
When you visit a web page in a browser, the first thing that happens is that your browser makes a request for the page to a web server. The request includes the full URL of the page you are requesting, as well as your address and various other bits of information. The web server then sends a response, which includes the HTML source code of the web page you requested. The source code of the webpage includes HTML tags containing additional requests for resources that need to be retrieved in order to render the web page. These resources can include images, video files, JavaScript files, style sheets (CSS files), HTML files, and tracking tags. The additional resources do not need to come from the same web server as the web page you requested.
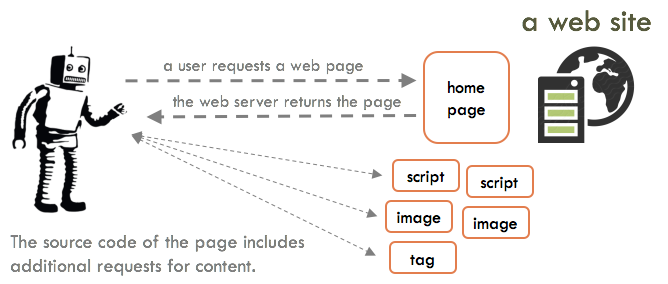
Put another way, the web “page” you see in your browser is not a page at all, it is a collection of files that combine to create what you see in front of you.
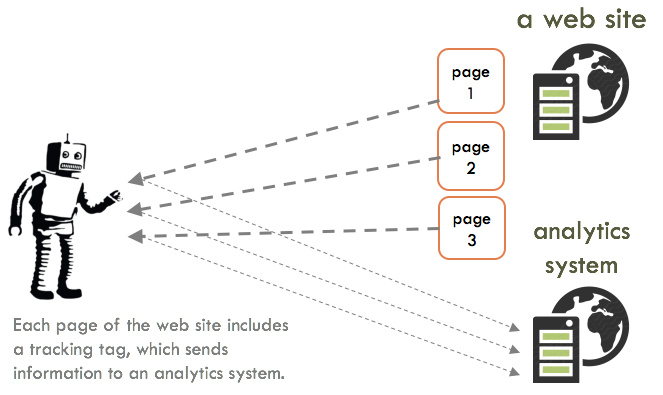
Tracking Tags
If the website uses Google Analytics or some other form of web tracking, tracking tags are one of the things included in the source code of the page, and they create a record of your visit. As you browse the site, tracking tags continue to fire, sending additional bits of information to Google Analytics with each tracked interaction. This information includes, but is not limited to:
- A user identifier
- The Google Analytics ID of the site
- Your IP address
- Your browser type and version (which also indicates whether you are on a mobile device)
- The page you requested
- The previous page you visited, if you clicked on a link to get to the page.
Every HTTP request also includes a variety of other fields, detailed here: https://en.wikipedia.org/wiki/List_of_HTTP_header_fields .
The tracking tag itself can be an HTML anchor tag or JavaScript. Whichever it is, it typically contains a request for a 1x1 transparent image file. The information described above piggybacks onto the request. Nowadays, JavaScript tags are most common. The tag itself often looks innocuous, but it may include a file reference that returns a lot of additional JavaScript.
Most tracking systems use a cookie to keep track of who you are between page views and visits.
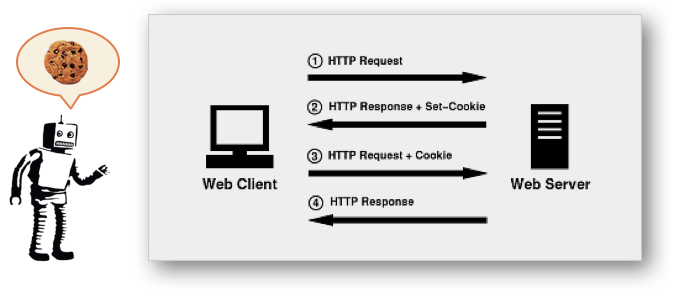
Cookies
A cookie is a small text file stored in your browser cache by a web server (mostly analogous to a website). When you make a request of the same web server, the cookie is included with the request. There is a common misconception that cookies can expose your private information to malicious websites. This is not true. The information in a cookie is only available to the site that set the cookie. In other words, if you visit xyz.com, xyz.com only gets to see cookies set by xyz.com.
Tracking tags often set their own cookies. So, for example, if you visit xyz.com, you might get an xyz.com cookie and a facebook.com cookie that gets set by a Facebook tracking tag. The Google Analytics tag sets cookies, but it sets them to the website’s domain.
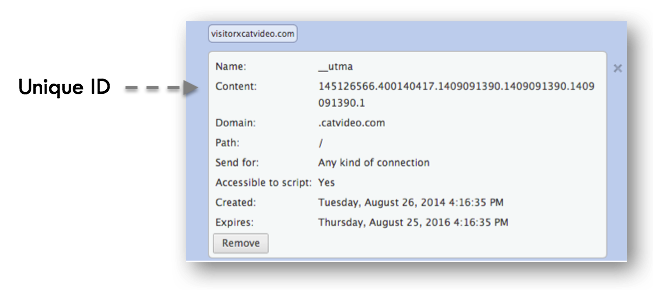
Most of the time, a cookie is used to associate a visitor with a user account or a set of preferences. For example, if you visit amazon.com, Amazon identifies you with a cookie and presents personalized content. In this case, the cookie stores a unique identifier, but no personal information. Web developers do sometimes store personal information in cookies, but this is considered bad practice. Major players such as Google and Facebook never store personal information in cookies.
Below is an example of the contents of an actual cookie.
Domains, Sub-domains
The domain name in the URL of a web page you request is the part that comes before a slash or question mark. It acts as a pointer to a domain name server, which maps the domain name to an IP address. Store.xyz.com and www.xyz.com are two different domain names. “store” and “www” in this case are referred to as third-level domains or sub-domains, because they are the third part of the domain name. A cookie is set to a domain. It can be set to the second level or below.
If a cookie is set to xyz.com, both www.xyz.com and store.xyz.com will receive the cookie when the user makes a request, since both are part of xyz.com. This matters for GA tracking, because GA will set a user-identifier cookie on the second-level domain by default[1]. As long as the user stays within xyz.com, he/she is tracked as a single user. If he/she jumps to another domain, xyz.shopify.com, for example, GA will create a new user session unless configuration changes are made in the Google Analytics tag to link the two domains. These configuration changes are referred to as cross-domain tracking.
IP Addresses
An IP (internet protocol) address is a group of numbers or numbers and letters that specify a location on the Internet. Anything that travels over the internet, such as a web page request or a sent email, gets routed to an IP address. Most of the time, an IP address can also be linked to a physical location, though often the location can only be known generally.
An example of an IP address: 73.243.52.93
Type “what is my IP address” in Google to see your IP address.
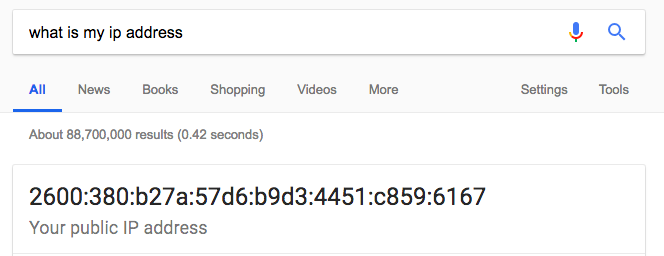
This example looks a lot different than the previous example. This is because there are two IP address systems currently in use. The second example uses the newer protocol, IPv6, which allows for a lot more addresses on the Internet.
If you are connecting through a business, ISP or mobile carrier, your IP address is assigned dynamically, and cannot be traced back to you. In other words, web sites can’t know who you are just from your IP address. They may, however, know where you work, and they definitely know what ISP or mobile carrier you use.
Paths and Querystrings
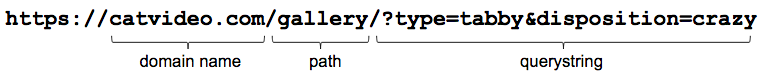
In addition to a domain name, a URL includes a path and a querystring.
The path is the portion of the URL that comes after the domain name, and is ostensibly the path to a document on the web server. Technically, the path doesn’t always point to a different document, but the idea is that the path points to a unique page of content, however it is served.
The querystring (AKA query parameters or URL parameters) is the set of parameters that come after the question mark in the URL. It passes variables to a web page/application. It is formed as name/value pairs.
In the example below, there are two querystring parameters: type, and disposition. This example might describe a scenario where a user has selected the filters “tabby” and “crazy” when viewing cat videos on the gallery page of catvideo.com. Don’t get too excited, this is just an example and not a real site.
The querystring is an important component of tracking, because most tracking systems have the ability to collect specific querystring parameters, if included. Google Analytics, for example, supports several parameters that can be used to track the source of traffic, called UTM parameters. We’ll cover these in more detail later, but in summary you can add UTM parameters to the URL you assign to an ad you create to identify visitors that click on that ad and visit your website.
Tracking Interactions Other Than Page Views
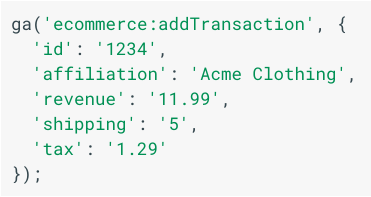
Tracking interactions other than page views is possible, but usually requires a bit more customization of the tag, and sometimes a bit of custom JavaScript. Below is an example of code that needs to be added to a Google Analytics tag to report on ecommerce transactions. Values such as order ID and revenue are obviously going to be different for each transaction, so a web developer needs to set these up. Popular ecommerce platforms typically have built-in support for GA ecommerce tracking, so it may be as simple as enabling a feature, but it often requires the help of someone who knows JavaScript or PHP, depending on the website platform.
Other page interactions can be tracked as well, such as form submits or video views. In each case, it is a matter of getting the tag to fire when the interaction happens, and customizing the tag to provide information about the interaction.
There are tag management tools that make tag configuration and customization much easier, and may eliminate the need to write custom code. Google Tag Manager is free, and streamlines the process of setting up GA and other tags.
What This Means for Marketers
What has been described so far are the mechanics of how web analytics data is collected and sent to an analytics system such as GA. To recap, tracking tags send a series of messages about the characteristics and activity of each visitor to a website. The analytics system then aggregates the data into various data structures for reporting on a variety of dimensions and metrics. A dimension is a characteristic of a visitor or group of visitors, and a metric is a statistic that describes something about the behavior of a visitor or group of visitors.
Because a visitor is usually identified by means of a cookie, which is associated with a browser and a website, the visitor will appear as two people if he or she switches browsers or devices. This highlights a critical limitation of web analytics systems. According to the Internet Advertising Bureau, 78% of internet users browse with both mobile and desktop devices[2], and device usage is getting ever more fragmented with personal assistants, tablets & etc. Some analytics systems have capabilities to track people across devices, but none are completely effective. This means you have a limited view of how individual visitors behave on your website over time, which is a significant drawback when it comes to analyzing marketing data.
Things that can be tracked | Things that can’t be tracked |
You can track a lot of data about individual user sessions on a website, including where people come from, where they are, and what they do on your site. You can see visitor’s behavior when they leave and come back, as long as they are using the same browser on the same device. You can track how people interact with specific content/pages on your site. You can measure how many purchases happen, or contact form submits. | You can only track what you can tag. In other words, you can’t track users when they go elsewhere on the web. You can’t track personally identifiable information (PII). You can’t reliably track people over time who visit your site using more than one browser or device. |
People in the world of digital marketing often talk as if we are getting closer to perfect knowledge of customer behavior online, but in many respects, we are actually getting farther away.
Factors that inhibit understanding of customer behavior:
- Google is trying to keep users on Google.com by showing more information directly on the search results page. About half of Google searches don’t result in a click to another website[3]. Facebook is also discouraging clicks away from Facebook.
- Amazon is almost completely opaque when it comes to user behavior.
- Browsing behavior is spread across more and more devices, making it harder to track.
- Increased focus and regulation regarding privacy is making it harder for user behavior to be stored and shared from one site or service to another.
- People are using ad blocking tools and browsers are adding features allowing users to prevent themselves from being tracked.
- Fraudulent and/or bot traffic pollutes the user data we can collect.
If we reconcile ourselves to the fact that we have at best partial knowledge of users over time, we can still use GA to form a more accurate picture, even if it is a bit blurry in places. This brings to mind the inimitable words of Donald Rumsfeld:
“There are known knowns. These are things we know that we know. There are known unknowns. That is to say, there are things that we know we don't know. But there are also unknown unknowns. There are things we don't know we don't know.”
In the world of Google Analytics, the known knowns are things like what pages get viewed, and how many people complete a lead form. Known unknowns include the “whys” behind visitor behavior, and personal characteristics of visitors. Unknown unknowns are by definition unknowable, but certainly include nearly everything a website visitor does before and after a visit.
2. An Introduction to Google Analytics
Terminology and Functionality in Google Analytics
Goals
Goals measure actions that visitors complete when they are on a website. There are no built-in goals. Goals need to be configured for each GA view. Goal conversions can be triggered by specific page views, events, pages per visit, or session durations. Goal conversion are available for display as a metric in most GA reports.
When identifying goals:
- Navigate the website. Note the things people can do that correlate to business value. Contact form submits, newsletter signups, and purchases are common examples.
- List what you think makes sense to track as a goal.
- Share with stakeholders to get validation and input.
Ecommerce
Ecommerce tracking is similar to goals, but is configured a bit differently. There is a view setting that needs to be enabled, and the website needs additional code to report on orders, revenue and order line items. All major ecommerce platforms have built-in GA ecommerce tracking that just needs to be switched on. If a website does not have this built in, a developer will need to do the implementation.
Events
The standard Google Analytics tag tracks page views. You can also track on-page events in GA, by adding a bit more code to the page. Events send data to GA based on what a visitor does on a page. An event can include up to four field values, which are named Category, Action, Label and Value. There are some best practices regarding how to use Event fields, but there is a lot of flexibility in how they can be used.
Events provide a window into what visitors do on a page. They also give you the ability to collect structured data. Events are triggered by something that happens on a page, usually driven by a JavaScript event.
UTM Parameters
When linking to your website in Facebook, Twitter, emails, or any other marketing channels, appending UTM parameters to the destination URL gives you the ability to specify the source, medium, campaign and other attributes that appear in GA when a person clicks on the link.
Example: twooctobers.com/?utm_source=awesome&utm_medium=sauce

You can control the source, medium and other dimensions of traffic by including those parameters in links to a site.
We’ll be talking more about UTM parameters in the Acquisition chapter.
Dimensions and Metrics
Every report in GA has a primary dimension and multiple metrics that relate to that dimension. A dimension is a unique attribute of a hit or session or user. Country (user), Source / Medium (session), and Page (hit) are examples of dimensions. A metric is a number that describes something about the dimension. Sessions, Bounce Rate, and Revenue are examples of metrics.

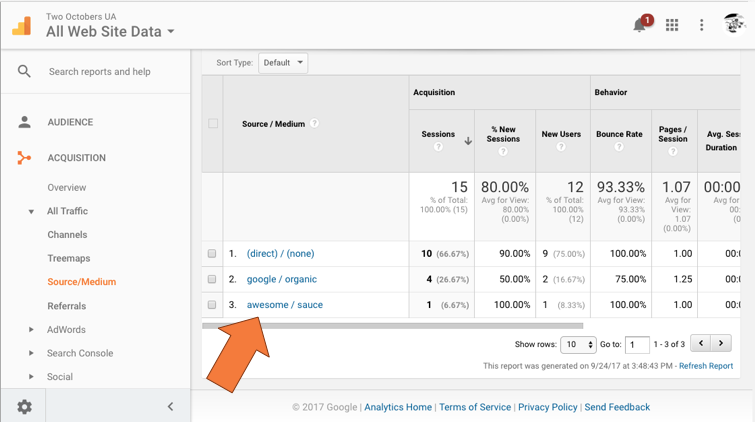
Reporting Demo
As a quick overview of reporting in GA, we will demonstrate a few features of the Acquisition > All Traffic > Source Medium report. This report shows performance summaries for traffic by source and medium. Generally speaking, source is where the traffic came from, e.g. Google or Facebook, and medium is the category of the source, e.g. search or social.
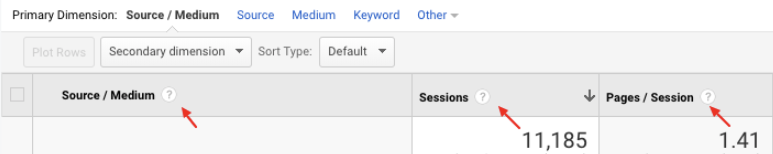
Secondary Dimensions
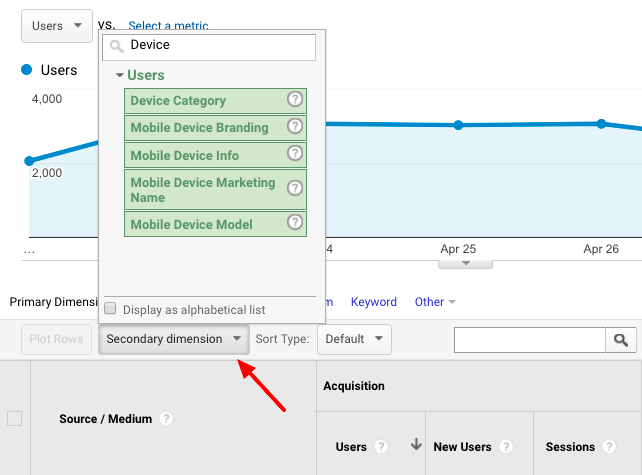
Add a secondary dimension to a report to look at traffic by device type (mobile), geography, campaign source, and a variety of other dimensions. The options for secondary dimensions change from report to report.
In the example to the right, various Device dimensions are shown. Applying Device Type would result in traffic displaying by Source / Medium and Device Type.
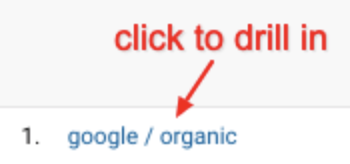
Drilling Down
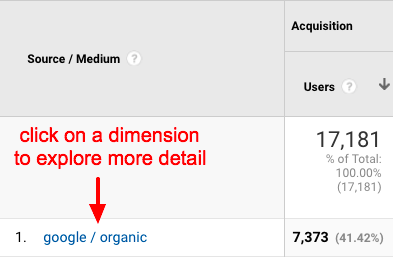
Clicking on a primary dimension value in a report takes you to a report detailing just that dimension. For example, click on ‘google / organic’ in the All Traffic report to see just organic Google traffic. From here you can add a secondary dimension to get more detail. This is a fast way to dig for details.
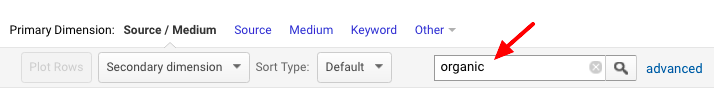
Filtering
Clicking the magnifying glass icon allows you to filter results. For example, you may want to filter to only see display traffic in the All Traffic report. Clicking the ‘advanced’ link allows you to apply multiple filters to multiple fields.
Segments
Segments provide a way to segment traffic in reports, typically so that you can compare one segment of traffic to another. For example, there are pre-built segments for mobile and tablet traffic, which you can apply to see how behavior differs between these devices. There are a number of other pre-built segments, and you can create custom segments based on any condition or combination of conditions applied to one or more dimensions.
To apply a segment:

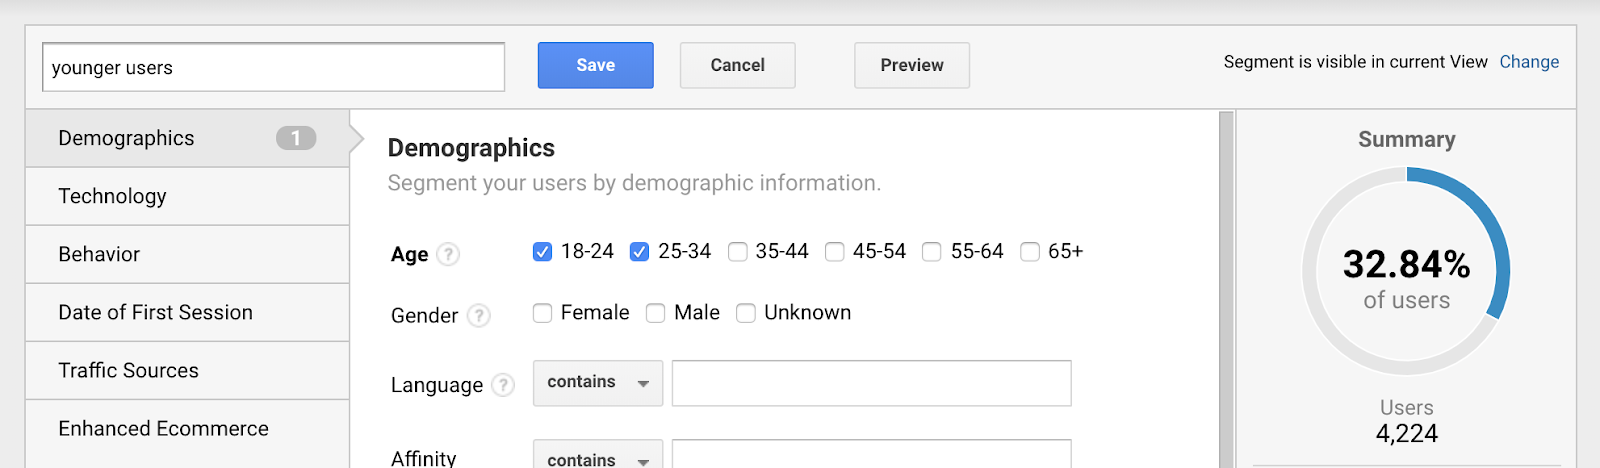
For example, if we wanted to compare user behavior by age, we could create two segments, one for users under 35, called “younger users”, and one for users 35 and older, called “older users”. One thing to note: on the right hand side you can see how many users are in your segment. If you create these two segments, you’ll find that they do not add up to 100% of users. This is because Google infers age from behavioral characteristics, and is only able to do so for a subset of visitors.
With these segments applied, we can now compare behavioral metrics. Below is the summary bar of the Acquisition > All Traffic > Source / Medium report:
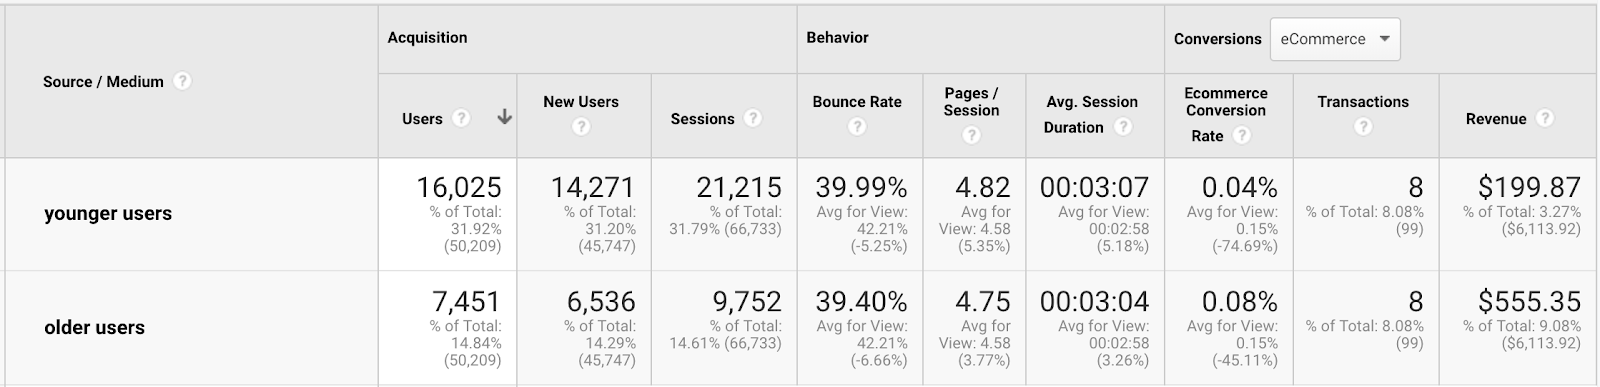
This data is for the month of July. Many of the behavioral characteristics seem similar, but there is a striking difference between conversion rates. 8 conversions is not much data, but if I increase the date range to May through July, the conversion rates stay at about the same ratio.
Downloading
Click on Export to view download options. You can export data to a spreadsheet for further analysis, or export a full report as a PDF to send to someone.

Explore!
As long as you don’t click on the gear icon, any changes you make in the reporting interface are only visible to your login. This means you can play around with filters, segments, custom reports, and other features all you want, and you won’t mess anything up. If you do click on the gear icon, you can change property or view settings (depending on your permissions), and those changes affect the data that gets collected and what other users see.

There is also contextual help all over the place. The help button in the top bar provides an explanation of the report you are looking at:

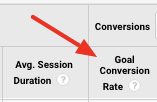
And each of the dimensions and metrics in a report has a help link with an explanation:
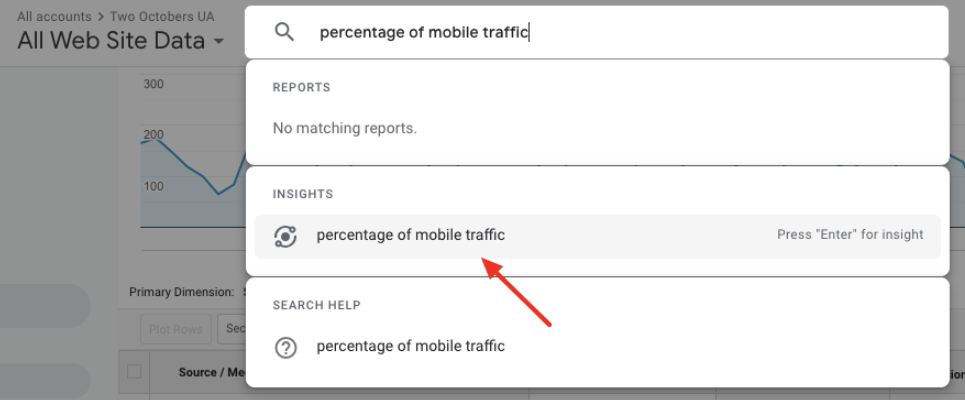
If you’re not sure where to find something, the search bar at the top can handle a variety of natural-language questions. For example, try “percentage of mobile traffic”. The INSIGHTS link will show you the overall percentage of traffic coming from mobile devices.
3. Audience
Using Audience Reports To Do a Persona Analysis in GA
The Audience reporting section of GA is focused on reports that help you understand the characteristics of a website’s audience.
We are going to walk through how to use GA to develop marketing personas, as a way to demonstrate some of the capabilities of audience reporting in GA. A persona is meant to represent a typical customer of a business. Marketers use personas to focus efforts on the actual humans they are trying to reach, and will usually create multiple personas to address different market segments. Personas are not meant to be perfect or exclusionary. Here is brief summary of personas from Gartner:
“Personas can be powerful marketing tools to inform decisions, guide strategies, improve customer experience and enhance collaboration. However, personas are only a starting point. They are most powerful when marketers support, evangelize and use them to understand customers and their journeys. “To make personas actionable, marketing leaders must follow a data-driven process and stand ready to tailor them when necessary.”
Augie Ray, research director, Gartner for Marketers.
Note that Demographics and Interest Reports need to be enabled for the demographics and interest reports to work. Do this by going to Admin > Property Settings > Advertising Features > Enable Demographics and Interests Reports.
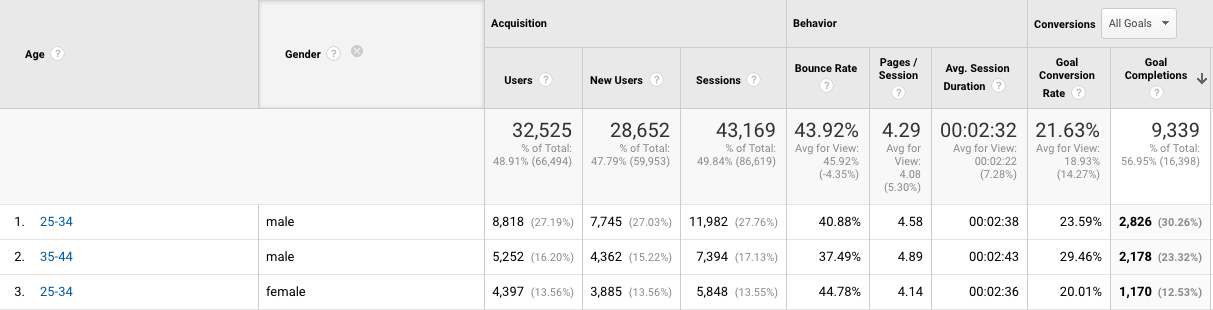
Report: Audience > Demographics > Age
- From this tab, add Gender as a Secondary dimension
- At the bottom of the report, select Show rows = 25 to show all rows
- Under Conversions, select All Goals
- Click on Goal Completions to sort descending
This report shows performance by age range and gender. What groups have the best conversion rates? Pick the top 3 and note them down.
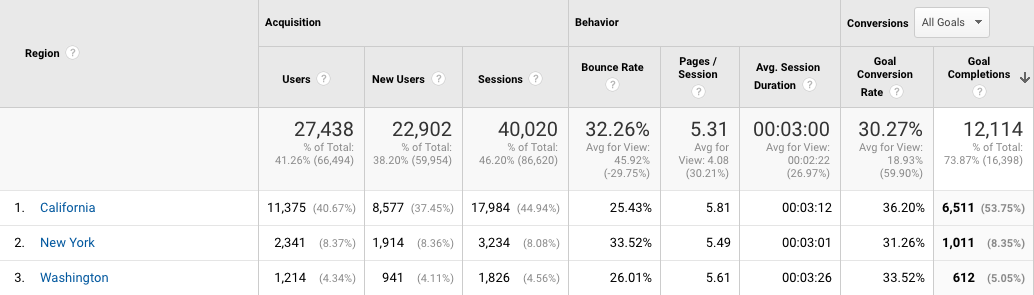
Report: Audience > Geo > Location
- Drill into the map to select the most specific geographic breakdown that makes sense. For example, if the business only sells to the US market, click on the US to display performance metrics by state.
- Under Conversions, select All Goals
- Click on Goal Completions to sort descending
This report shows performance by location. What locations have the best conversion rates? Pick the top 3 and assign one to each of the groups identified in the demographics step. Don’t worry about the fact that there may be a correlation between certain locations and demographics, you are just creating a sketch.
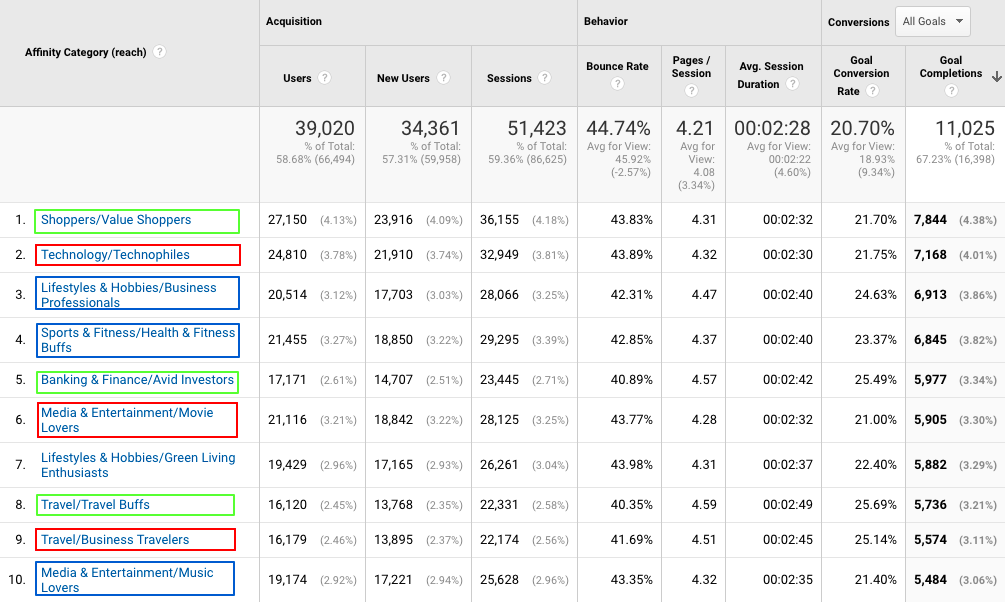
Report: Audience > Interests > Affinity Categories
- Under Conversions, select All Goals
- Click on Goal Completions to sort descending
The Affinity Categories report shows performance metrics by affinity. User affinities are obtained from behavioral data on the Google Display Network (GDN), as well as other sources. For example, if a user visits golf.com, this is a signal that the user has an affinity for golf. If there is a GDN ad placement on golf.com, Google can associate this data with the user.
Look for patterns in the top interest groups. Do they paint a picture? For example, Golf Enthusiasts and Luxury Shoppers combine to describe a certain kind of person. Take 3 sets of groupings from the top categories that seem to fit together, and assign them to your demographic/geographic groups. Feel free to make this a narrative description, and add a little flair.
After doing this, here is an example of a persona you might create:
45-54, Male, from Virginia, likes golf, gourmet cooking and cares more about luxury than price.
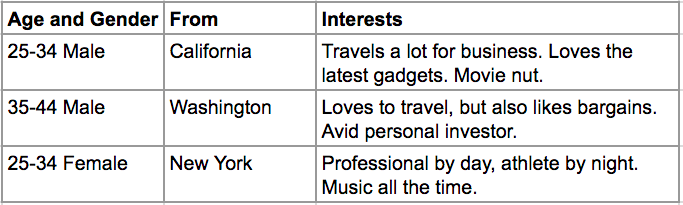
Marketers often embellish personas with names, photos, relationships, and other details to make them feel more real. Note that there is a dark side to this process: it is natural to organize your personas around dominant characteristics, which can lead to ignoring people who don’t fit these characteristics. The line between a persona and a stereotype can be thin.
Audience: Answering Questions with Data
Below are some of the business questions that audience reporting can answer.
Question: How does performance vary by gender? Age?
- Report: Audience > Demographics > Age, Gender
- Business insight: high-performing segments may represent ad-targeting opportunities. Are low-performing segments a bad fit, or is the website biased against those segments?
Question: What affinity categories generate the most conversions? Which have the highest conversion percentages?
- Report: Audience > Interests > Affinity Categories
- Business insight: these represent good ad-targeting opportunities, and may help define your target customer.
Question: Does performance vary by geography?
- Report: Audience > Acquisition > Location
- Business insight: can help optimize ad targeting, but may also require deeper investigation. What are possible reasons why one location performs better than another?
Question: how is mobile traffic trending over time?
- Report: Audience > Mobile > Devices
- Business insight: if mobile traffic is increasing, this could be an argument for investing in more content targeted at mobile visitors.
Question: how do mobile engagement metrics compare to desktop?
- Report: Audience > Mobile > Devices
- Business insight: the mobile user experience may be sub-optimal. Should be investigated.
4. Acquisition
Acquisition reporting shows how website visitors perform, based on where they are coming from. Acquisition reporting includes the following sections:
- All Traffic – reports of all traffic to the website, organized by various dimensions. Detailed referral traffic reporting also falls in this section, for some reason.
- Google Ads – if Google Ads and GA are linked, these reports tie Google Ads campaigns, ad groups, ads and keywords to detailed website behavior.
- Search Console – links Google Search Console to Analytics. Search Console is a separate Google product that webmasters and SEOs use to analyze organic search performance. Search Console data is imported, but not linked to user behavior on the website
- Social – reports on traffic from social media sites. Limited by the fact that GA can’t track users in Facebook, Instagram, Twitter, etc.
- Campaigns – reporting of marketing campaigns that are set up to track in GA. Campaign is a dimension that can be set with UTM parameters, described below.
Default Metrics
Below is an example of the Acquisition > All Traffic > Source / Medium report, showing the default metrics that show up in this and most other reports.
Following are descriptions of these metrics, but don’t forget that you can click on the question mark to the right of the metric to get a popup description.
- Users
Unique visitors to the property, as measured by the first-party cookie set by the Google Analytics tag. At this time, GA does not associate unique visitors across multiple devices or browsers, though it is possible to do this in some circumstances by configuring an optional User ID attribute when implementing the tracking code. - New Users
Users that visited a property for the first time during the selected reporting period. Because Google Analytics doesn’t track users across devices and browsers, it is hard to know what percentage of new users are actually new users, and what percent are previous visitors on a new device. - Sessions
A session is counted each time a user visits a property. If the user is idle for 30 minutes or more, then becomes active on the site again, a new session is counted. - Bounce Rate
In non-technical terms, a bounce is counted when a user visits the property, then leaves immediately. In technical terms, a bounce describes a single-interaction visit. This means that a single-page-view visit counts as a bounce, even if the visitor spends a significant amount of time on the page. A high bounce rate is generally viewed as an indication of poor traffic quality and/or page content. - Pages / Session
The average number of pages users visit during a session. A bounce counts as a one-page session. Pages / session is seen as an indication of engagement. - Avg. Session Duration
The average time from the first interaction to the last interaction for a session. A bounce counts as a zero-duration session. This metric is also used to measure engagement.
How GA Classifies Traffic
GA classifies inbound traffic to a property by source, medium and channel. Source represents where the traffic came from, medium is the type of traffic, and channel is a somewhat confusing conglomeration. GA classifies traffic automatically using the referrer field that is part of the HTTP request a browser makes when retrieving a web page. The referrer field contains the URL for the page you were on prior to visiting the page, assuming you clicked on a link to visit the page. In other words, if you are on xyz.com/this.html, and click on a link to go to abc.com/that.html, abc.com will get the referrer value of xyz.com/this.html in the HTTP request. If a visitor did not click on a link to get to a page, the referrer field is blank.
It is also possible to specify a value for source and medium using UTM parameters. More on that below.
Source
The value for source is usually the domain name of the referring page. For example, traffic coming from Facebook.com shows the source as facebook.com. In some cases, GA drops the .com (or .net, & etc.) portion of the domain name. For example, organic search traffic from Google.com just shows google as the source. If a visit does not have a referrer, the source is shown as “(direct)”.
GA source and medium classifications are always lower case, though you can use proper or upper case if you are setting source and medium with UTM parameters.
Medium
While medium is supposed to represent the category of inbound traffic, GA’s automated classification is limited to organic, referral, and “(none)”. Marketers often use UTM tags to classify other media such as social, cpc, email and affiliate traffic.
Channel
Channel groupings are similar in concept to medium, but do a little bit better job of classifying traffic, and can be configured to do much better. The default channel groupings mostly classify traffic according to the medium value, but referral traffic from social sites such as Facebook, Instagram and Twitter is counted in the Social channel. There are also channel groupings for Email, Affiliates, Display and Paid Search, but those only apply when UTM parameters are used to set medium to a corresponding value.
This page describes how the default channel groupings classify traffic: https://support.google.com/analytics/answer/3297892
It is also possible to create custom channel groupings. Custom channel groupings can be used to create more specific classifications. For example, they can separate paid social from organic social or branded search from non-branded.
UTM Parameters
The above definitions describe how GA automatically classifies traffic, but UTM parameters allow marketers to override default values for source and medium. A UTM parameter is a value that is appended to a landing page URL as a querystring. This is an example of a landing page URL without UTM parameters:
https://xyz.com/catalog.html
This is the same page with parameters:
https://xyz.com/catalog.html?utm_source=newsletter&utm_medium=email
Let’s say this landing page is linked to from a newsletter email, and a person reads the email in their Gmail account. The first URL would appear in Analytics with Source / Medium:
mail.google.com / referrer
The second URL would appear as:
newsletter / email
UTM parameters can also be used to track campaigns and keywords. Google has an online tool for adding UTM parameters to URLs:
https://ga-dev-tools.appspot.com/campaign-url-builder/
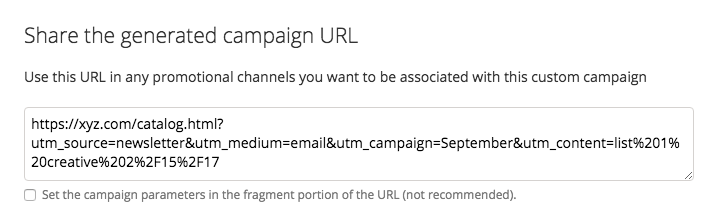
The syntax of UTM parameters is not all that complicated, but the tool is very helpful for correctly formatting spaces and special characters so they don’t break the URL and show up properly in Analytics. Below is an example of the input and output of the tool:
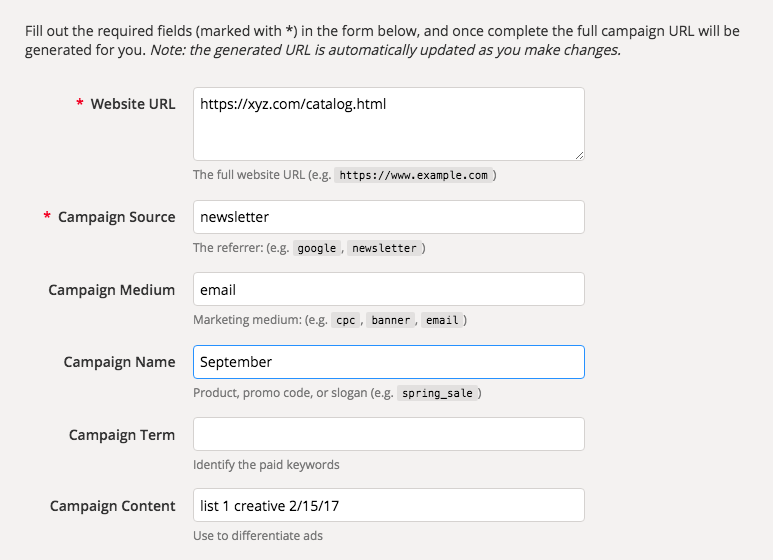
This is the output. The Campaign Content parameter can be used to track ad creative. Notice how the value has been reformatted.
Auto-tagging
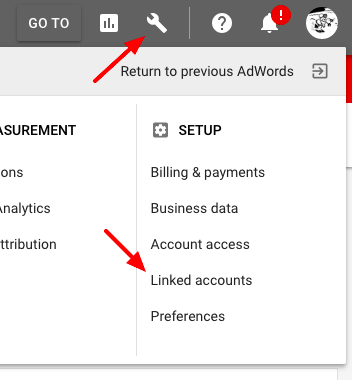
Google Ads has a setting that automatically tags all Google Ads traffic so it shows up as google / cpc in Analytics instead of google / organic. You can also link a Google Ads account to an Analytics account to report on keyword, cost and other data in Analytics. More on that below. To link accounts, click on the wrench icon in Google Ads, then Linked accounts. From there, click on Google Analytics, then select Link to the right of the GA account you want to link. The login you use for Google Ads will need to have access to the GA account for it to be visible.
Some other advertising platforms have built-in support for automatically tagging ad placements with UTM parameters as well.
Acquisition Reporting
Asking Questions, Hunting for Anomalies
When you are reviewing an Analytics account, think about the types of questions you want to answer. If you are a marketer, you want to know if you are targeting the right people with your marketing efforts, and whether or not they are doing what you want when they get to your site. Audience reporting gives you information about visitors, which can be useful when planning other marketing efforts or tailoring your messaging. Behavior reporting shows what visitors do when they get to a website. What content are visitors most interested in? What landing pages are most likely to lead to a conversion? Acquisition reporting is where you go to understand which of your marketing efforts are driving results.
It can be informative to browse around GA, to just get a feel for metrics, but it’s best to start with specific questions when doing analysis. Starting with a question forces you to think about how GA can be used to provide relevant data, rather than just letting the data wash over you. For example, if you ask the question: “how does paid search performance compare to organic?”, an obvious next step is to apply segments for paid search and organic, then look at some key reports. Spending a bit of time coming up with questions before you dig in will generally lead to more interesting results, and will likely compel you to explore more advanced capabilities of GA.
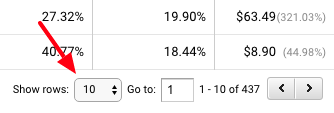
It is also a good idea to dig deeper than the top 10 results in each report. Interesting surprises often lurk further down in the data. Sort reports by engagement or conversion metrics to find performance outliers, and change the Show rows setting to see 50 or 100 rows of data.
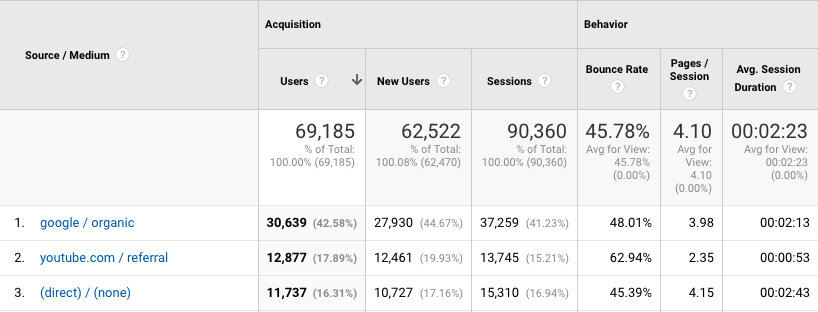
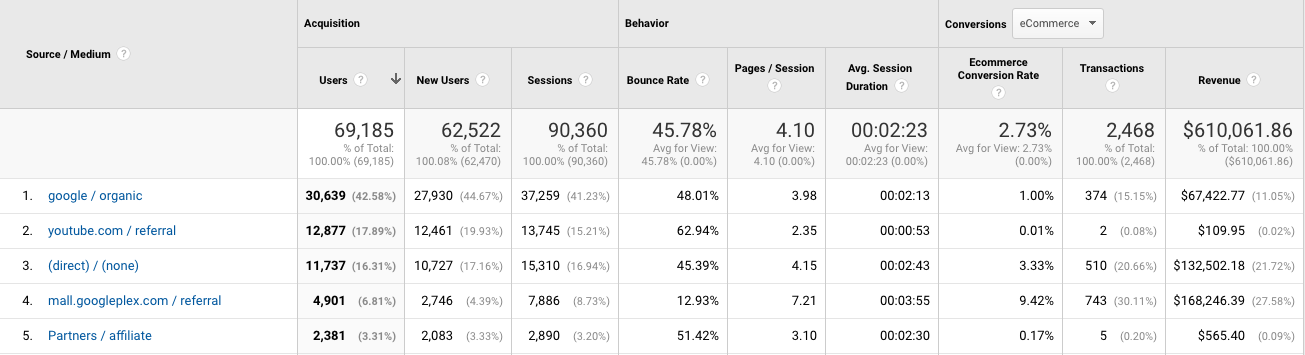
Report > Acquisition > All Traffic > Source/Medium
This report is good for answering the questions: “what are the top sources of traffic to my website?” and “which sources perform best?” Notice row 5 in the example below. It appears that affiliate partners have been given UTM parameters to add to URLs pointing to the property.
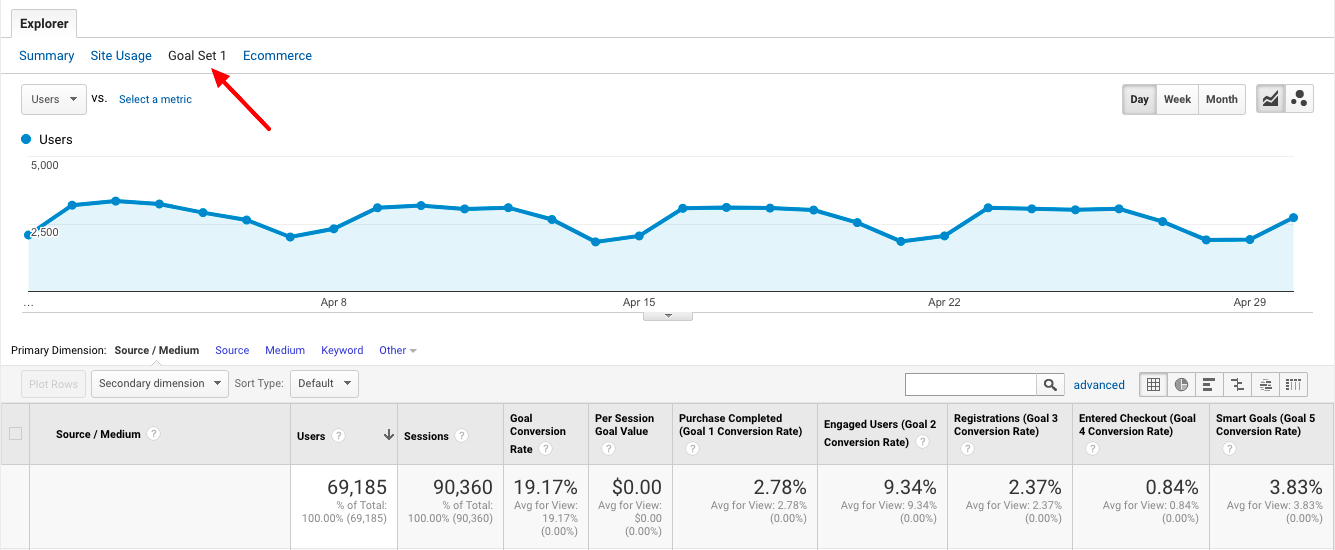
Explorer Tabs
Some reports have multiple tabs with different metrics on each tab. In the example below, the Goal Set 1 tab has been selected. This tab shows how traffic performs for each of the first 5 goals.
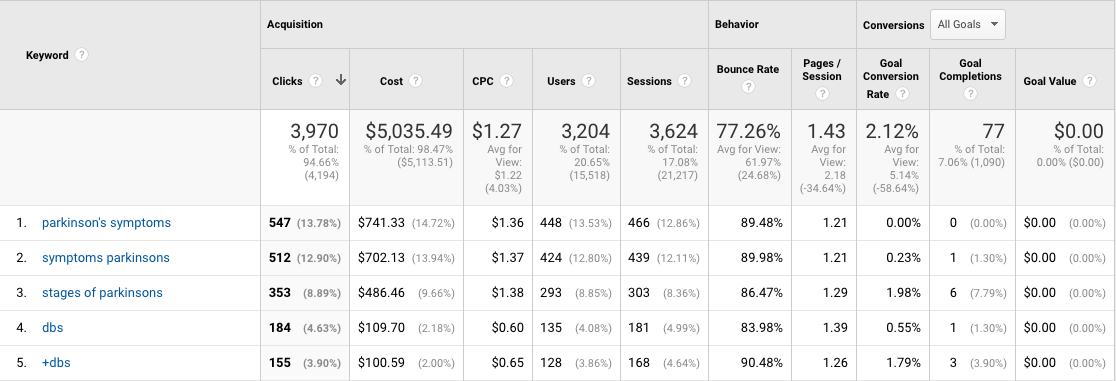
Reports > Acquisition > Google Ads
This section of reporting is good for answering all manner of questions related to paid search performance. The report below shows how each keyword performs. When Google Ads and GA are linked, these reports provide incredible depth of detail on keywords, ads, ad extensions, bid adjustments and a host of other targeting criteria. It’s worth clicking through each of the Google Ads reports just to see what’s possible.
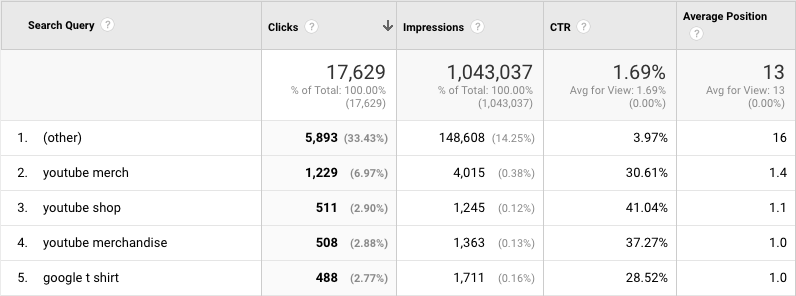
Reports > Acquisition > Search Console > Queries
Google Search Console is not part of Google Analytics, but the two can be linked. Search Console is a tool that provides webmasters and SEOs with data on how a website is performing in Google Search. By linking Search Console to GA, you can see some search console data in GA, but Search Console data is not tied to sessions in GA, so you don’t get engagement or conversion metrics in these reports. Below is a GA report showing how the GA demo site is performing in Google Search for various search queries.
Acquisition: Answering Questions with Data
Below are some of the business questions that acquisition reporting can answer. For most of these reports, you will want to set your date range to ensure a meaningful amount of data. For low-traffic sites, this may be 3 or 6 months.
Question: which sources of traffic result in the most engaged or highest converting visitors?
- Report: Acquisition > All Traffic > Source/Medium
- Business insight: look at Pages / Session and Goal Conversion Rate. Are there dramatic differences? Think about opportunities to expand the best performing sources. Are there things they could do to improve poor performers?
Question: what can we learn about people coming from the top marketing source?
- Report: Acquisition > All Traffic > Source/Medium - click on the top Source / Medium (excluding direct / none) to isolate it, then add secondary dimensions such as Region (State), Device Category, Age, or other characteristics.
- Business insight: anything we learn about visitors can be helpful from a marketing perspective. For example, if we discover that most organic traffic is coming from outside of where we sell, we can value it as a source of traffic better. If we learn that most people visit on mobile devices, we can focus more on mobile UX and advertising opportunities.
Question: what keywords have driven the best ROI (cost per acquisition, ROAS, cost per page view, etc) for paid search over the last 30 days?
- Report: Acquisition > AdWords > Keywords - for this report to work, the business has to be running Google Ads and have Google Ads linked to Analytics
- Business insight: consider bidding more on top performing keywords to improve search campaign results, and look for opportunities to add similar keywords.
- Bonus: switch to Acquisition > AdWords > Search Queries, then add Keyword as a secondary dimension to how people’s actual searches map to purchased keywords.
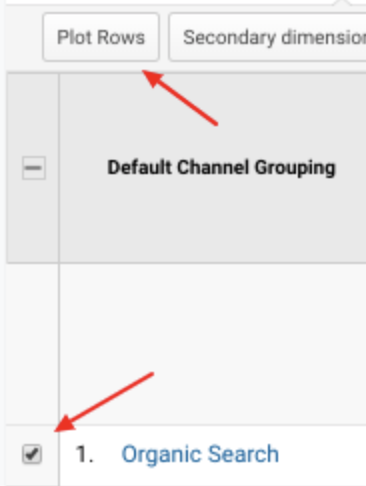
Question: what channels are driving more traffic over time?
- Report: Acquisition > All Traffic > Channels - increase the date range to the last year. Change the time increment of the graph to Month. Then select a few of the top channels and Plot Rows to see each channel on the graph.
- Business insight: is organic search going up or down? If it’s going up, this is an indication that they are doing something right. If it’s going down, they should be looking at investing in SEO. What about other channels? Are there notable trends in Social, Paid Search or other marketing channels?

Question: are there any referring sites that stand out as traffic drivers?
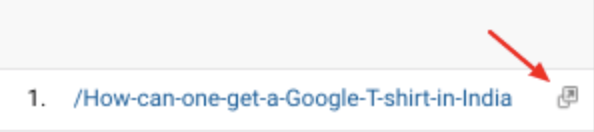
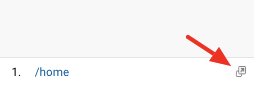
- Report: Acquisition > All Traffic > Referrals - click on a referrer to see referring pages. Click the icon to the right of the referral path to open the referring page in a browser.
- Business insight: there may be opportunities to partner with these sites, or buy advertising on these sites. They may also help you identify similar ways to obtain inbound links and traffic.
5. Behavior
The behavior section of reporting in GA mostly shows how visitors interact with a web property. In this module, we will cover the following subsections of Behavior reporting:
- Events – interactions on a page, such as scrolls, clicks, video views and form inputs.
- Site Content – reporting on entrances, page views and exits by page.
- Behavior Flow – this is an interactive report that shows how visitors move through a property. It can provide useful insights, but is also a bit frustrating to use.
- Site Speed – how long it takes pages to load.
These sub-sections are also part of behavior reporting, but we will not be covering them in this module.
- Site Search – reports on what people are searching for on a property, if the property has a search bar. For this report to work, the syntax of query parameters on search result pages needs to be configured in Admin > View Settings > Site Search Settings.
- Publisher – reports for properties that serve Google Ads.
- Experiments – this used to be part of GA, now it is powered by Google Optimize.
Events
The standard Google Analytics tag tracks page views. You can also track on-page events in GA, by adding a bit more code to the page. Events send data (category, action, label) based on what a visitor does on a page.
Events provide a window into what visitors do on a page. They also give you the ability to collect structured data. Events are triggered by something that happens on a page, usually driven by a JavaScript event. Event tracking is often implemented by a web developer, because each event requires code to be added to a website. If Google Tag Manager (GTM) has been installed on a website, it is possible to implement events without writing code, though it is still a bit technical.
For more on the nitty-gritty of setting up events, see this Google dev guide: https://developers.google.com/analytics/devguides/collection/analyticsjs/events
What Can be Tracked with Events?
Events can be used to track when people click a link and leave a site.
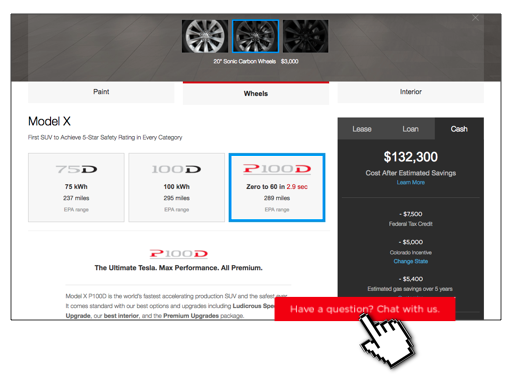
Or when they initiate an interaction such as a chat window. JavaScript is typically used to trigger Google Analytics events, and JavaScript can track mouse movements, clicks, scrolls and typing.

If there’s any type of interactivity on a page, it is a good idea to track it as an event. There’s no downside to tracking something as an event, so in general it’s better to collect any and all interaction data so it’s available for later analysis.
Other things that can be tracked as events:
- Video views
- Form field fills
- Interactions with carousels and sliders
- Scrolling
- Anything that is associated with a JavaScript event
Behavior Reporting
Report > Behavior > Events
Unlike goals, events are not available as metrics in most reports. You have to go to the Events reports to get details on event interactions. Below is an example of an event report for a property (not the demo site). The Event Action has been added as a secondary dimension, so both Category and Action can be viewed together. Annoyingly, there is not a default report that shows event categories, actions and labels as dimensions in a single view.
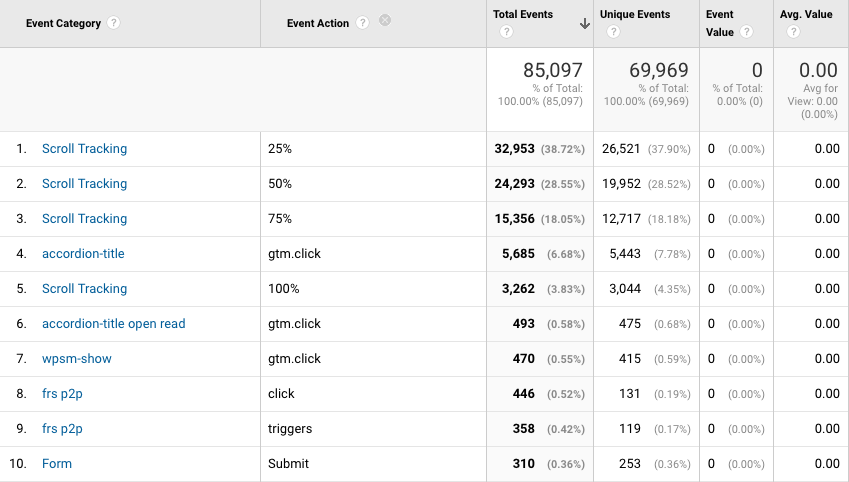
It is necessary to add in secondary dimensions or segments to correlate events to audience characteristics or traffic sources.
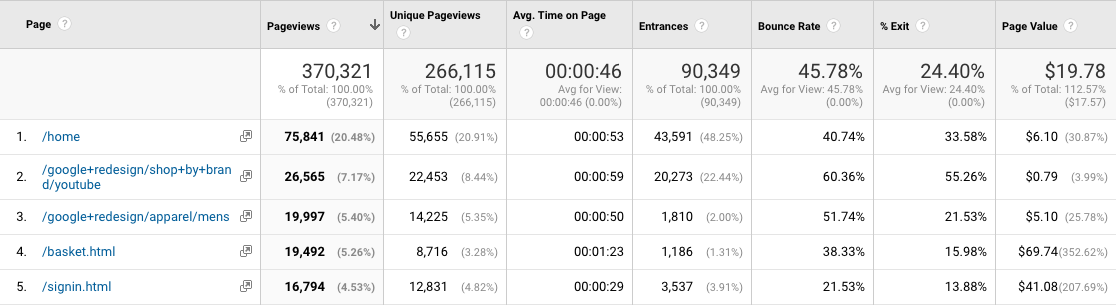
Reports > Behavior > Site Content
The site content reports show visitor behavior by page view. They are useful for answering questions like, “what is the most visited content on my site?” or “what pages have the highest exit rates?” The answers to these questions are useful for planning and optimizing website content.
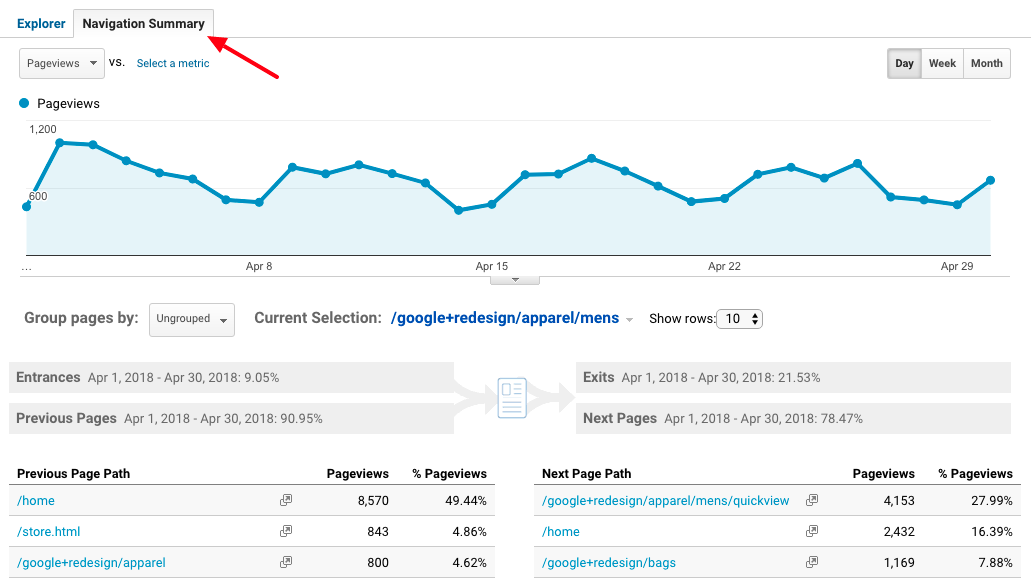
From the site content reports you can select the tab Navigation Summary to see the pages users visit before and after a given page. This can be very helpful for understanding and designing for the intent of visitors. For example, if you find that people often go from a catalog page to a sale page, it might make sense to incorporate sale items into the catalog page.
Report > Behavior > Behavior Flow
The behavior flow report looks pretty, but it is fairly difficult to use. The idea is that you can get a feel for how people flow through a site, but the information is not presented in a very intuitive way, and it can’t really be shared with people who are not familiar with the report. Below is an example from the demo site. Mousing-over a page pops up statistics about the page, which is sort of handy, but also makes it difficult to compare data.
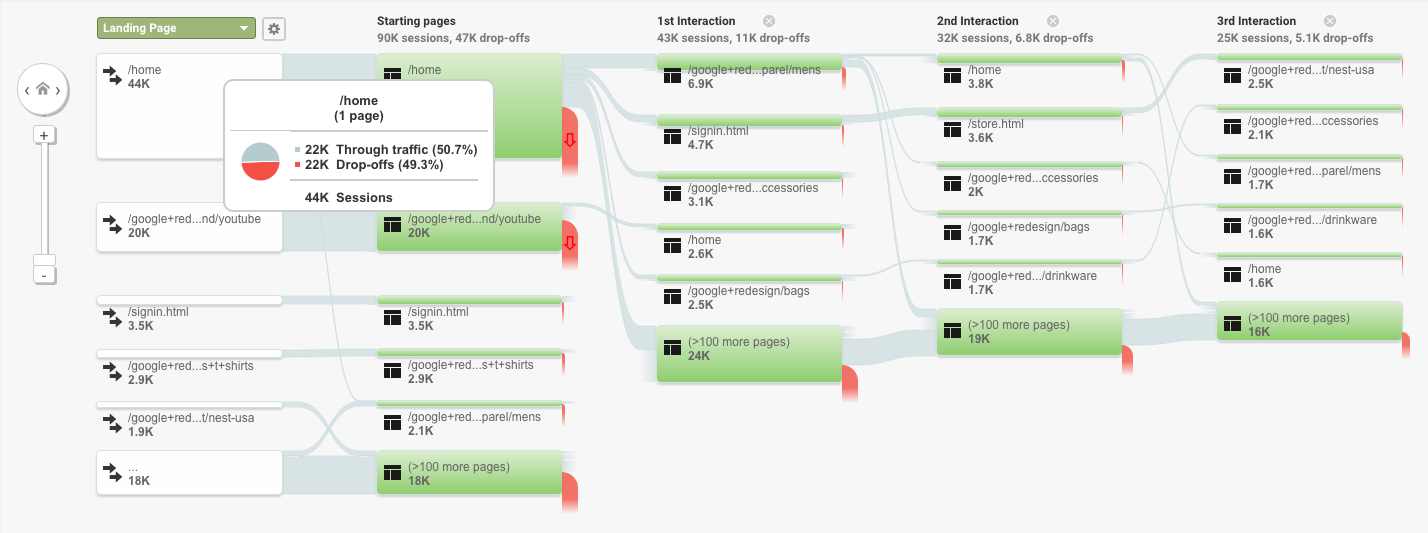
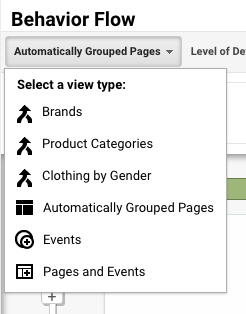
The report is very interactive – there are a number of things you can do to narrow down or expand on data. One setting of particular note: at the top left of the report is a drop down with options for what data to view in the report. You can look at individual pages, but you can also create groupings of similar pages, or view interactions with events.
For more on creating content groupings, see: https://support.google.com/analytics/answer/2853546?hl=en
Site Speed
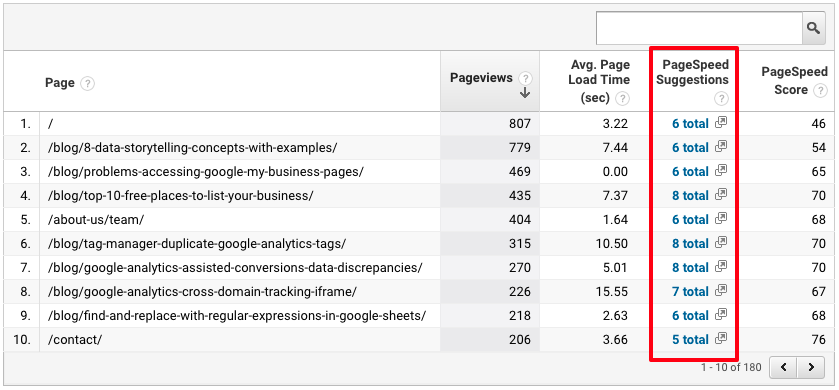
Site speed isn’t really a category of behavior, but it does relate to behavior, and is important to monitor. Google has acknowledged that page speed is a factor in organic search ranking[4], and faster-loading pages provide better user experience. Below is an example of a Site Speed > Speed Suggestions report. This report links to specific suggestions to improve load speed. These suggestions often point to easy fixes that can have a positive impact, such as poorly-optimized images. For a more comprehensive analysis, the Lighthouse audit reports that are part of Chrome Developer Tools are an excellent and free option.
Page Analytics
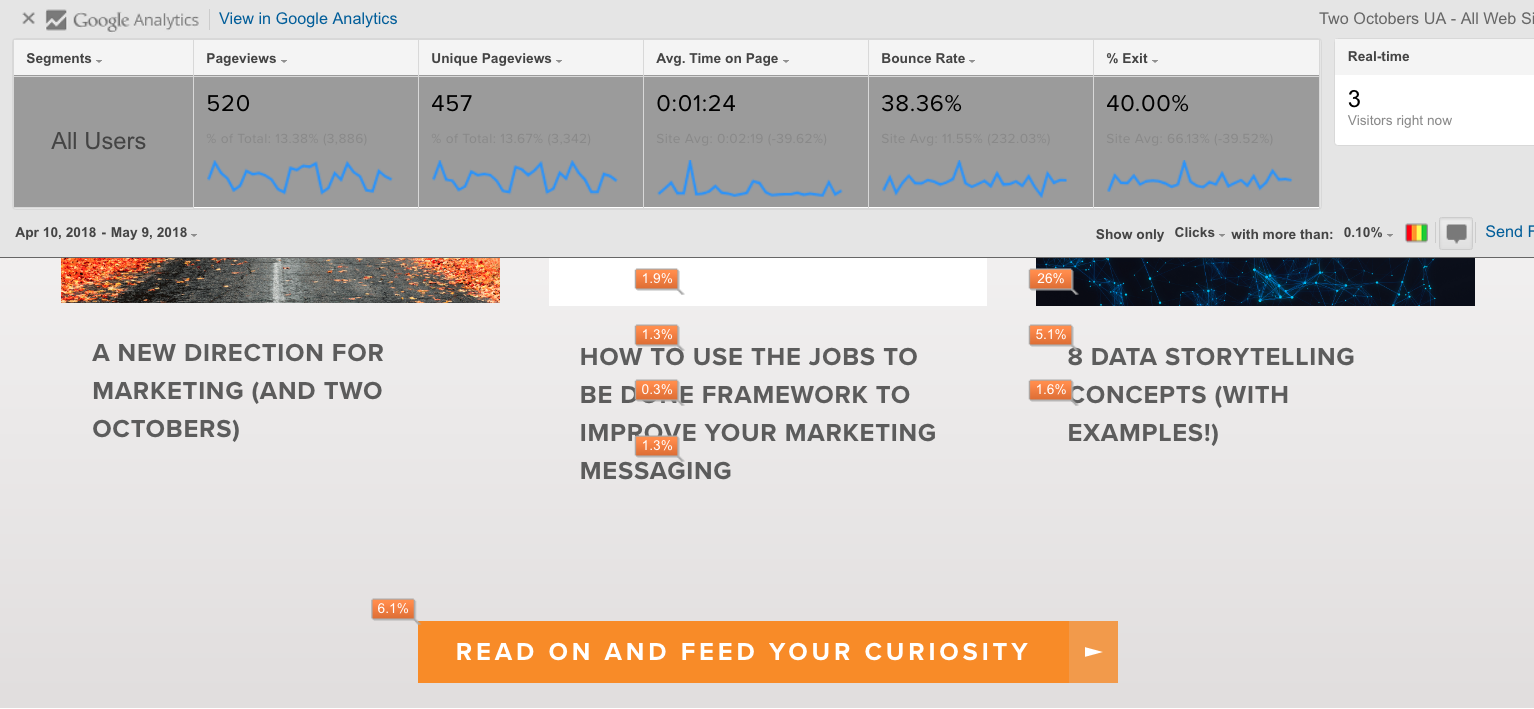
The Page Analytics Chrome Extension shows Google Analytics detail about a page when viewed in Chrome. To see Analytics data, you need to be logged in to Chrome with a login that has Analytics access to the site you are viewing. This view is particularly useful when you are evaluating website opportunities or page design, as it shows what people are likely to click on from a given page. It can get a little wonky with navigation and links that display dynamically based on user-interaction, such as drop-down menus.
https://chrome.google.com/webstore/detail/page-analytics-by-google/fnbdnhhicmebfgdgglcdacdapkcihcoh
Behavior: Answering Questions with Data
Below are some of the business questions that behavior reporting can answer.
Question: where do visitors go from the home page?
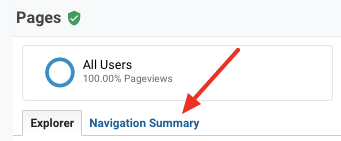
- Report: Behavior > Site Content > All Pages – Navigation Summary. (Typically, the home page is the highest-traffic page, in which case the Navigation Summary will default to it. If it is not the highest-traffic page, click on the home page listing before clicking on Navigation Summary.
- Business insight: are people generally going from the home page to other high-value pages on the site? If not, think about ways to make it easier/more compelling for visitors to continue, such as more visible links and more compelling calls to action.

Question: are there any unusually slow pages on the site?
- Report: Behavior > Site Speed > Page Timings. This report defaults to the comparison view. It’s a bit confusing to read this way. Click to the Data view to see more details about each page.
- Business insight: page speed significantly impacts user experience and mobile speed in particular is an important organic search ranking signal. Test a few of the slower pages you find in this tool: https://www.thinkwithgoogle.com/feature/testmysite/ to get actionable suggestions for improving speed. In GA, you can click on the icon to the right of the page name to open the page in a browser window and get the full URL.
Question: what landing pages are most likely to lead to conversion?
- Report: Behavior > Site Content > Landing Pages – set Conversions to All Goals
- Business insight: evaluate the pages with the highest conversion rates. Click on the Goal Conversion Rate column to sort descending, but be wary of drawing conclusions from pages with very few clicks.
Do top-performing pages have something other pages do not have? Should marketing be focused on driving more traffic to these pages? - Bonus: add Device Category as a secondary dimension to see if mobile user experience differs from desktop.
Question: what pages get the most visits?
- Report: Behavior > Site Content > All Pages
- Business insight: evaluate the pages with the most views - visit them in your browser and think about the experience of a prospect landing there. Do they have a compelling call to action? How could the website get more value out of these pages?
Question: what are the top exit pages?
- Report: Behavior > Site Content > Exit Pages - this report defaults sorts to show the pages with the most exits.
Business insight: do the top exit pages make sense? For example, you would expect people to leave from an order complete or contact us page. If not, look at the pages and think about reasons people might be leaving. It might help to add in secondary dimensions to learn more about people leaving from the page. For example, adding Device Category might indicate that poor mobile user experience is a factor.
6. Conversions & Multi-channel Funnels
In this module, we will cover how to set up goals in GA, and some of the reports in the Conversions section of reporting that help us understand the whos and hows of conversion behavior.
We’ll be using the Google Analytics demo account in the examples in this module. The demo account is a GA property configured on a real, live website: https://shop.googlemerchandisestore.com/. The store gets a lot of Google employees as customers, which makes some of the data a bit atypical compared to other ecommerce sites. For example, a lot of revenue comes from Mountain View, California. To access the demo account, go here:
https://support.google.com/analytics/answer/6367342?hl=en#access
Goal Conversions
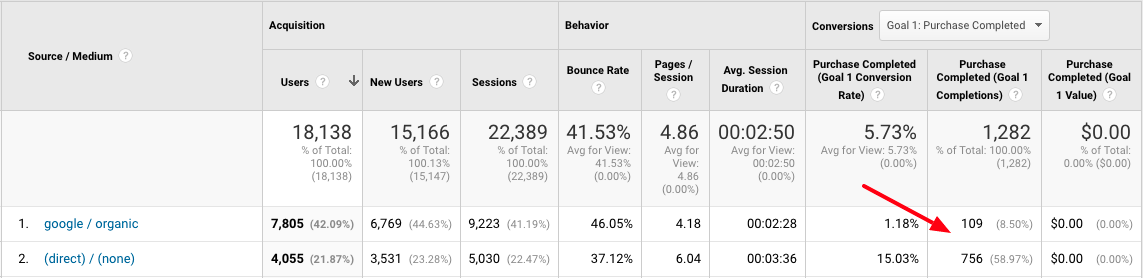
Goals in Google Analytics are used to measure actions or thresholds that visitors complete on a website. Goal counts show up in most reports, and provide an indication of how well different dimensions perform. In the example below, the Acquisition > All Traffic > Source/Medium is shown, with columns to the right showing Purchase Completed goals. In this example, we see that 109 google / organic visitors completed purchases, compared to 756 (direct) / (none) visitor purchase completions. Most notably, the third column from the right shows that 15.03% of direct visitors completed the goal, in comparison to 1.18% of google / organic visitors.
Goal conversions in Google Analytics are most often triggered by specific page views or events, though it is also possible to track a threshold number of page views or time on site as a goal. The latter two make sense for web publishers who are primarily looking for engagement, such as news websites or industry portals. For most businesses, more tangible outcomes such as acquired leads or online orders are the goals worth tracking.
To create a goal, go to the view section of the Admin interface (you get to the Admin interface by clicking on the gear icon in the lower-left-hand part of the screen). Goals are specific to a view.
Admin > View > Goals > New Goal:
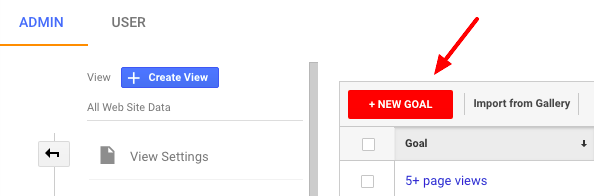
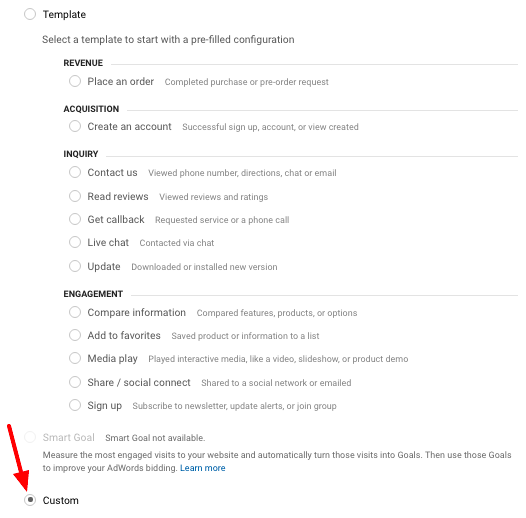
GA has a number of pre-built templates set up for goals. These are interesting to look at as examples, but don’t really make goal setup any easier. Select Custom to have complete control over goal configuration.
Next, you specify a name for the goal and select which type of goal it will be.
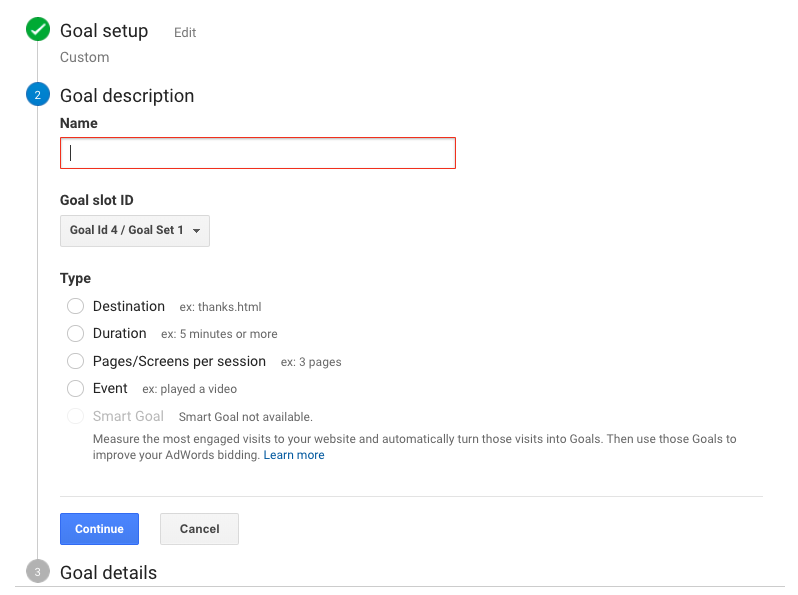
The next step varies depending on which type you choose.
Types of Goals
Destination
This is probably the most commonly used goal type. With a destination goal, you specify a page that constitutes a goal. For example, if a contact us form takes the user to the page /contact/thank-you.html when submitted, you can set this up as a goal.
Other examples of destination conversion goals:
- A confirmation page for any kind of lead form
- An order confirmation page
- A product detail page
Note that not all website contact or lead forms have confirmation pages. It has become more common to show a confirmation message without taking the user to a different page. In those circumstances, an event goal is required.
Duration and Pages/Screens per session
These goal types are fairly similar to each other and useful for measuring engagement versus the completion of an action. In either case, you set a threshold and when a visitor exceeds the threshold a goal completion is counted. For example, you could set a goal to count when a user visits at least five pages. There is not typically anything meaningful about the exact number of pages, it is just a measure of more engaged visitors.
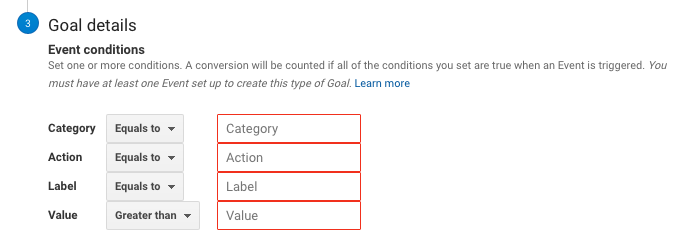
Event
This is the most powerful and flexible goal type, but requires a bit more work to set up. Event goals are triggered by a match to one or more event fields. Because events can be triggered by any interaction with a page, including mouse clicking, hovering, scrolling, or form field entry, event goals can fire based on any of those interactions.
The downside of event tracking is that it has to be set up on the website. The other goal types can all be set up within Google Analytics, but a developer typically has to help set up an event, because it requires additional code to be added to the site.
Examples of event goal conversions:
- A download of a PDF or other document – this can be tracked with a click event on a link to download
- A video view – this can be tracked as a click event on a video player. Embedded video players such as YouTube also emit events that allow tracking of percent completed
- A click on a link to another website
- Submitting a form
- Scrolling
Phone Calls
This is not a standard goal type, but worth mentioning, because it is very useful for many businesses. There are a number of 3rd party vendors that offer call tracking solutions that integrate with Google Analytics. These solutions typically provide a block of JavaScript code that dynamically swaps out phone numbers on a website with forwarding phone numbers that associate calls with website visits and sources.
What Makes a Good Goal?
There are no default goals in Google Analytics, and no standard best practice for what should count as a goal and what should not.
For an ecommerce business, it’s pretty straightforward: a sale equals a conversion. For many businesses, it is more nuanced. For example, what does a car dealer count as a conversion? Car dealer websites typically have financing application forms, requests for quote forms, and a host of other ways a prospect can interact with the site. Are they all conversions? Should they all be counted equally?
The answer is that any interaction that equates to value should be counted as a conversion, and no, all conversions do not need to be counted equally.
Generally speaking, more data is better when it comes to goals. Goals are useful for understanding the value of different traffic channels, or difference in performance between locations, age groups, or other dimensions. Having more goal conversion data makes it easier to identify when one of these dimensions is performing better than another.
One of the most common problems with Google Analytics accounts is incomplete or incorrect goal tracking. A good exercise when beginning to work with a GA account is to review the site and identify any and all user interactions that relate to the business’s business. Then compare what you find to the goals set up in GA. If you find meaningful interactions that are not being tracked as goals, recommend that they be added. Also make sure to test existing goals to make sure they work as expected. It is pretty common for goals to stop working properly because changes have been made to a website, but no one has updated the goals.
Conversion Funnels
Demo: Analytics Demo Account > Conversions > Goals > Funnel Visualization
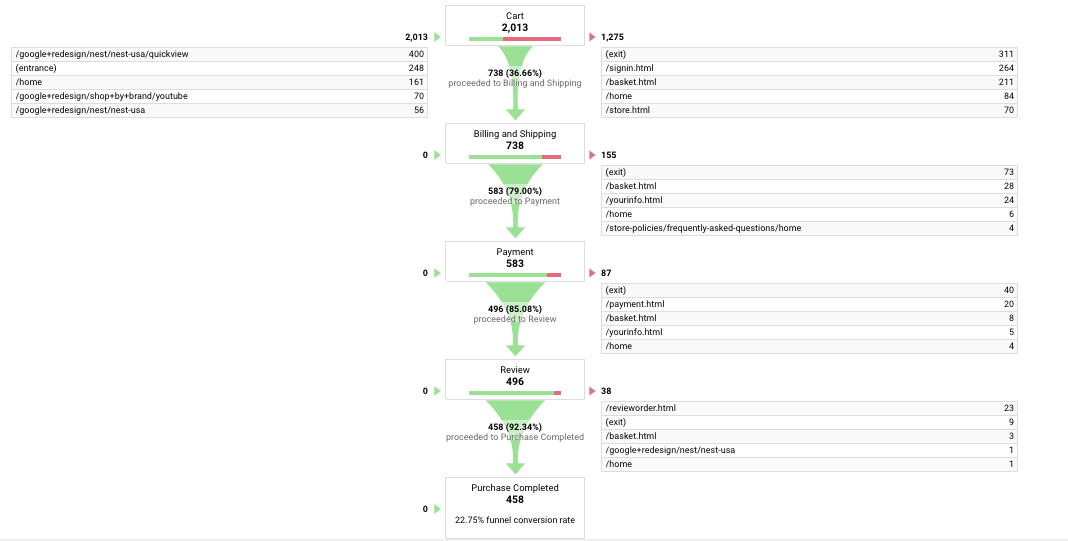
When setting up a destination (URL-triggered) goal conversion, you can specify a conversion funnel, which tracks specific steps leading up to a conversion. The most common use of this is to track shopping cart steps leading to a purchase, but any sequential process on a website can be defined as a conversion funnel.
Below is an example of a funnel, from the Google Analytics Demo account. Funnels are extremely useful for analyzing where people drop off on the way to a goal completion, and where they go. For example, if a high percentage of people are exiting from a payment page, it may be a sign that a site should offer more options for payment methods.
Multi-channel Funnel Reporting
The multi-channel funnel section of GA reporting shows the behavior of visitors who leave the site, then come back before converting. This can be very useful for understanding the value of sources of traffic that contribute to conversions, but are not necessarily the last source before conversion. For example, if a person finds out about a website via Facebook, but then later returns via Google organic search and completes a goal conversion, Multi-channel funnel reporting can show you this sequence.
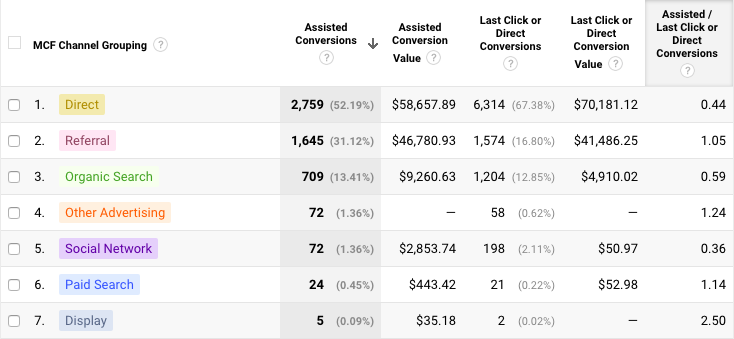
Below is the assisted conversion report. This report shows sources that influenced conversions but were not the last click before conversions. It is a quick way to see the indirect impact of different channels, but not particularly useful for ROI analysis, since it doesn’t weight assists depending on how many sources were involved. In other words, if ten sources preceded a converting visit, all 10 get credit for the same assist.
Conversions > Multi-Channel Funnels > Assisted Conversions
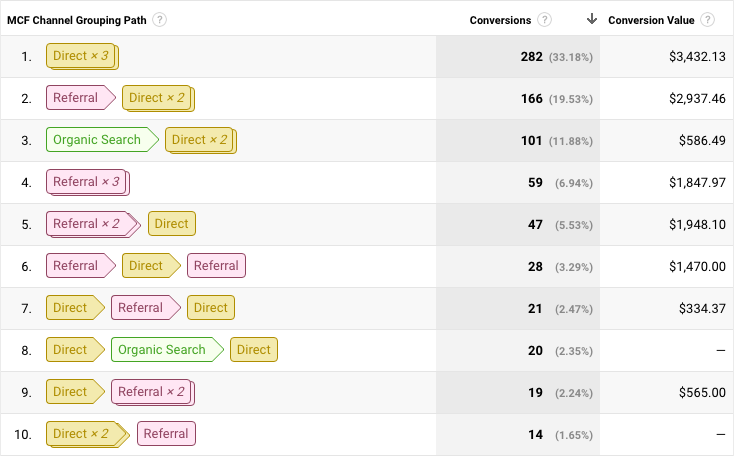
The top conversion paths report details out exactly what sources preceded converting visits and is extremely useful for understanding visit behavior and the impact of different marketing channels.
Conversions > Multi-Channel Funnels > Top Conversion Paths (Google Analytics demo account)
A few important points about multi-channel funnel reporting:
- GA can only report on return visits when it knows that the same person is coming back to the site. There are many reasons why GA may have an inaccurate or incomplete view of individual visitors – more on this below. As such, take these reports as directionally useful, but not absolute truth on repeat visit behavior.
- Elsewhere in GA, the default model for attributing conversions is last, non-direct click. In multi-channel funnel reporting, direct visits are also included. We talk about this more in the next section, but the main takeaway here is that multi-channel funnel reports often do not exactly match other reports.
Attribution Models
When Google Analytics shows a goal conversion metric attributed to a dimension such as source, medium or location, the dimension applies to the last time the user visited the site before completing the goal conversion. For example, if you visit a site on your phone from Denver, then visit it the next day from Fort Collins and fill out a contact us form that is configured as a goal, the contact us goal would be attributed to a visit from Fort Collins. This is called last click attribution, since the goal is attributed to the last click through to the site.
When it comes to attributing goal conversions to a source, medium or channel, the attribution model used by Google Analytics is last non-direct click. What this means is that Google Analytics will attribute a conversion to the last tracked source. For example, in the sequence of visits below, the conversion would be attributed to the second-to-last visit, which is an organic search. If a person only visits a site directly and converts, then the conversion is attributed to direct.
But shouldn’t paid search and Facebook get some credit for the conversion? Some would argue that the first source deserves more credit than the last, or that credit for the conversion should be shared between all sources. These are called “attribution models”, and Google Analytics is currently beta testing features that will allow users to change the default attribution model from last non-direct click to various other models. They have already released this functionality in AdWords.
Other Attribution Models
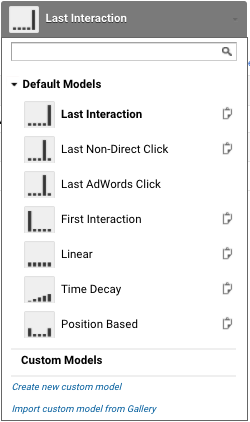
In addition to last click, some common attribution models are:
First-click – the first click through to a site gets all the credit
Linear – all click throughs get equal credit
Time-decay – credit is split, but the most credit is given to the most recent click through, and less is given to previous click throughs as a function of time
Given time and analysis chops, it often makes sense to develop an attribution model that is specific to a given advertiser and implement it as a custom model in GA. Here are a few factors that vary by circumstance:
- Do customers tend to repeat purchases? If so, more weight should be given to more recent clicks.
- Conversely, if most customers are purchasing for the first time, the source that drove the first click should be given more weight.
- What percentage of organic search traffic is brand? If the percentage is high, organic search should not receive much weight, since brand search traffic is navigational.
- If the advertiser invests a lot in broadcast media (print, TV, radio), direct and brand search traffic should receive more weight, since these sources are impacted by offline media exposure.
The Model Comparison Tool
Conversions > Attribution > Model Comparison Tool
The model comparison tool allows you to compare different attribution models. It is not possible to apply different attribution models to other reports in GA at present, but Google has a product in beta creatively named “Google Attribution” which should extend the attribution modeling capabilities of GA.
No Attribution Model Is (even close to) Perfect
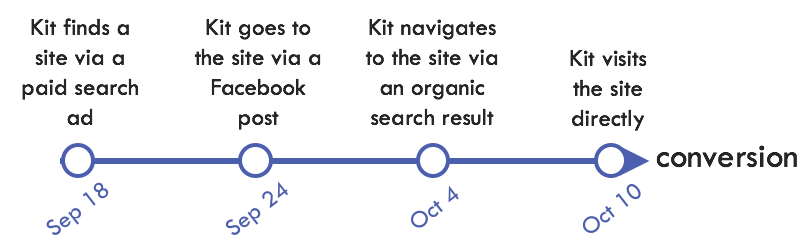
Below is a visualization of the customer journey (source: Forrester Research). It is meant to demonstrate that people rarely conform to the funnel we marketers use to describe their behavior. This has significant implications for what we can know from GA. The reality is that most consumers have had many exposures and interactions with a business or brand before they purchase that may not be tracked in Google Analytics.
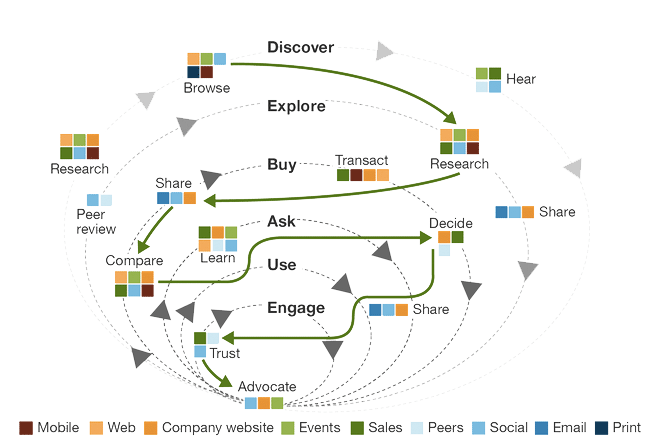
Some, like social and email may or may not, depending on whether or not the person clicks through to the website. Some behavior becomes even harder to track, because multiple people or devices are involved. Also, the consideration process for complex purchases such as education, real estate or travel may take months or even years, which increases the probability of untracked interactions. Below are some of the factors that can cause GA data to be erroneous or incomplete.
- Multiple people involved in a purchase decision
- Using multiple devices during the consideration and purchase process
- Blocking or clearing cookies - Google Analytics relies on cookies to track users. Some users use cookie blockers or private browser sessions to prevent being tracked
- Offline interactions that can’t be tracked, such as TV, radio, print and in-store visits
- Online interactions that are not tracked in Google Analytics, such as research on third-party sites like Yelp and TripAdvisor, or social media networks
Industry research, focus groups, regression testing and other statistical methods can help quantify the untracked impact of marketing channels, to help quantify the full impact of marketing. Some advertisers also heuristically lower their ROI goals for tracked results, because they know that the impact of marketing is generally greater than what can be tracked. But it is more common for an advertiser to focus on what can be measured and ignore the factors discussed above.
People in the industry often talk as if we are getting closer to perfect knowledge of the customer journey, but in many respects, we are actually getting farther away. Facebook, Google and many other services are making it easier to find out about a business without going to the business’s website, and browsing behavior is spread across more and more devices. Increased focus on privacy is also making it harder for user behavior to be stored and shared from one site or service to another. If we reconcile ourselves to the fact that we have at best partial knowledge of users over time, we can use GA to form a more accurate picture, even if it is a bit blurry in places. This brings to mind the inimitable words of Donald Rumsfeld:
“There are known knowns. These are things we know that we know. There are known unknowns. That is to say, there are things that we know we don't know. But there are also unknown unknowns. There are things we don't know we don't know.”
In the world of Google Analytics, the known knowns are things like what pages get viewed, and how many people complete a lead form. Known unknowns include the “whys” behind visitor behavior, and personal characteristics of visitors. Unknown unknowns are by definition unknowable, but certainly include nearly everything a website visitor does before and after a visit.
Offline/Offsite Conversions
If you are a brand marketer, some or all sales may happen somewhere other than your website, and cannot be tracked directly in Google Analytics. If you are not taking this revenue into account, you are significantly undervaluing the impact of marketing. Following are a few tactics for estimating the impact of your digital marketing on sales that happen elsewhere.
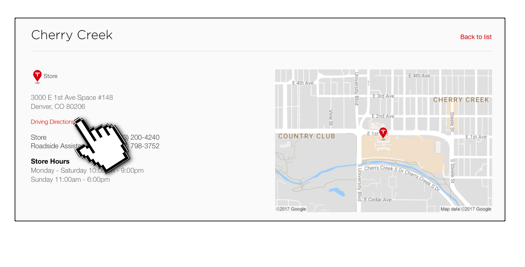
- Store locator searches. Research published by Google indicates that “76% of people who search for something on their smartphones visit a business within a day[5].” Use your judgement on how to value this, but here’s a way to think about it: if 76% of people who search for a store visit a store, and they are looking for your product specifically, they are very likely to purchase. If we estimate that 2/3rds of those people purchase, that means that about 50% of store locator searches result in a purchase.
- Clicks from your site to online retailers. See if you can add a UTM code to offsite links, and get reporting back from retail partners on purchases attributed to you. They also may have an existing affiliate program you can use to track performance, even if they are not paying you as an affiliate. If you send traffic to Amazon and you also Advertise on Amazon, a reasonable estimate is that traffic you send converts similar to a person who does a brand search on Amazon. You can estimate the likelihood of brand searches converting on Amazon using the Search Term report and the Purchased Product report.
- A/B testing. Perhaps the best way to measure the total impact of your digital marketing is to A/B test in geographic markets. To do this, set up a control group of 5 or 10 markets, where you will not advertise, and then run digital in 5 or 10 markets and compare total sales between the test group and the control.
Conversions: Answering Questions with Data
Below are some of the business questions that conversion reporting can answer.
Question: are the top conversion paths varied and complex? Do they represent a significant percentage of conversions?
- Report: Conversions > Multi-channel Funnels > Top Conversion Paths
- Business insight: this is evidence that customers tend to visit multiple times and through multiple channels before converting, which supports a cross-channel approach to marketing.
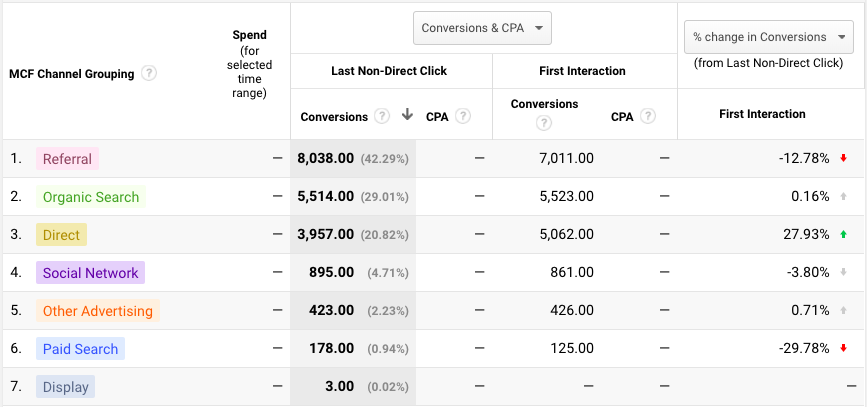
Question: how does Source / Medium performance for Last Interaction versus First Interaction attribution?
- Report: Conversions > Attribution > Model Comparison Tool
- Business insight: sources that do better in the First Interaction model are not getting enough credit, since GA defaults to Last Interaction attribution.
Question: are there traffic sources that influence conversions, but don’t get attribution?
- Report: Conversions > Multi-channel Funnels > Assisted Conversions
- Business insight: these sources may be undervalued and deserve more focus.
7. Tutorials
Tutorial: What Are My Top Audiences?
Audience Analysis in GA
The Audience section of GA reporting shows characteristics of the people who visit a website, including where they come from, what devices they use, and demographics. To understand top audiences, we are going to export several of these reports and look for top- and poor-performing audience segments.
The reports we are using require that demographics and interest reporting is enabled in GA. They are not enabled by default. Templates for these reports are included in this Google Sheet. You will need to select File > Make a copy from the template to create your own, editable version.
The sheet has three different audience analysis templates. Each compares revenue per user for different groups. This is used instead of ROAS because we cannot associate advertising cost for most users. It is a useful metric for understanding the value of a visitor, rather than understanding the value of a marketing channel. The comparison column looks at the ratio of revenue per user to the overall average. So, for example, in the Age & Gender analysis below, males 25-34 generate 90% of the revenue of a typical user.
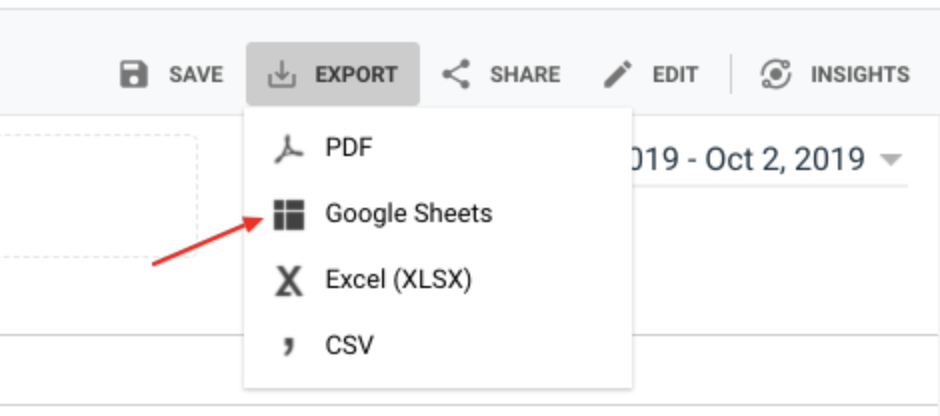
You will be using the Export > Google Sheets functionality to source data for each of the reports. You will need to open the exported Sheet and copy/paste from there to your copy of the template sheet.
These are the templates:
- Audience - Age & Gender tab
Google Analytics infers age and gender data from behavior, for the most part, and is not able to assign an age and gender to all users. It varies by account, but in most cases age and gender are unknown for more than half of users. - Audience - City tab
The idea of this report is to compare the top 50 cities of origin for users, but it could easily be expanded to include more cities, or changed to look at states. Location data is based on various signals, and tends to be very accurate. - Audience - Affinities tab
Affinities are categories of interests that Google determines from web browsing behavior. This report is useful for understanding the characteristics of people who are more likely to purchase. Affinities can be used for Facebook audience targeting and segment targeting on other networks.
Here is an example of one of the reports, Age & Gender. See the Google Sheet for functional examples of each, as well as instructions for selecting the data.
Tutorial: How Are My Marketing Channels Contributing to Revenue?
Calculating Marketing ROI
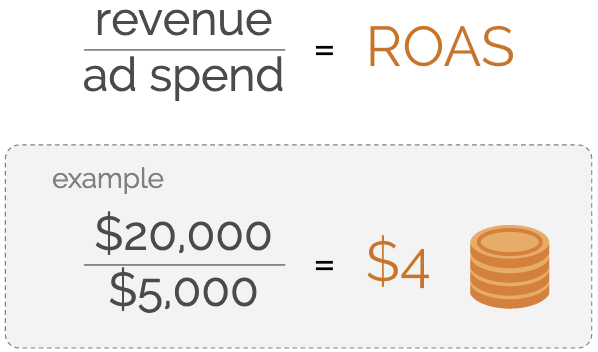
There are a lot of different ways to look at marketing ROI, but for organizations that sell online, return on ad spend (ROAS) is a common metric for measuring marketing performance. ROAS is gross revenue divided by ad spend. Simply put, how much did you spend to generate how much revenue? It is commonly described as a dollar figure, e.g. “we generated 4 dollars in sales for every dollar spent on marketing,” though sometimes it is expressed as a percentage, e.g. 400%.
If awareness or leads are the focus of marketing, the other common metric is cost per acquisition (CPA), which is also referred to as cost per lead (CPL).
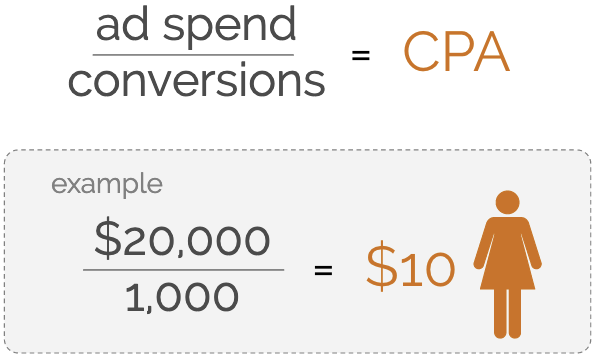
Generally, we calculate CPA as total spend divided by total conversions, though ideally we want to get to the cost to acquire a unique human being. This number is referred to as cost per acquired customer (CAC), but is elusive due to the fact that Analytics can’t reliably identify unique people.
Both ROAS and CPA rely on cost data, which is a bit of a challenge in Google Analytics. It is possible to get the cost of Google Ads to show up automatically in GA, but other channels are a bit more challenging. You can load costs by channel manually, but it is a bit of effort to get this set up, and requires an ongoing commitment to keep it accurate. For most purposes, it is easier and more practical to do this analysis outside of GA. Below is an example of calculating CPA and ROAS in a spreadsheet.
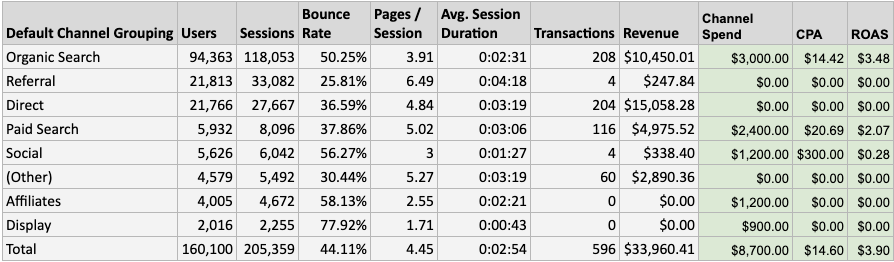
A template for this report exists on the ROAS + CPA by Channel tab of this Google Sheet. Select File > Make a copy to create an editable copy. The CPA and ROAS columns are formulas similar to those described above.
When you calculate the cost of each of these channels, consider including the cost of time as well as the cost of media. For example, at a small scale, organic social media may feel like it is essentially free, but to scale this as a channel, you will need dedicated resources, and may also need to pay for design and production services.
Calculating the cost of organic search can also be a bit complicated. Organic search engine optimization (SEO) tends to be a long-term investment, which should be amortized over time. One approach is to take an SEO investment made in a given month, and spread it out over the following 12 months.
UTM Codes and Custom Channel Groupings
The spreadsheet above uses the default channel groupings set up in GA. A channel grouping is a group of traffic sources that together comprise a channel. For example, all traffic from organic search engines (Google, Bing, DuckDuckGo, Baidu, etc.) is categorized as Organic Search. There are a few simple things you can do to make channel groupings much more useful.
To make channel groupings more useful, we’re going to create a new paid social channel grouping in GA based on the UTM codes appended to social ads. We’ll also create separate channel groupings for branded and non-branded paid search. For that part to work, Google Ads and Google Analytics need to be linked.
Step 0 - Google help article on linking Google Ads and Analytics
If you are also advertising on Bing, watch this video to learn how to tag Bing ads to automatically track properly in GA.
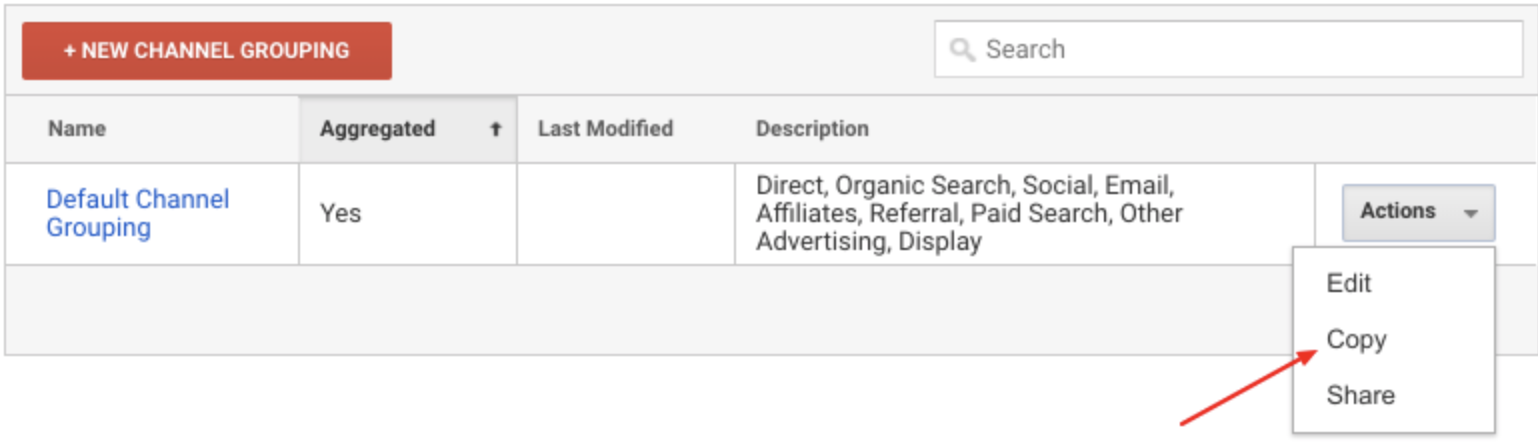
Step 1 - go to Admin > View > Channel Settings > Channel Grouping. Under the Actions drop-down to the right of Default Channel Grouping, select Copy and name the new channel grouping Advanced Channel Grouping. Note that you could modify the Default Channel Grouping instead of creating a new one, but this can’t be undone. It’s safer to create a new one.
Step 2 - append UTM codes to all of the links to your site from ads and paid content on social media networks. In the UTM codes, specify Source as the network, e.g. facebook, twitter, etc., and specify the Medium as cpc.
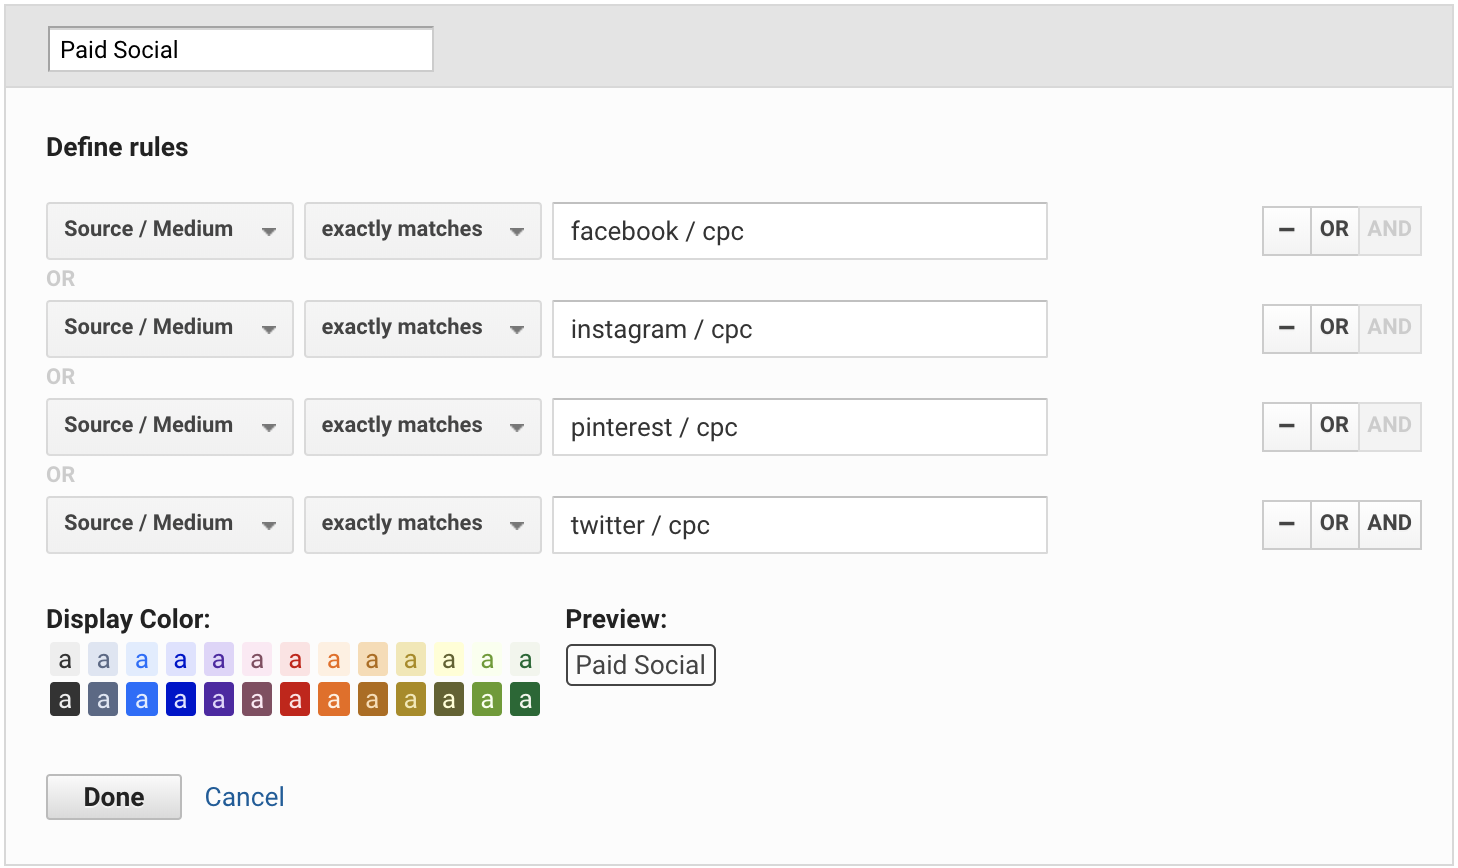
Step 3 - at the top of your new channel grouping, under CHANNEL DEFINITIONS, select Define a new channel. Name the new channel Paid Social, and add rules to match Source / Medium for each of the social networks on which you advertise. Make sure to use OR conditions for each rule. Once you are done, click Done and drag your new channel above the existing Social channel. GA evaluates channel definitions in order, and it is critical that the Paid Social channel gets evaluated first. Any social traffic that doesn’t get picked up by the Paid Social channel will fall into the organic Social channel.
Step 4: select the pencil to the right of the preexisting Social channel to edit it. Change the name to Organic Social.
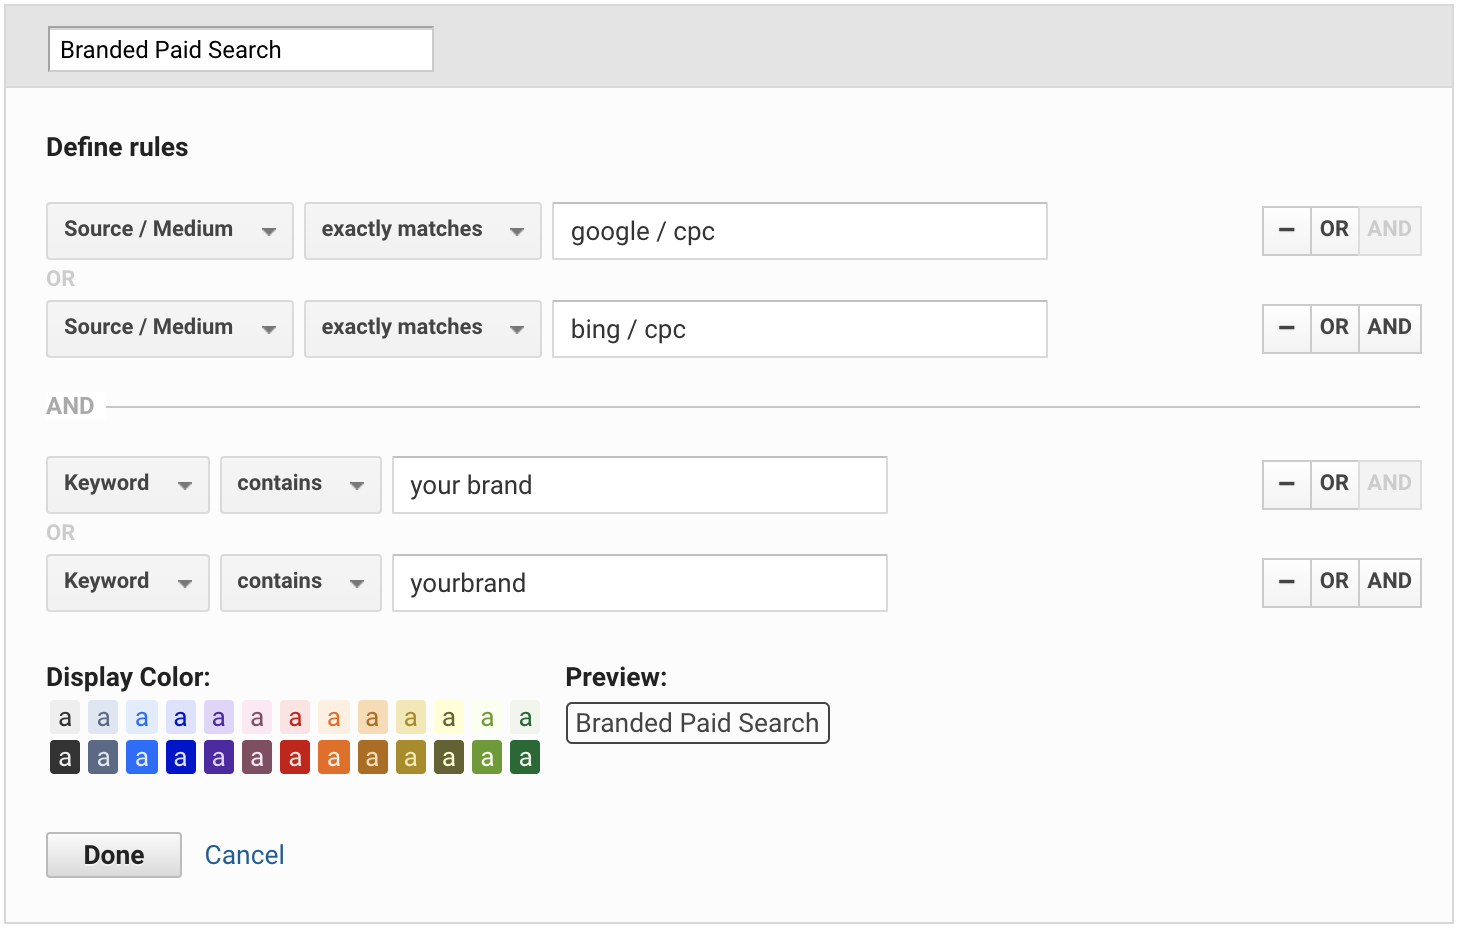
Step 5: at the top of your new channel grouping, under CHANNEL DEFINITIONS, select Define a new channel. Name the new channel Branded Paid Search. Add a rule to match Source / Medium exactly matches google / cpc. Add an OR condition for bing if you are also advertising on bing. Then add an AND condition for Keyword matches, and specify contains and your brand name. If there are different ways people might search for your brand, include each of them. You don’t need to worry about uppercase/lowercase. When done click Done and drag your new channel above the existing Paid Search channel.
Step 6: select the pencil to the right of the preexisting Paid Search channel to edit it. Change the name to Non-branded Paid Search.
Here’s how everything should look when you are done:
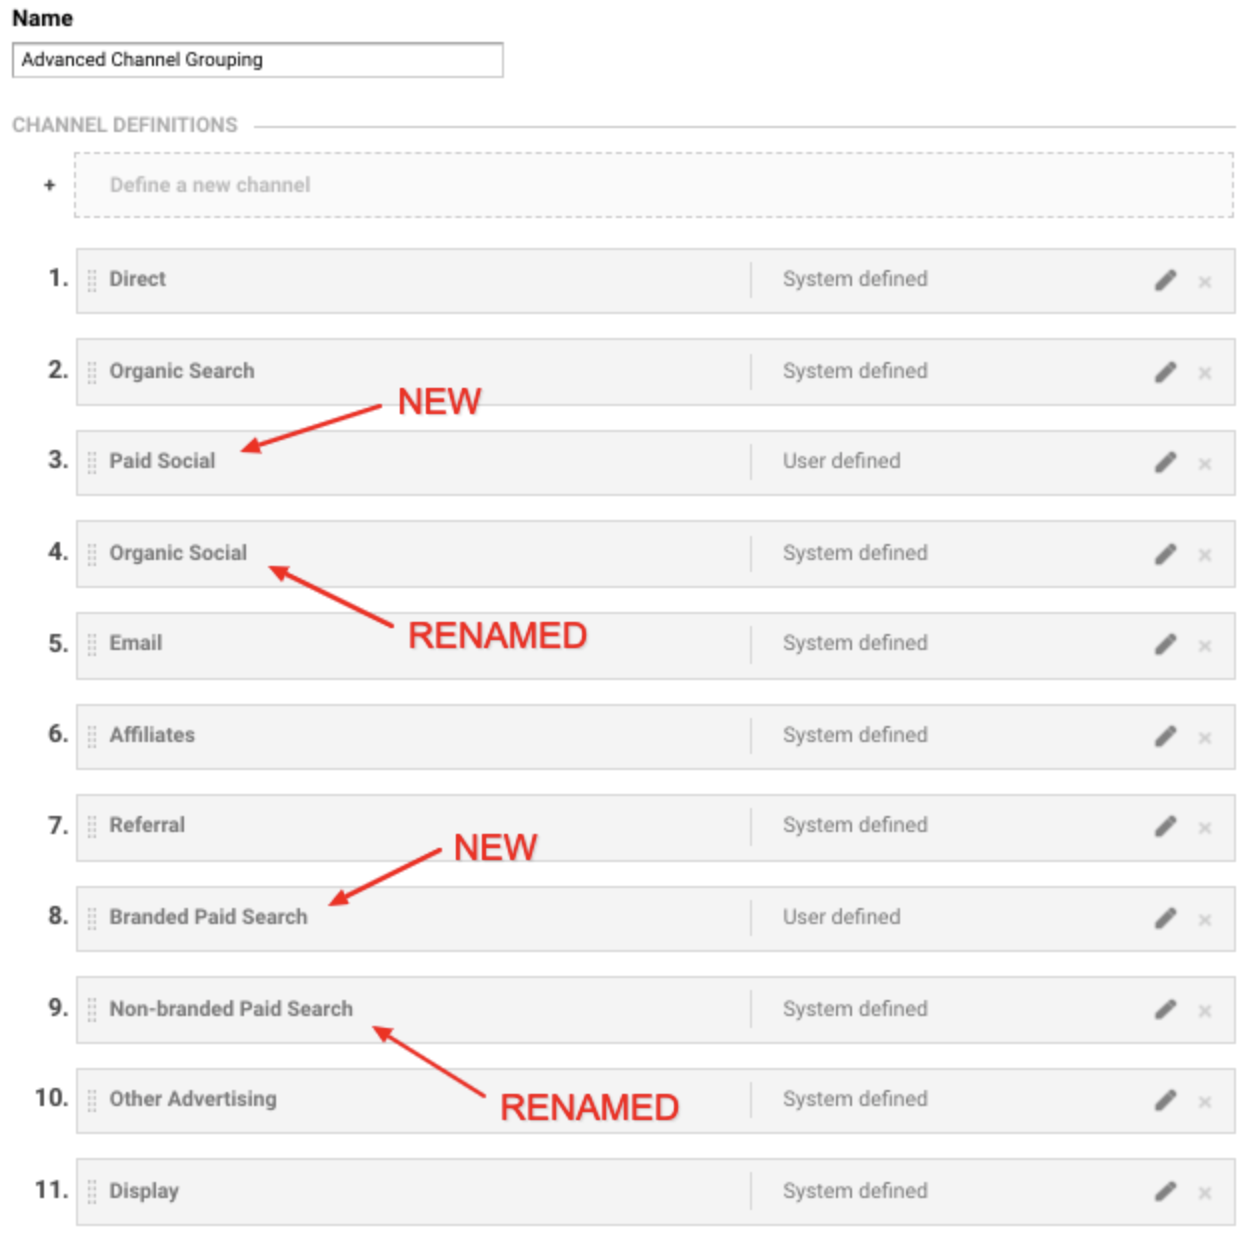
Voilá! You can now differentiate branded and non-branded paid search, and paid and organic social! If there are other channels that are an important part of your marketing and don’t exist in the default channel groupings, consider adding UTM codes to them as well, and creating associated channel definition(s).
Analytics Tutorial: Content Deep Dive
In this tutorial, we explore methods for analyzing a top content page - i.e. a page we are really interested in getting people to. The goal of this analysis will be to identify tactics for increasing engagement with the page. For this example, we will be looking at the contact page on the Two Octobers website.
If you are doing an analysis like this to share with colleagues, take screenshots as you go, and note down important metrics. Once you are done analyzing, you can go back and add a narrative to explain your findings.
Example 1 - where are visitors coming from?
In this step, we determine the sources of traffic that result in views of the content. This can tell us how to generate more overall views.
- Create a segment of people who have visited the page
- Click Add Segment > NEW SEGMENT
- Click on Conditions
- Set Page to exactly matches [your page] - the summary section to the right will show you if user sessions match this criteria
- Name the segment and save - I like to pick names that exactly describe the conditions, e.g. [your page] visitors
- Make sure the All Users segment is also applied
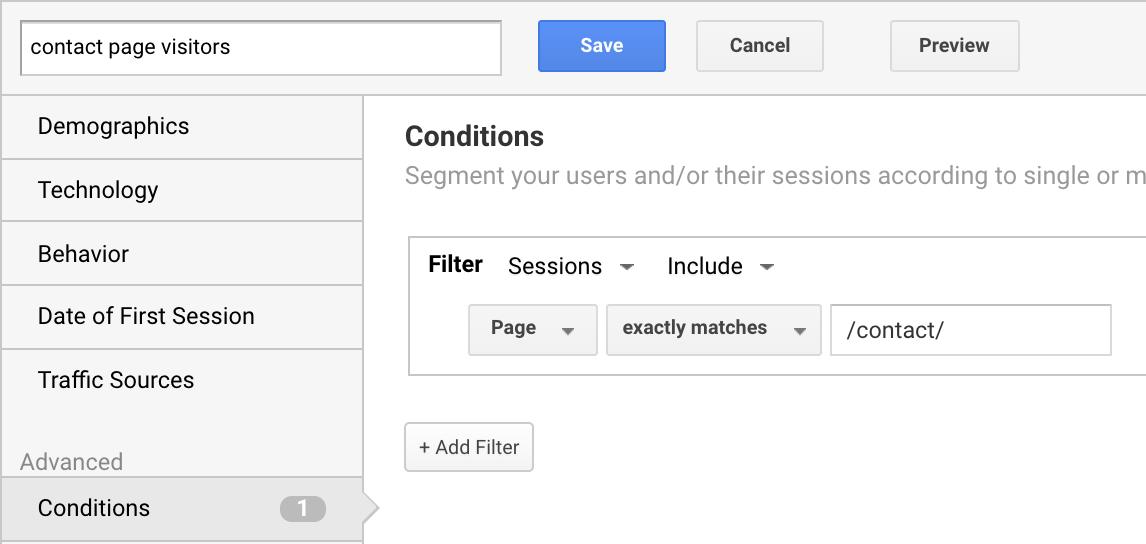
- Pick a longish date range (6 or 12 months), unless the page you are analyzing is new. More data is better for statistical significance.
- Look at the Acquisition > All Traffic > Source / Medium report - switch to Performance view - how do sources of traffic compare to overall traffic?
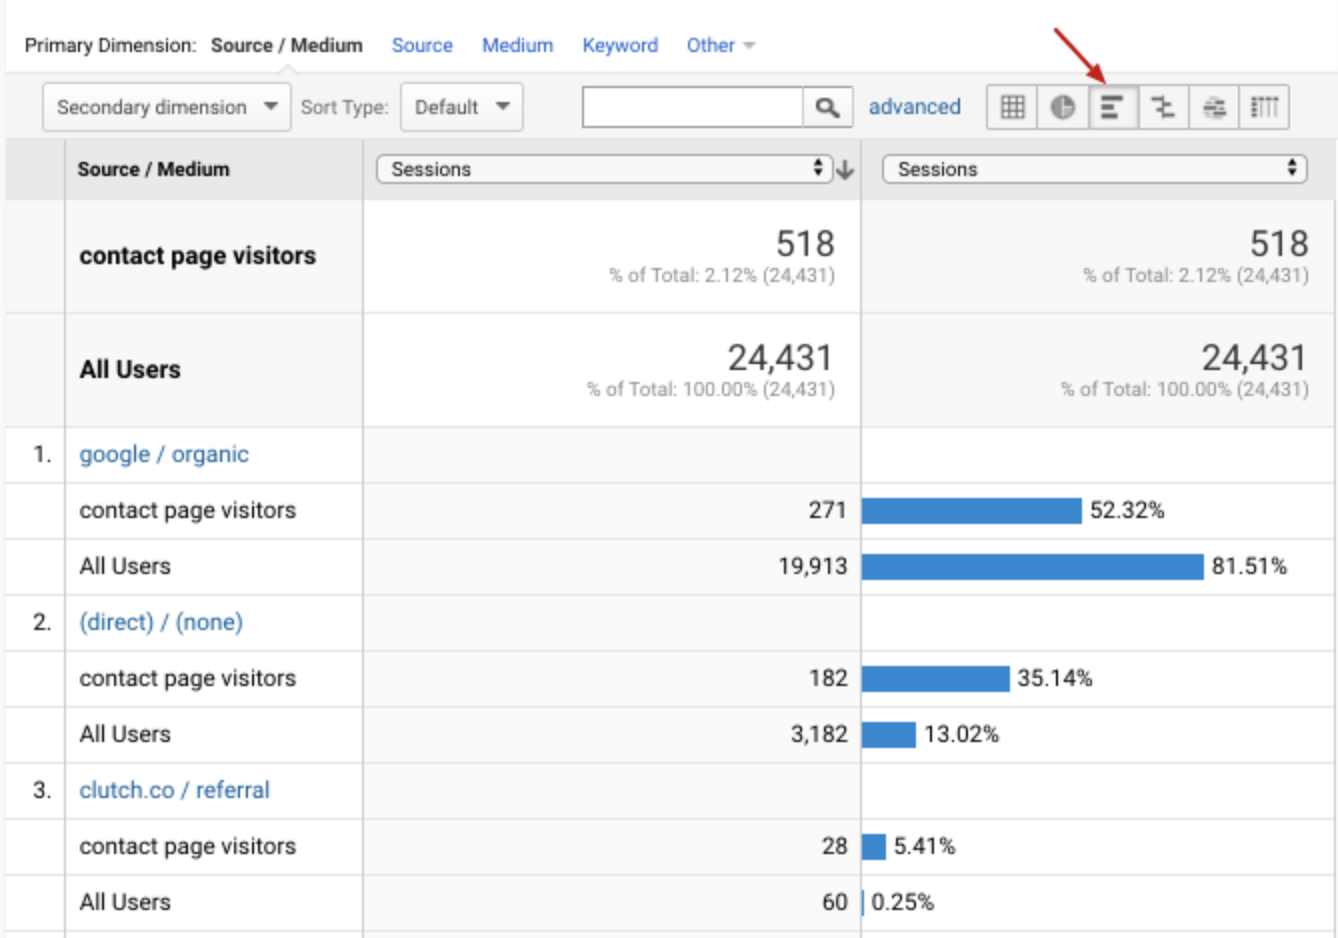
Takeaways from this data:
- While organic search drives a smaller percentage of contact page visitors than it does of overall traffic, it still accounts for more than half of contact page views.
- Clutch is a tiny percentage of overall traffic, but is the 3rd-highest source of traffic to the contact page. That is definitely worth further investigation!
Note that the segment above shows you all sessions that included a visit to the contact page, but did not necessarily start on that page. If you are interested in users that started their session on that page, change the segment to Landing Page starts with /contact/. In this case it is better to specify ‘starts with’ because external traffic often has tracking variables appended to the URL. The main risk of using ‘starts with’ instead of ‘exactly matches’ in all cases is that ‘starts with’ could match other pages such as /contact/thank-you.html.
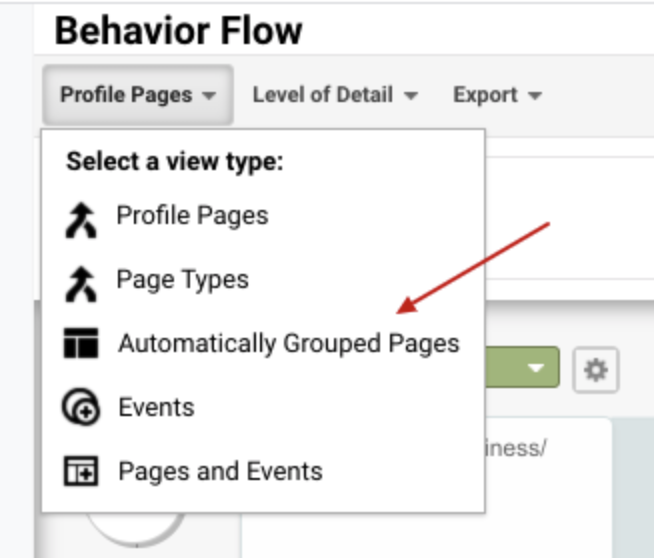
Example 2 - how are visitors getting to the page?
In this step, we look at how traffic is flowing through the site to get to the page.
- Go to the Behavior > Behavior Flow report.
- Change the view to Automatically Grouped Pages
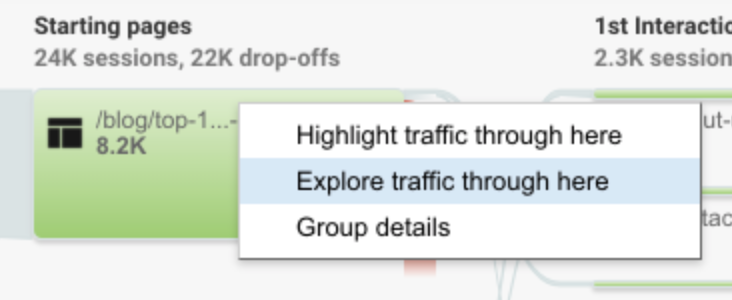
- Click on any green-highlighted page, and select Explore traffic through here. For some reason, this never seems to work the first time, so you may have to repeat this step to get it to work. When it works, you should see Step 0 in the middle of the screen.
- Click on the little pencil icon by Step 0. Then specify the page you are analyzing - in our case /contact/.
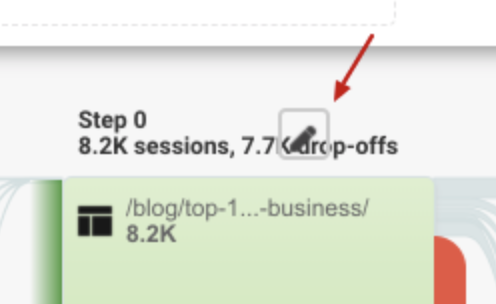
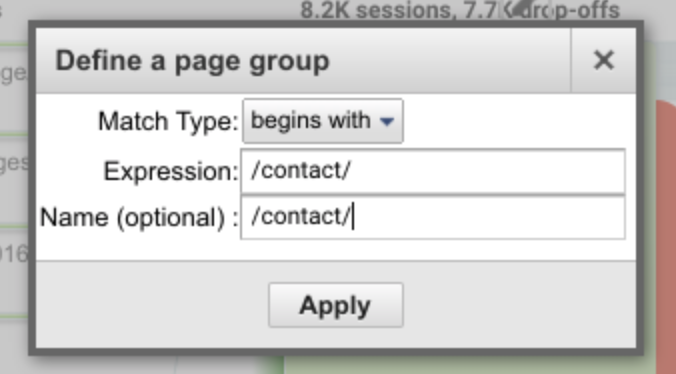
- The resulting view shows the pages visitors view before and after visiting the target page. You can add more before and after pages by clicking ‘+step’ to the left and right of the diagram. This report is very interactive. If you mouse over any page, you get additional detail, and you can drag the report around. Below is a view of what it looks like. The red text was added to show entrances and exits to the page - unfortunately you have to mouse over the report to see those metrics otherwise.
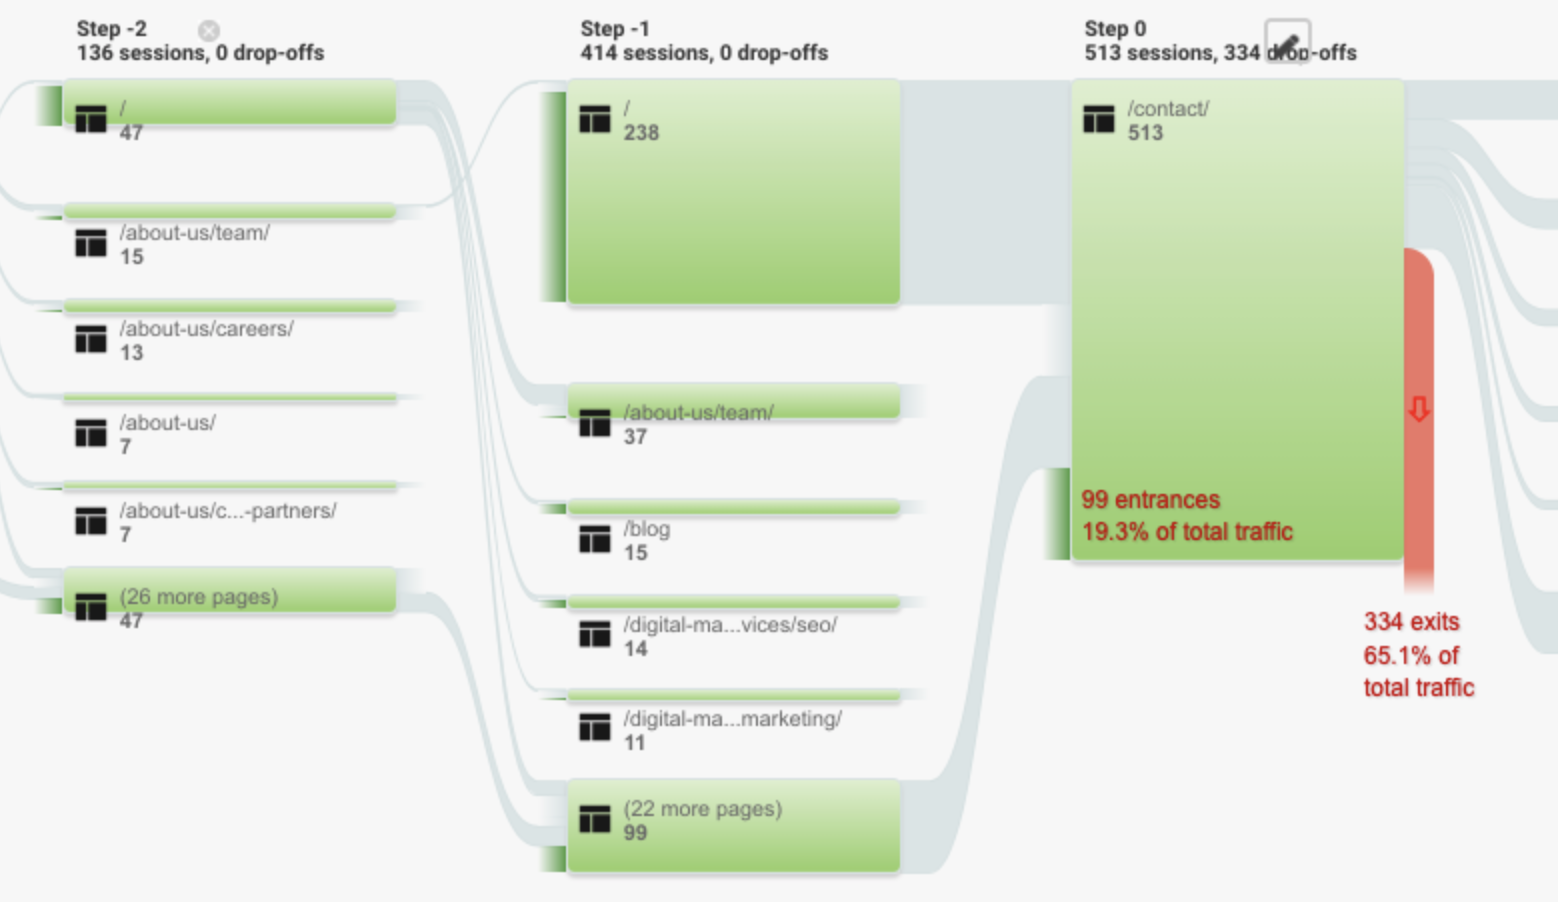
Things we can learn from this report:
- The paths visitors take to and from the page - this is helpful for getting a feeling for the intent of visitors to the page.
- The top referring pages. This tells us something about the intent of visitors when they get to the page.
- What’s missing? Are there pages on the site that are not driving traffic to the page and should be? If so, that can be an opportunity to provide more obvious links or calls-to-action on those pages.
Example 3 - how are visitors engaging with content?
In this example, we look at how visitors are engaging with the page - specifically, how many visitors are getting part way down the page and all of the way down the page.
- If you aren't using Google Tag Manager, you should be! In any case, setting up scroll tracking is much more tedious without it.
- Assuming you don't have scroll tracking set up already, follow the steps in Benjamin Mangold's fabulous post How to track scroll depth with Google Tag Manager
- I also recommend setting up an event to track zero-percent scrolls. This event is equivalent to a page view, but it will make your scroll tracking report more useful. To do this, in Tag Manager:
- Add a new Google Analytics tag.
- Set Track Type to Event.
- For Category, use the same event category as your other scroll tracking events, the category is just 'Scroll' if you followed Benjamin's post.
- Set the event action to 0%.
- Apply your Google Analytics settings variable. If you don't know what this means, go here.
- Set Non-interaction Hit to TRUE.
- Apply the All Pages trigger.
- Save and Publish!
- If you are just getting scroll tracking set up, you'll probably want to wait a week or two to accumulate data.
- Once you have some data, you are ready to analyze scroll depth! Benjamin Mangold also has a great webinar on this, but below is a cool report he doesn't cover:
- In Google Analytics, go to Behavior > Events > Pages.
- Set the report type to Pivot
- Set Pivot by to Event Action
- Set Pivot metrics to Unique Events
- Add an Advanced Filter to include only Event Actions that contain a percent symbol. For our purposes, we have also applied a filter to include the /contact/ page, but you don’t strictly need to do this.
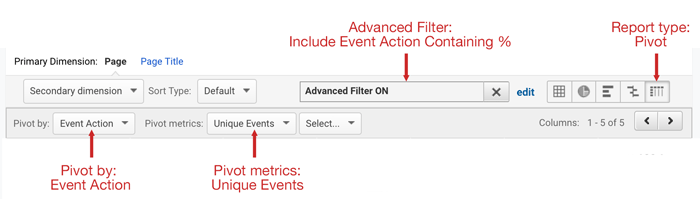
Voilá! If it all worked, your report should look something like this:

This shows the number of visitors to the page who scrolled 0% down the page, 25% down, etc. Note that if a visitor scrolled all the way down the page, they would be counted in all columns. In other words, to scroll 100%, a visitor first has to scroll 0%, 25%, 50%, and 75%.
You can also export this data to a spreadsheet to change these numbers to percentages of page visitors. This spreadsheet has a template for doing this. You will first need to make a copy of the page so you can edit it. Then export the results of this report and paste them to the ‘Scroll Percentage raw data’ tab. The percentage numbers will show up on the ‘Scroll Percentage report’ tab.

The diagram to the right was created in Photoshop, to visualize what these scroll percentages represent on the Contact page.
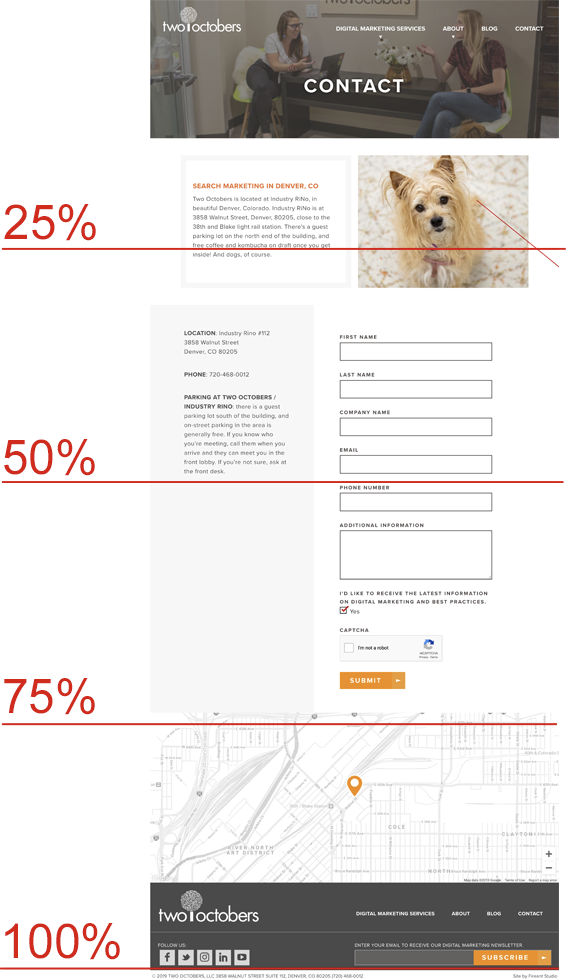
Takeaways from this data:
- Nearly half of people who visit this page get to the bottom of the form, which is not bad. Presumably many find what they are looking for when they see the location of the business, which is above the 25% line.
- We do lose about a third of people before the form, so it would be worth testing different calls to action at the top of the page to see if we can improve that number.
Recommendations for next steps:
- Lucky Orange and Hot Jar are tools that provide detailed heatmap data of page interactions, and can be very helpful for understanding where and why people are dropping off.
- Google Optimize is a free tool that integrates with Google Analytics and enables A/B testing of page modifications.
8. Analysis Versus Observation
Google Analytics is a tool. By itself, it does a great job of presenting the data it collects. Without humans, that’s pretty much all it is, a tool for reporting on web analytics data. That’s where you come in.
Let’s say your boss asks you how important mobile visitors are to the business. She was just at a conference, and sat in a session where the presenter mentioned that most consumer-business interactions happen on a mobile device. She came back all fired up, ready to invest in the business’s mobile presence. You have been asked to provide the information and insights the business can use to guide that investment.
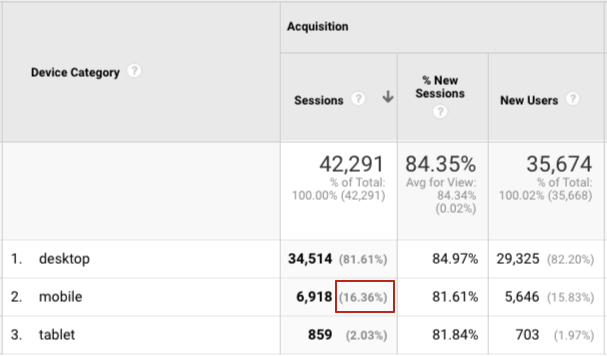
What people often do in this circumstance is to find a report, and send it to their boss. For example, to the right is the GA Audience > Mobile > Overview report. You could send this along and say, “I don’t think we should be too concerned, only 16% of our visitors are mobile.”
Wrong. With that answer, all you are doing is passing along what GA reports, with no context or critical thinking. Examples of context are:
- “16% of our traffic is mobile YTD, compared to 11% last year.”
- “I found industry statistics that indicate that a business in our vertical should expect 60% of their traffic to come from mobile.”
And critical thinking is looking for and exploring the causes that might influence a metric to go up or down. For example:
- “I noticed that our bounce rate on mobile is 56%, compared to 28% on desktop. This indicates that our user experience on mobile may need improvement, which would affect mobile traffic numbers.”
- “Comparing traffic by channel for mobile versus desktop, we get a comparable amount of direct traffic, but desktop significantly outperforms mobile on organic search. I’m looking into how we rank for keywords on mobile versus desktop to see if we have a problem.”
Notice how critical thinking led to more questions? This is pretty typical, and one of the fun parts of being an analyst. Good insights are rarely floating on the surface. In this module, we talk about some of the techniques for going deeper in GA.
Note also that, as an analyst, your job is to provide data and insights, not to make decisions on behalf of your boss or client. It is normal and constructive to make recommendations, but leave it at that. For example, saying “you need to improve page load speed” is not constructive, and ignores the fact that your audience may not have the resources or budget to do so. Instead, say something like “improving page load speed will increase the likelihood that website visitors stay on site and convert to customers.”

Be Your Own Worst Critic
There’s a saying among self-helpers and business cognoscenti, “visualize success”. That may be good advice if you are trying to master the violin or hit a sales goal, but it is bad advice for an analyst. Instead, you should try to visualize failure. Success, for you, means gaining the confidence of business stakeholders. You gain confidence by presenting insights that are supported by data. You lose confidence by basing your insights on incorrect or incomplete information. The second is a lot easier to do. A good analyst has an eagle eye for spotting and correcting the flaws in their own work before they present it to their audience. Below are examples of a few common mistakes.

You Are a Blind Person Describing an Elephant
In the classic parable, each man describes the elephant in terms of what he experiences. For example, the man who felt the trunk describes the elephant like a snake, while the man who felt the leg describes it like a tree.
When analyzing data about website visitors or marketing campaigns, you are never getting a complete picture. For example, television exposure could increase interest in a business and result in a traffic surge that has nothing to do with digital marketing. Or multiple people might be involved in a purchase decision, but you have no way of seeing connections between visitors.
To the extent that you can, try to understand and gauge the impact of what you can’t measure. Just including this as a caveat will increase your credibility, and may lead to useful insights and suggestions. Here’s an example:
You are running a search campaign for a destination hotel in Vail, and you are promoting the hotel as a conference venue. You can reasonably expect that a prospect won’t make a decision after a single visit. In fact, it is more likely that the person doing the initial research will not be the person to make the final purchase decision. In addition, conference guests are likely to book their own rooms. You explain how this means that you cannot accurately attribute conversions to marketing channels, and instead report on the overall change in conversions when your campaign is running. You also report on keywords and clicks as the concrete result of your campaign.
Look Beyond the Data
Every dimension you report on represents something real. In most cases, you are only a click or search away from seeing the thing behind the dimension in the wild. Here are some of the real things that often get ignored by lazy analysts:
- Referring websites
- Ads
- Landing pages
- Mobile user experience
- Social media activity
- Organic search listings
Each one of these things is easy to see for yourself. Making the extra effort helps you to understand what the numbers really mean and can lead to additional insight and questions. Here’s an example of what can happen when you don’t make the effort:
You are analyzing the performance of an ad campaign, and notice that visitors from the campaign have a very high bounce rate compared to other campaigns. You mention this in your analysis and suggest that the traffic quality from this campaign may be low. Then, your stakeholder points out that the call to action on the landing page is a phone number, and there is no navigation to other pages. As a result, the bounce rate is high. Further, call volume from the page is excellent. Oops. If you had taken the time to look at the landing page, this could have been easily avoided.
Without Context, a Statistic is Meaningless
This harkens back to the example above, “28% of our visitors are mobile”. By itself, this tells me nothing. As a business person, I want to know how that compares to last year. I also want to know how that compares to my industry as a whole. Below are some tips for how to dig deeper into a number like this, but start by giving a basis for comparison.
If you are pointing out that a statistic is positive or negative, look for industry data to compare it to. If you are discussing the impact of external or internal changes, provide trend data over time. It’s often helpful to do both.
Opinions are Like …
It is very tempting to make a value judgement when providing recommendations, e.g. “fluorescent green buttons on a yellow background will make your visitors eyes bleed.” The problem is, most likely you are not a recognized expert in user experience nor in other topics pertinent to your analysis. It is also very possible that your audience has different opinions than you. The good news is that millions of experts are a Google search away. Try searching “color contrast buttons”, and you will find a plethora of resources to help inform your perspective and add credibility to your recommendations. Doesn’t the following sound better than the statement above?
“The lack of color contrast on your call-to-action buttons may be having an impact on conversion rates. See this W3C article for best-practice recommendations: Colors with Good Contrast.”
Segments, Secondary Dimensions, and Custom Reports
Segments
Segments provide a way to segment traffic in report, typically so that you can compare one segment of traffic to another. For example, there are pre-built segments for mobile and tablet traffic, which you can apply to see how behavior differs between these devices. There are a number of other pre-built segments, but for my question I am going to create custom segments.
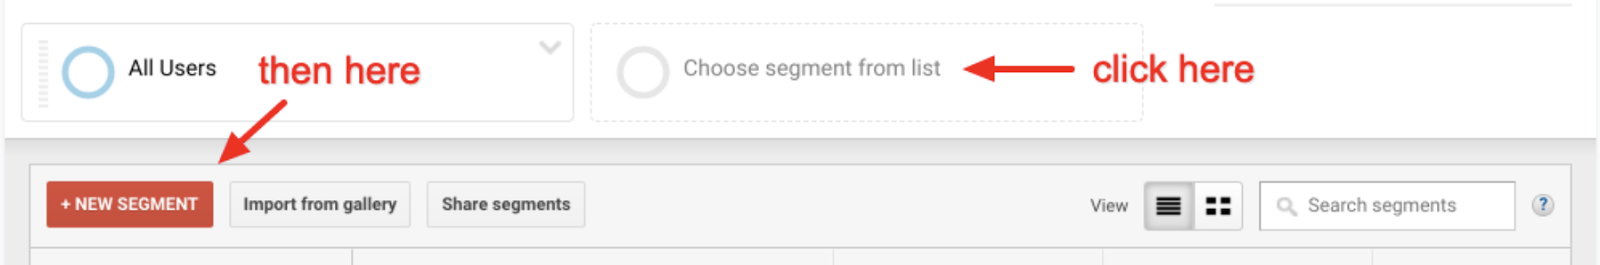
I’m going to create two segments, one for users under 35, called “younger users”, and one for users 35 and older, called “older users”. One thing to note: on the right hand side you can see how many users are in your segment. If you create these two segments, you’ll find that they do not add up to 100% of users. This is because Google infers age from behavioral characteristics, and is only able to do so for a subset of visitors.

With these segments applied, I can now compare behavioral metrics. Below is the summary bar of the Acquisition > All Traffic > Source / Medium report:

This data is for the month of July. Many of the behavioral characteristics seem similar, but there is a striking difference between conversion rates. 8 conversions is not much data, but if I increase the date range to May through July, the conversion rates stay at about the same ratio.
Secondary Dimensions
Secondary dimensions can be applied to any report, and are a great way to explore factors that may help you understand your question. At this point, I am wondering why the conversion rates are so different between younger and older visitors. Mobile device usage often influences conversion rate, and there tend to be differences between age groups and device usage, so I apply Device Category as a secondary dimension and look at the top conversion-driving Source / Mediums:
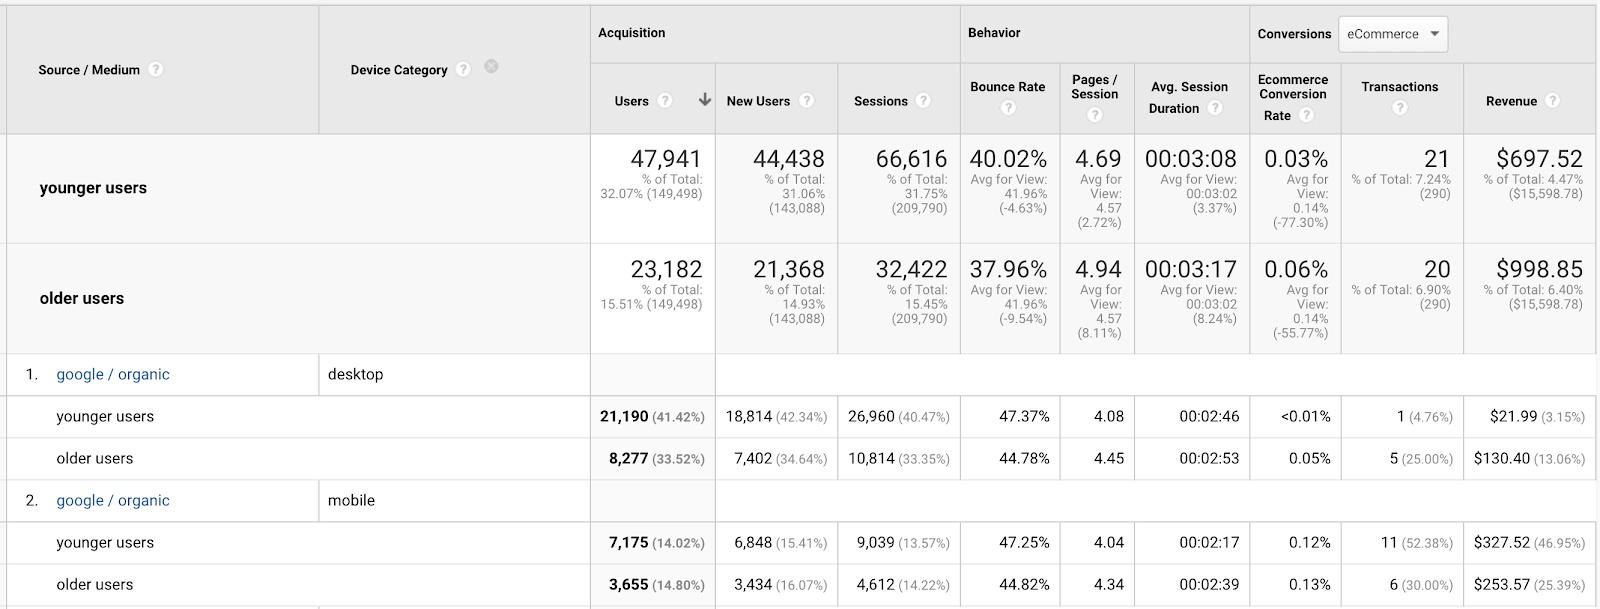
This is unusual. Typically, mobile device visitors convert at a lower rate. In this case, younger mobile visitors convert at about the same rate as older visitors, but the conversion rate for desktop visitors is markedly lower. This is true for other Source / Mediums as well.
Knowing that this is the Google Merchandise Store, I wonder if the difference is because employees shop at the store…
Custom Reports
To explore this further, I create a custom report. In it, I select the Flat Table report type - the ability to do this is one of the most powerful features of Custom Reports. I include age, device category and city in the report.
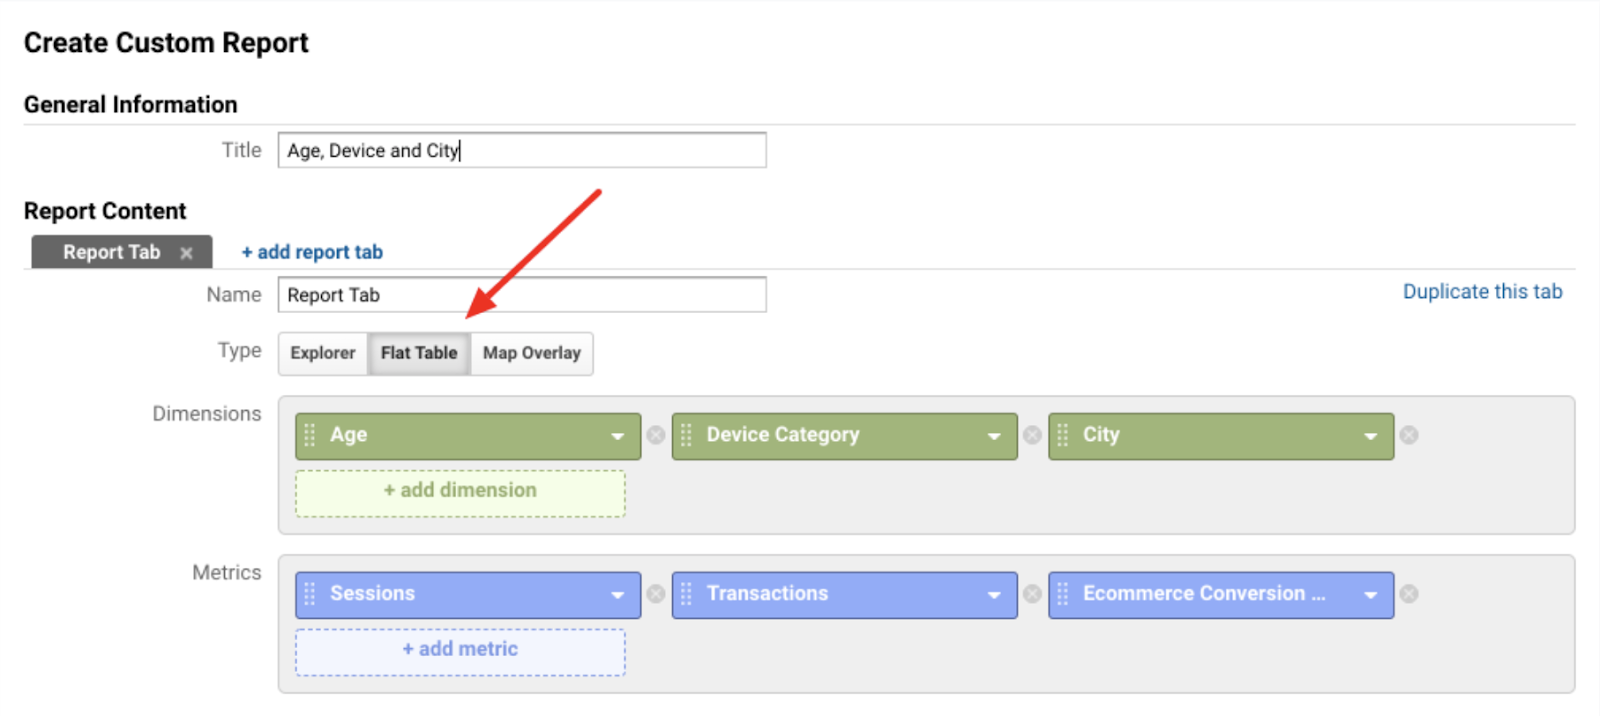
From here, I can build a dataset with the dimensions I need to compare behavior between people who live near Google campuses, versus people who don’t, to see if younger people are more likely to be employees, and correspondingly less likely to purchase.
Going Past the First Layer of Data
If you find something interesting as you investigate, explore more. There can be real gems hidden a few layers in. For example, you might start with an insight that women convert at a higher rate than men, then find that men 35-44 outperform women, then find that men 35-44 from urban areas outperform even more. Following are some tips for exploration.
- Dig deeper into outliers. For example, if you find a referrer with strong engagement metrics, is it a one-time phenomenon, or consistent over time?
- If you identify a performance outlier, make it a segment and browse through reports, and look for additional dimensions that have a compounding impact.
- Apply segments to compare subsets of data, e.g. how does California traffic compare to Colorado?
- Compare date ranges to look for YoY or seasonal trends. When specifying a date range for reports, there is a comparison checkbox just below the date range fields.
- Change date ranges to year-long or multi-year views. Some trends are hard to spot when the time period is too short.
- Show more than 10 rows of data. By default, reports in GA only show 10 rows, but it is easy to expand this to more rows by selecting the ‘Show rows’ dropdown at the bottom of reports. 10 rows are rarely enough.
- If you are proficient in Excel or Google Sheets, export data from a report, and play with it there. There is an export drop down displayed at the top of every report page. Note that it will export the number of rows that are displayed, so you will typically want to show more rows before exporting, so you have a bit more data to play with.
- Play around with different types of data display. Performance, Comparison and Pivot tables can reveal trends that are hard to spot in a regular table view.
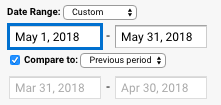

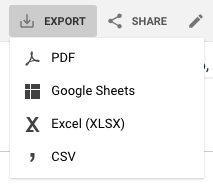
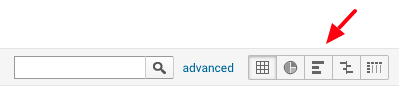
9. The Virtuous Cycle
Get Digital Analytics Working in Service of Your Business and Mission
In most organizations, analytics data exists at the periphery. Some metrics may trickle up to top leadership, but there often isn’t much confidence in those metrics, nor sometimes comprehension of what they represent. In cases like these, the flow of information tends to be one-directional. People who could be benefiting from the insights aren’t communicating back to the people responsible for collecting and analyzing data.
It is also often true that data comes from disparate, external vendors such as agency partners and ad networks. A “conversion” may mean one thing to one vendor, and something different to another. And each vendor will tend to make decisions on how to configure and present data in their favor.
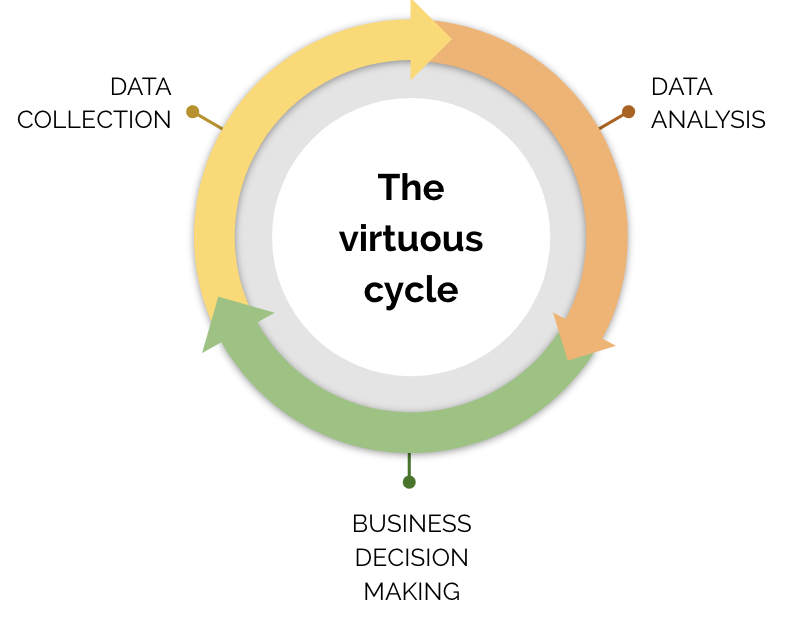
There are two main aspects to overcoming these issues:
- Create a virtuous cycle where the people making business decisions are providing feedback on what is being tracked and reported, thereby continuously improving data flow through the organization.
- You have to own your own data - don’t let vendors tell you how marketing is performing - you provide the single source of truth.
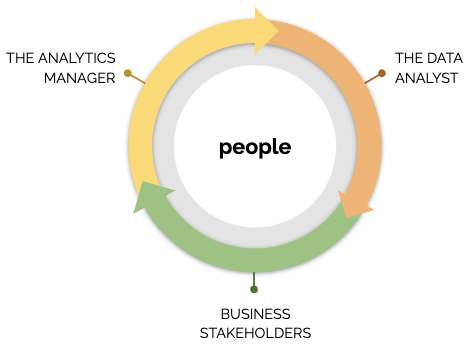
The Ingredients: People and Tools
People
The analytics manager: the characteristics of a person who can get Google Analytics, Data Studio and Tag Manager set up correctly (and do maintenance):
- detail-oriented - a bit of a perfectionist, really - small mistakes can have big consequences
- programmer brain - doesn’t need to be a true programmer, but there’s lots of technical stuff to figure out and troubleshoot
- problem solver - like the I-won’t-let-go-of-this-until-I-figure-it-out type of problem solver.
The data analyst: the characteristics of a person who can make data useful and meaningful to the organization:
- a good synthesizer - able to look past the noise and identify trends and relationships that matter
- business-savvy - understands what drives the business
- good communication skills - visual, written and verbal
Those sound like two different people, right? In many organizations, one person plays both roles, but it’s rare to find all of these qualities in the same person.
Tools
Data collection:
- Google Analytics
- Google Tag Manager
- If you have a lot of data, an API aggregator such as Supermetrics - this can pull data automatically from sources such as Facebook, Pinterest, YouTube, and dozens of other platforms and networks.
- Also possibly a data connector such as Zapier, Integromat or Google Cloud DataFlow
Data analysis and presentation:
- Google Analytics
- A data analysis and dashboarding tool such as Data Studio, Power BI or Tableau
- If you have a lot of data, a cloud DB such as Snowflake or Bigquery
For the most part, organizations have access to the right tools, even if they are not using them properly. It is usually the lack of the right people with the right training and resources that prevents businesses from achieving the virtuous cycle.
Resources
These are a few of my favorite resources for learning more about GA:
- Occam’s Razor – a blog by GA supergenius, Avinash Kaushik. In particular, check out the Impact Matrix, a brilliant framework for identifying strategic metrics.
- Google Analytics Academy - straight from the horse’s mouth.
- Loves Data - Benjamin Mangold produces very accessible how-to videos on Analytics and related topics. He also has a great blog.
- Simo Ahava - Google Tag Manager geek-fest.
Analytics for People - Nico Brooks - Copyright 2021 Two Octobers LLC - Page
[1] This is true of versions of the Google Analytics tag released since 2013. Prior to that, the default was the full domain name on which the tag resided. There are still websites out there using such legacy tags.
[2] Digital Trends 2016: Consumer Usage, Ad Revenue and Impact, IAB,
[3] Less than Half of Google Searches Now Result in a Click, Rand Fishkin, Sparktoro
[4] https://moz.com/learn/seo/page-speed
[5] https://www.thinkwithgoogle.com/consumer-insights/mobile-search-trends-consumers-to-stores/