
BONFIRE INDICATOR FOR FINDING PIVOTS, FRACTALS, SUPPORTS, RESISTANCE, TRENDS, VELOCITY, GEO-CHARTING, GANN AND MUCH MORE. BONFIRE WORKS GREAT ON CRYPTOCURRENCY AND STOCKS ALIKE. BONFIRE IS A PREDICTION TOOL LIKE NO OTHER. |
Introduction
In the current financial climate, it is of the utmost importance to keep your capital safe whilst trading, or you may risk getting #REKT. The Bonfire indicator by CaptBlackBeard on TradingView.com is one of the most valuable indicators in today’s toolboxes for traders as it enables the trader to have insight into the anticipated next move of the asset in trading intervals of choice. It is saving a lot of charting time thereby granting the modern trader more time to focus on what really matters. Time intervals from 1 minute to 4 hours is preferred.
Indicator
Indicator components:
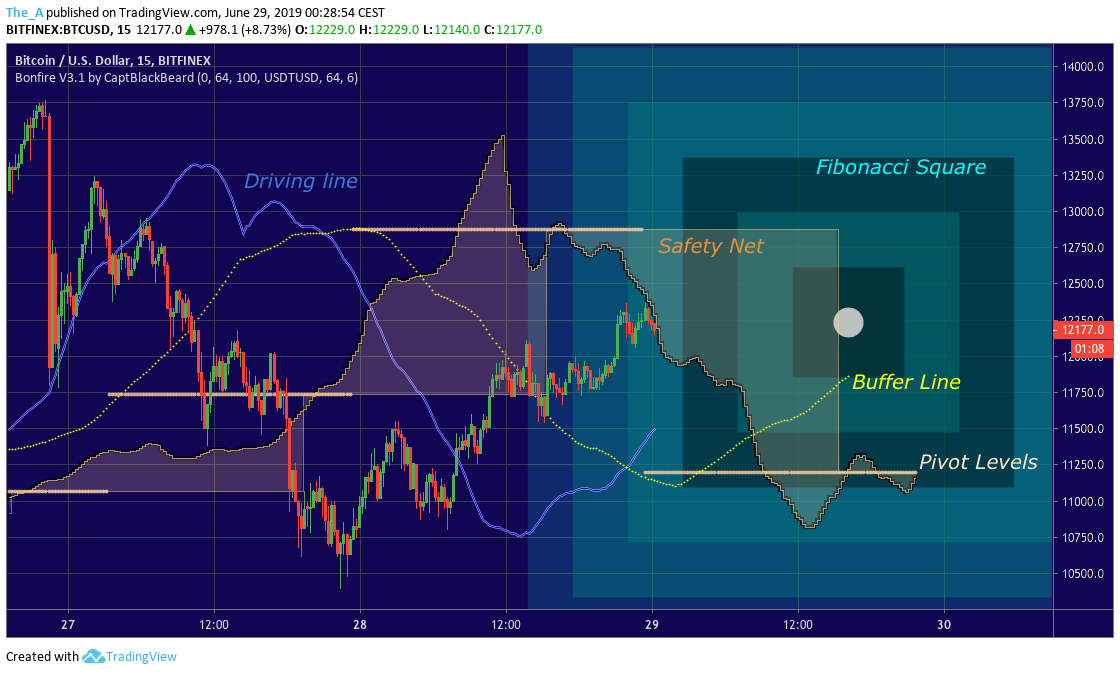
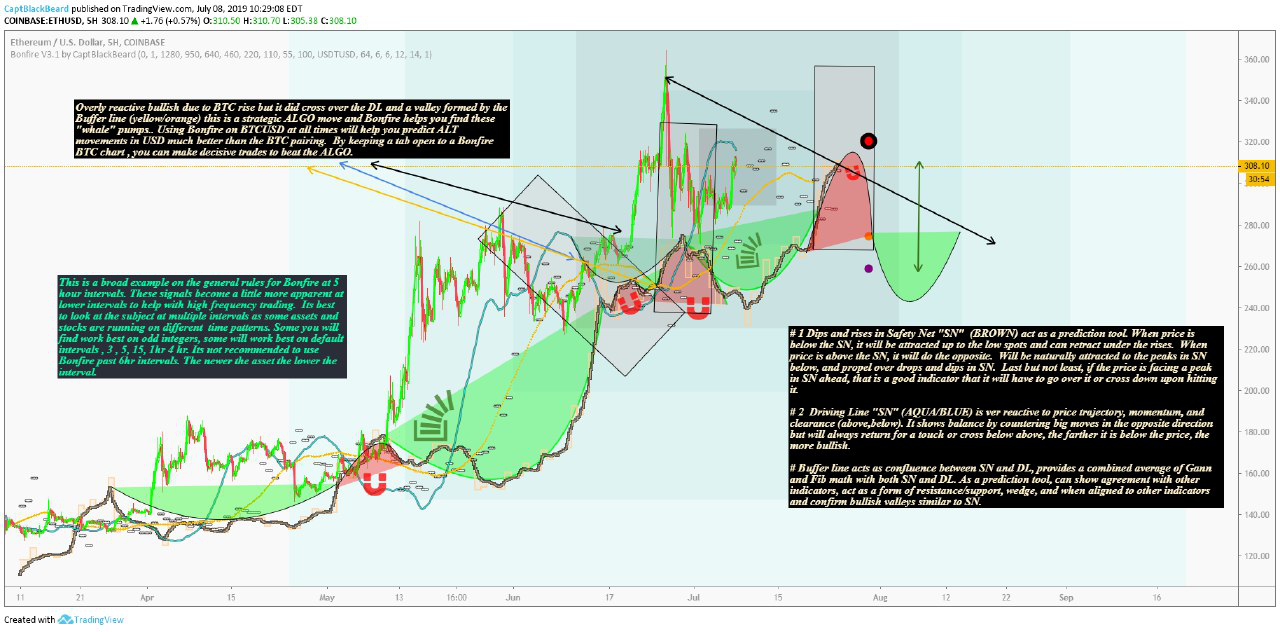
1. Safety Net (SN) – Brown Shaded area with peaks and valleys
- Upon price crossing above the safety net area price gains upward momentum
- Price is drawn to the low points in the advanced indicators. It will cross the brown cloud area easiest on the thinnest portion of the cloud. In a downward trend price is attracted to the wedges on the safety net area below it.
- Depending on what interval you are on, the price will move toward the dips if under the brown cloud / safety net and try to break through. Also you will see the price build up behind it and build pressure.
- The highest and lowest points on the safety net acts as potential pivots; Valleys are a potential down trend and Peaks a potential upward trend.
- Dipping onto the flat side of the Safety net could act as support and possible bounce expected pending the momentum.
2. Driving Line – Blue line
- This line counters momentum, so if the price goes up it will dip, if the price is about to go down it will rise, therefore the more clearance price gains above the driving line the better.
- The driving line directs the price from the opposite side it wants it to go; what can really propel a coin is a high driving line that drops from above and gets in sync with a wedge for a double cross up.
- If the driving line is really high over the price, and coin is at the bottom of a drop, chances are good it will rejoin by a rising price.
- In an uptrend if the driving line starts pointing upward the pump is losing momentum.
- The driving line can also act as a support or a resistance line when close to the price action.
5. Buffer Line – Yellow line
- The future Buffer line is very much indicative of the forward price curve.
- If the buffer line moves downward away from the price it may create momentum for an upward trend.
- When the driving line crosses up over the buffer line it may be a signal of a bullish trend. The price crossing up over the buffer line is also positive.
- When the driving line crosses downward over the buffer line it can be Bullish or Bearish or sideways action, depending on the momentum and angle at cross.
- The Buffer line can also act as a support or a resistance line when close to the price action.
- In a serious uptrend, the buffer line can be used to judge the level to which price correction will take place.
4. Fibonacci squares – Teal shaded areas
- Levels Price is likely to bump or retrace to.
- Assisting with charting.
- When sized correctly edges act as future pivot lines.
6. Pivot levels - Beige thick lines
- Price vibration levels
- Assists setting targets for swing trades
S.O.S
- When price goes below the Safety net and the driving line and the buffer line and do not bounce on the pivot levels, SELL!!!! It is going to drop fast and far below!
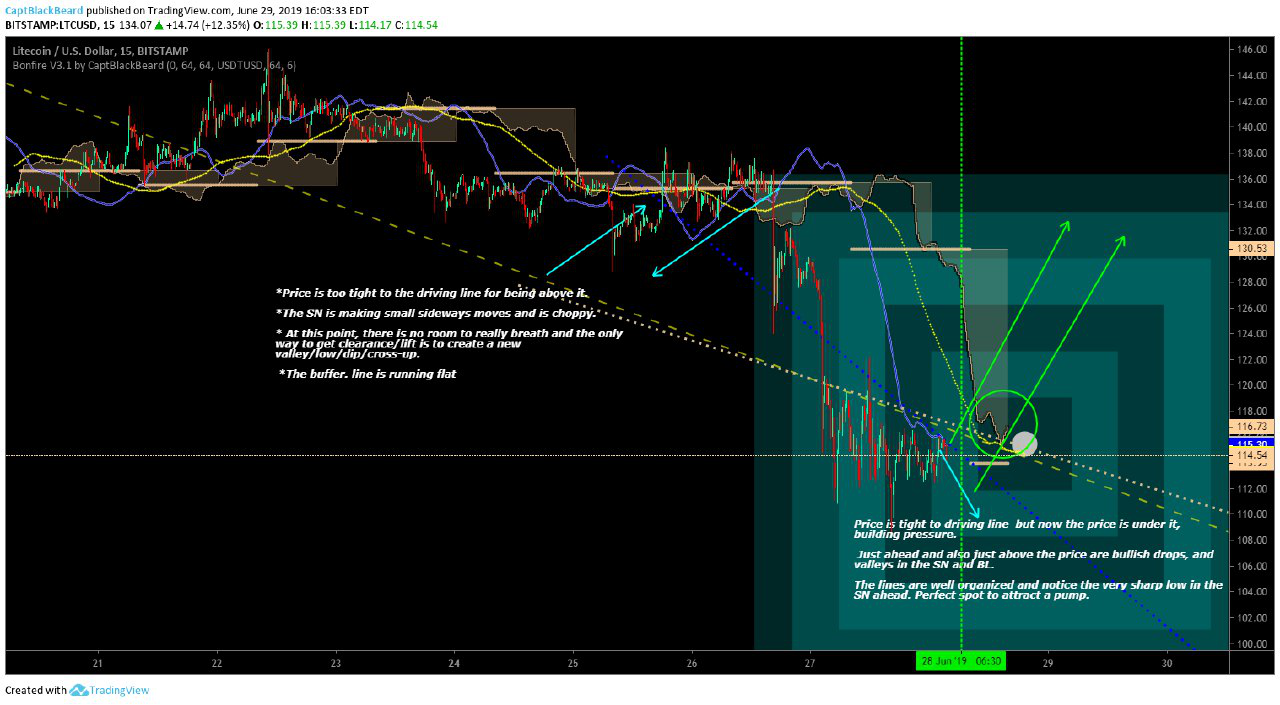
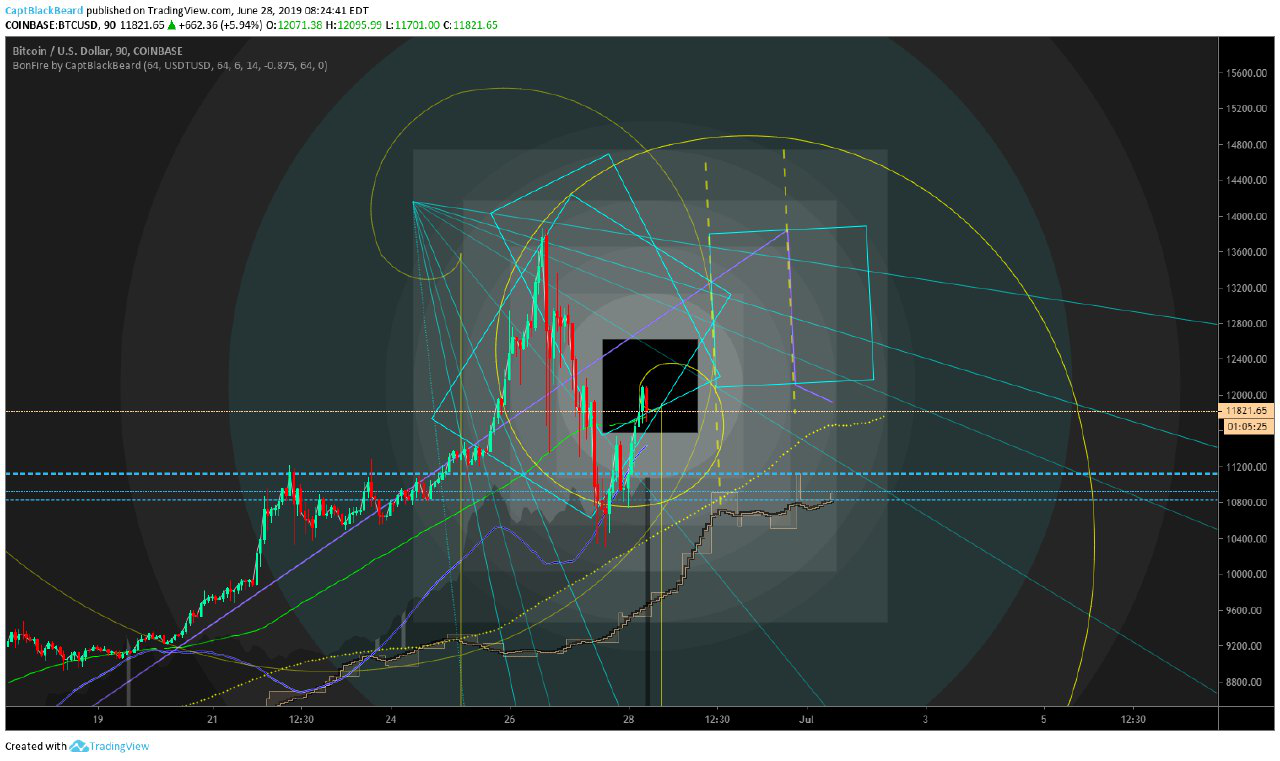
Example 1
Before:
After:
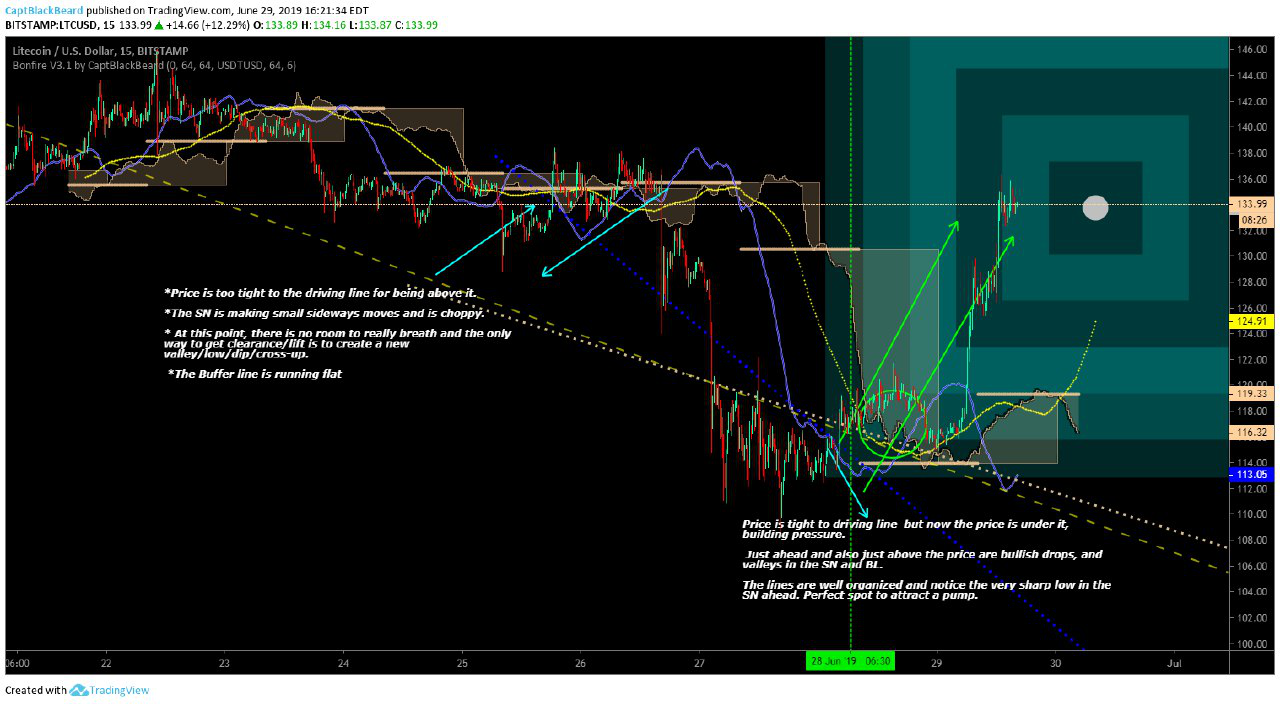
Example 2
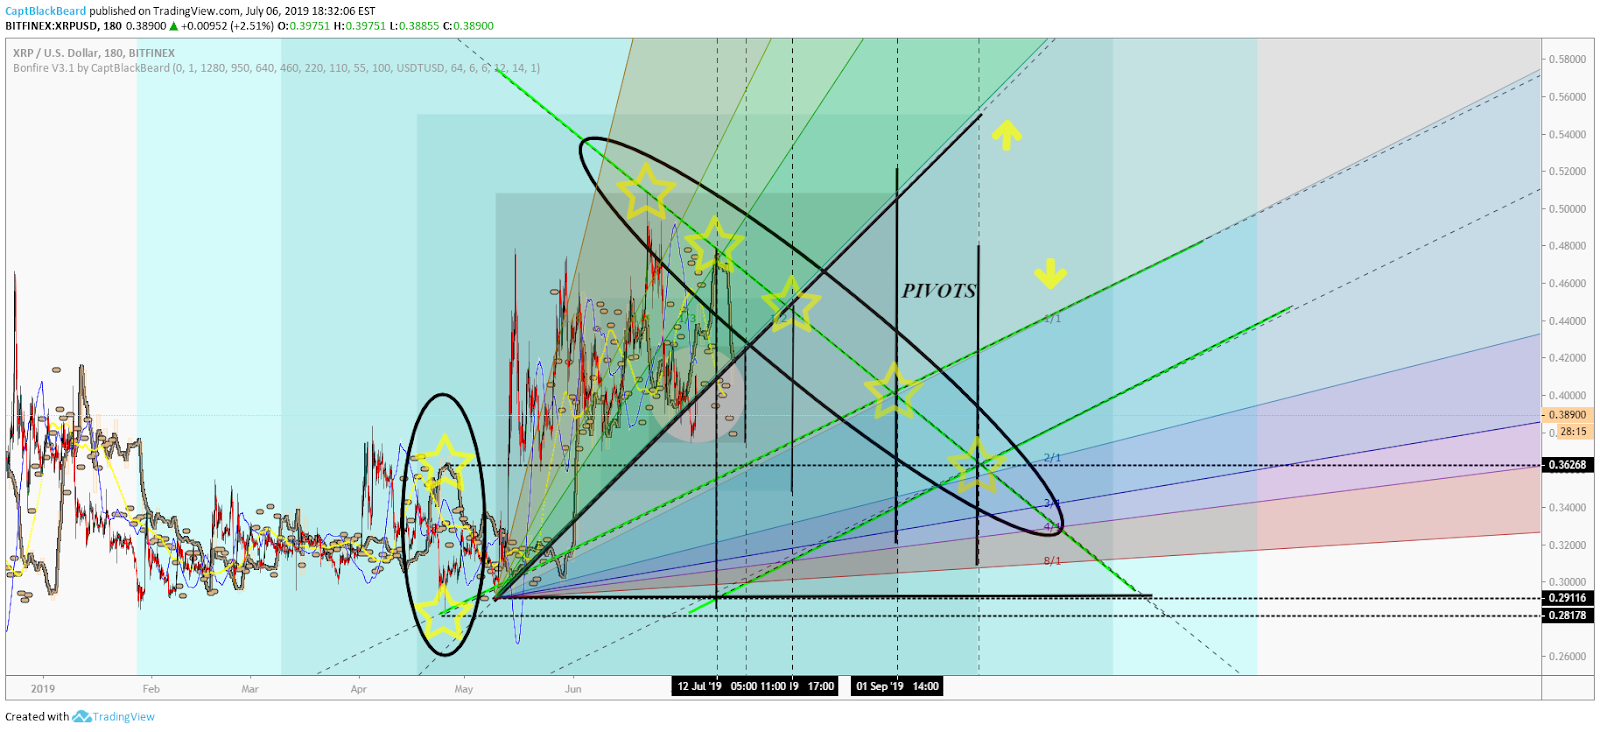
Geometric Charting with Bonfire
Bonfire also assists greatly with Geometric charting. Examples below of application.
Videos:
- Showing-how-natural-and-Gann-Bonfire-is/
- Total-Market-excluding-BTC-Detailed-Bonfire-squaring-scaling/
- Geo-Gann-Bonfire/
- Square Made Easy
- SIMPLE-USE-OF-BONFIRE-FOR-GANN-AND-PIVOTS/
More examples thereof available at https://www.tradingview.com/u/CaptBlackBeard/
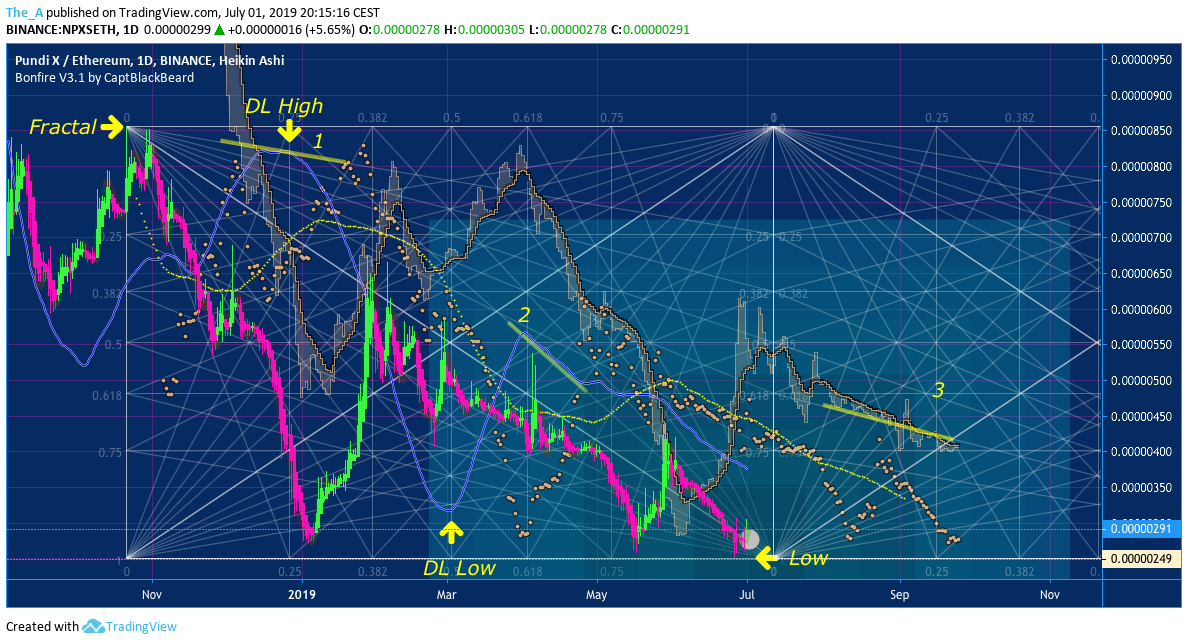
Gann Boxes made easy with Bonfire
Bonfire also assists greatly with placing Gann boxes correctly:
Method:
- Use default Gann Fibonacci ratio and tick angles.
- Align Driving Line with top and bottom wedges of the Gann Box.
- Start Gann Box at a top/bottom fractal and align opposite edge with high/low.
- Look for box alignment on 3 places with either the Driving Line or the Safety Net
- Clone for future forecast
Example:
Access Bonfire on TradingView.com for 12 months = $75.00 or $9.99 per month via PayPal subscription available at https://www.coinpirate.net/bonfire
Queries: Telegram link: https://t.me/Thea_7
Crypto also accepted instead of Paypal: Equivalent BTC or ETH
Bonfire Versions -
Bonfire V3.3 with Geo - Light-mode
BonFire v3.1 with geo by CaptBlackBeard