IT 7993 Capstone Milestone 2 ReportOctober 4, 2020


Table of Contents
Executive Summary 3
Project Plan 3
Overview 3
Project Team 4
Project website 4
Final Deliverables 4
Milestones 5
Future milestone meetings date/time 6
Communication and Meeting Planning 6
Project Schedule and Tasks Planning 6
Requirements – Milestone 1 Work Products 8
Data Sources 8
COVID-19 Cases Data Shaping and Cleanup 8
Twitter Data Collection 9
Facebook Data Collection 9
Social Media Data Shaping and Cleanup 11
Data Shaping Specifications 11
Requirements – Milestone 2 Work Products 12
Data Analysis Minimum Viable Product 12
Descriptive Statistics 12
Time Series Analysis 12
Regression Model 12
Topic Modeling 12
Stretch Goal: Topic Modeling Using Latent Dirichlet Allocation (LDA) in Python 13
Requirements – Milestone 3 Work Products 14
Project Progress Report 14
Milestone 2 Goals 14
Accomplishments 14
Feedback from Milestone 2 Meeting 27
Next Steps 27
Supporting Documents 28
Figure 1 Gantt Chart as of 09/27/2020 7
Figure 2 Example Facebook Post indicating fields to be captured 10
Figure 3 Facebook Collection Template 10
Figure 4 Criteria for Keyword Frequency Counts 13
Figure 5 Gensim vs Mallet LDA implementation - Mallet Model code snippet 15
Figure 6 Gensim vs Mallet LDA implementation - Built-in Gensim and Coherence Score comparison 16
Figure 7 Topic Number Selection 17
Figure 8 Topic Modeling Scripts in MS Teams 18
Figure 9 Combined Facebook and Twitter Posts with LDA Topic Distribution 19
Figure 10 Analysis Report location in MS Teams 20
Figure 11 Data Analysis Summary - Part I 21
Figure 12 Data Analysis Summary - Part II 21
Figure 13 Data Analysis Summary - Part III 22
Figure 14 Data Analysis Summary - Part IV 22
Figure 15 New Infections Time Series Annotated 23
Figure 16 Events vs Messages and Case Trends – May 23
Figure 17 Events vs Messages and Case trends - July 24
Figure 18 Facebook Descriptives - Shares, Likes and Comments 24
Figure 19 LDA Topics Correlation Table 25
Figure 20Milestone 2 Work Products 26
Figure 21 Milestone 2 Supporting Documents in MS Teams 28
Analyzing Risk Communication and Behavioral Change During COVID-19 Pandemic – Milestone 2 Report
Executive Summary
This report includes and extends the Project Plan submitted for Milestone 1, adding guidelines for the development of Power BI visualizations to be executed for Milestone 3.
At the conclusion of Phase 2 (Milestone 2), Social Media data from Twitter and Facebook categorized by Topic and Keyword frequency. Descriptive Statistics and Correlation Analysis has been performed in SPSS. Time series analysis on New Infection trends has been performed and annotated with the timeline of Government imposed restrictions (mask mandates, limitation on gatherings, open and closing of businesses, etc).
Preliminary conclusions on the Data Analysis have been drawn and are listed under the Project Progress Report.
Changes from Milestone 1 Report are documented in the Requirements section and include:
- Change of keywords used to identify topics: based on closer evaluation of the text.
- Milestone Meeting Dates were moved closer to the Milestone Report due dates to allow more time for execution of project tasks.
- Data Analysis Work Product changed from Word report to Excel workbook. It’s easier to organize Data Analysis in Excel. MS Word will be used only for the Final Solution Report. Drafts and iterations will be performed in Excel only.
- Change in approach to develop Power BI presentation: rather than writing down requirements for the visuals, the team will use an Agile prototyping approach to design the story in Power BI. Requirements will be derived directly from the Excel file containing the results of Data Analysis phase.
Overall Project Status: On Schedule
Project Plan
Overview
This research project seeks to assess and analyze the relationship between public health advisory statements during the COVID-19 Pandemic and the trends on new infections in Singapore.
Social Media posts from the Singapore Ministry of Health (https://www.moh.gov.sg/) Facebook and Twitter accounts will be extracted and cross-referenced against the World Health Organization data on daily new infections reported in Singapore.
Under the direction of Dr Shirley Tian, the KSU student team will collect public social media activity and perform statistical analysis of significant relationships detected in the data. The main deliverable of this project is a Research Report including methodology, findings and data visualizations.
Project Team
Roles | Name | Major responsibilities | Contact (Email and/or Phone) |
Project owner | Dr Shirley Tian | Provide project scope, goals and requirements; mentor students, assess project and team performance. | xtian2@kennesaw.edu |
Team leader | Elaine Harris | Track project activities, facilitate inter-team communication, provide weekly and milestone progress reports, point-of-contact with Project owner and Advisor. | Eharr147@students.kennesaw.edu |
Team members | Maryline Kwa | Facebook extraction, Visualization and Data Analysis | mkwa@students.kennesaw.edu |
Chelsey West | Technical Writer: Milestone reports, Final Report, create and maintain project website | cwest83@students.kennesaw.edu | |
Raviteja Pasumarthi | Twitter Data Extraction, support Python tasks | rpasuma3@students.kennesaw.edu | |
Gabriel Oyebanji | Facebook extraction, additional presentation materials | goyebanj@students.kennesaw.edu | |
Sang Nguyen | Support Data Analysis, additional presentation materials, infrastructure support | snguye33@students.kennesaw.edu | |
Michael Farris | Visualization in Power BI, Facebook extraction, support Python tasks | mfarris4@students.kennesaw.edu | |
Advisor / Instructor | Dr Meng Han | Facilitate project progress; advise on project planning and management. | mhan9@kennesaw.edu |
Project website
https://sites.google.com/view/capstoneproject1fall2020
Final Deliverables
- Research Report with findings on the relationship between the Social Media collected and new COVID-19 cases
- Power BI or Tableau Workbook with data and visualizations included in the Final Report
- SPSS Workbook(s) with data and statistical analysis results
- All data files used in the analysis
- All source code used to extract and prepare data for analysis
Milestones
#1 - By 9/20/2020
- Requirements complete
- Social Media extracts completed
- Work Products
- Updated Project Plan with Requirements for Milestone 1 and 2 deliverables
- Twitter extract raw file
- Facebook collection raw files
- Singapore Cases raw file
- Cleaned extracts in Excel
#2 - By 10/04/2020
- Topic Modeling Complete
- Data Analysis in SPSS complete
- Work Products
- Python code used to create Topics
- Enhanced Social Media extracts including modeled topics
- Enhanced Social Media and Cases extracts prepared for Time Series analysis
- SPSS files used for Analysis
- Excel files used for Analysis (optional)
- Draft of Analysis Report in Word Excel containing the MVP described in the Requirements session
#3 - By 10/25/2020
- Data Visualization in Power BI or Tableau complete
- Final Report Complete
- Work Products
- Power BI Workbook
- SPSS files containing Analysis beyond the MVP (optional)
- Final Solution Report including Objectives, Methodology, Analysis, Finding and Recommendations.
Future milestone meetings date/time
Milestone #1: 09/10/2020 – 9:15pm
Milestone #2: 09/24/2020 – 9:15pm 09/29/20 – 2:00pm
Milestone #3: 10/08/2020 – 9:15pm 10/15/2020 – 9:15pm
Communication and Meeting Planning
Microsoft Teams will be used as the Collaboration Platform.
Team Manager will use email for tasks and requests that do not require immediate feedback (asynchronous). New files added to Teams will also be included in a Post in the General Channel. Team members are expected to check their KSU Outlook email on a regular basis. Note: we will not be using D2L email for this project.
All team members can use the Chat feature in Teams for peer-to-peer communication. Outside communication via text, email, etc, can be used between agreeing parties, however, every team member is expected to respond to chats initiated in Teams, as well as responding to the General channel in Teams when the “mention” feature is used.
Project Schedule and Tasks Planning
Gantt Charts also submitted as attachment.
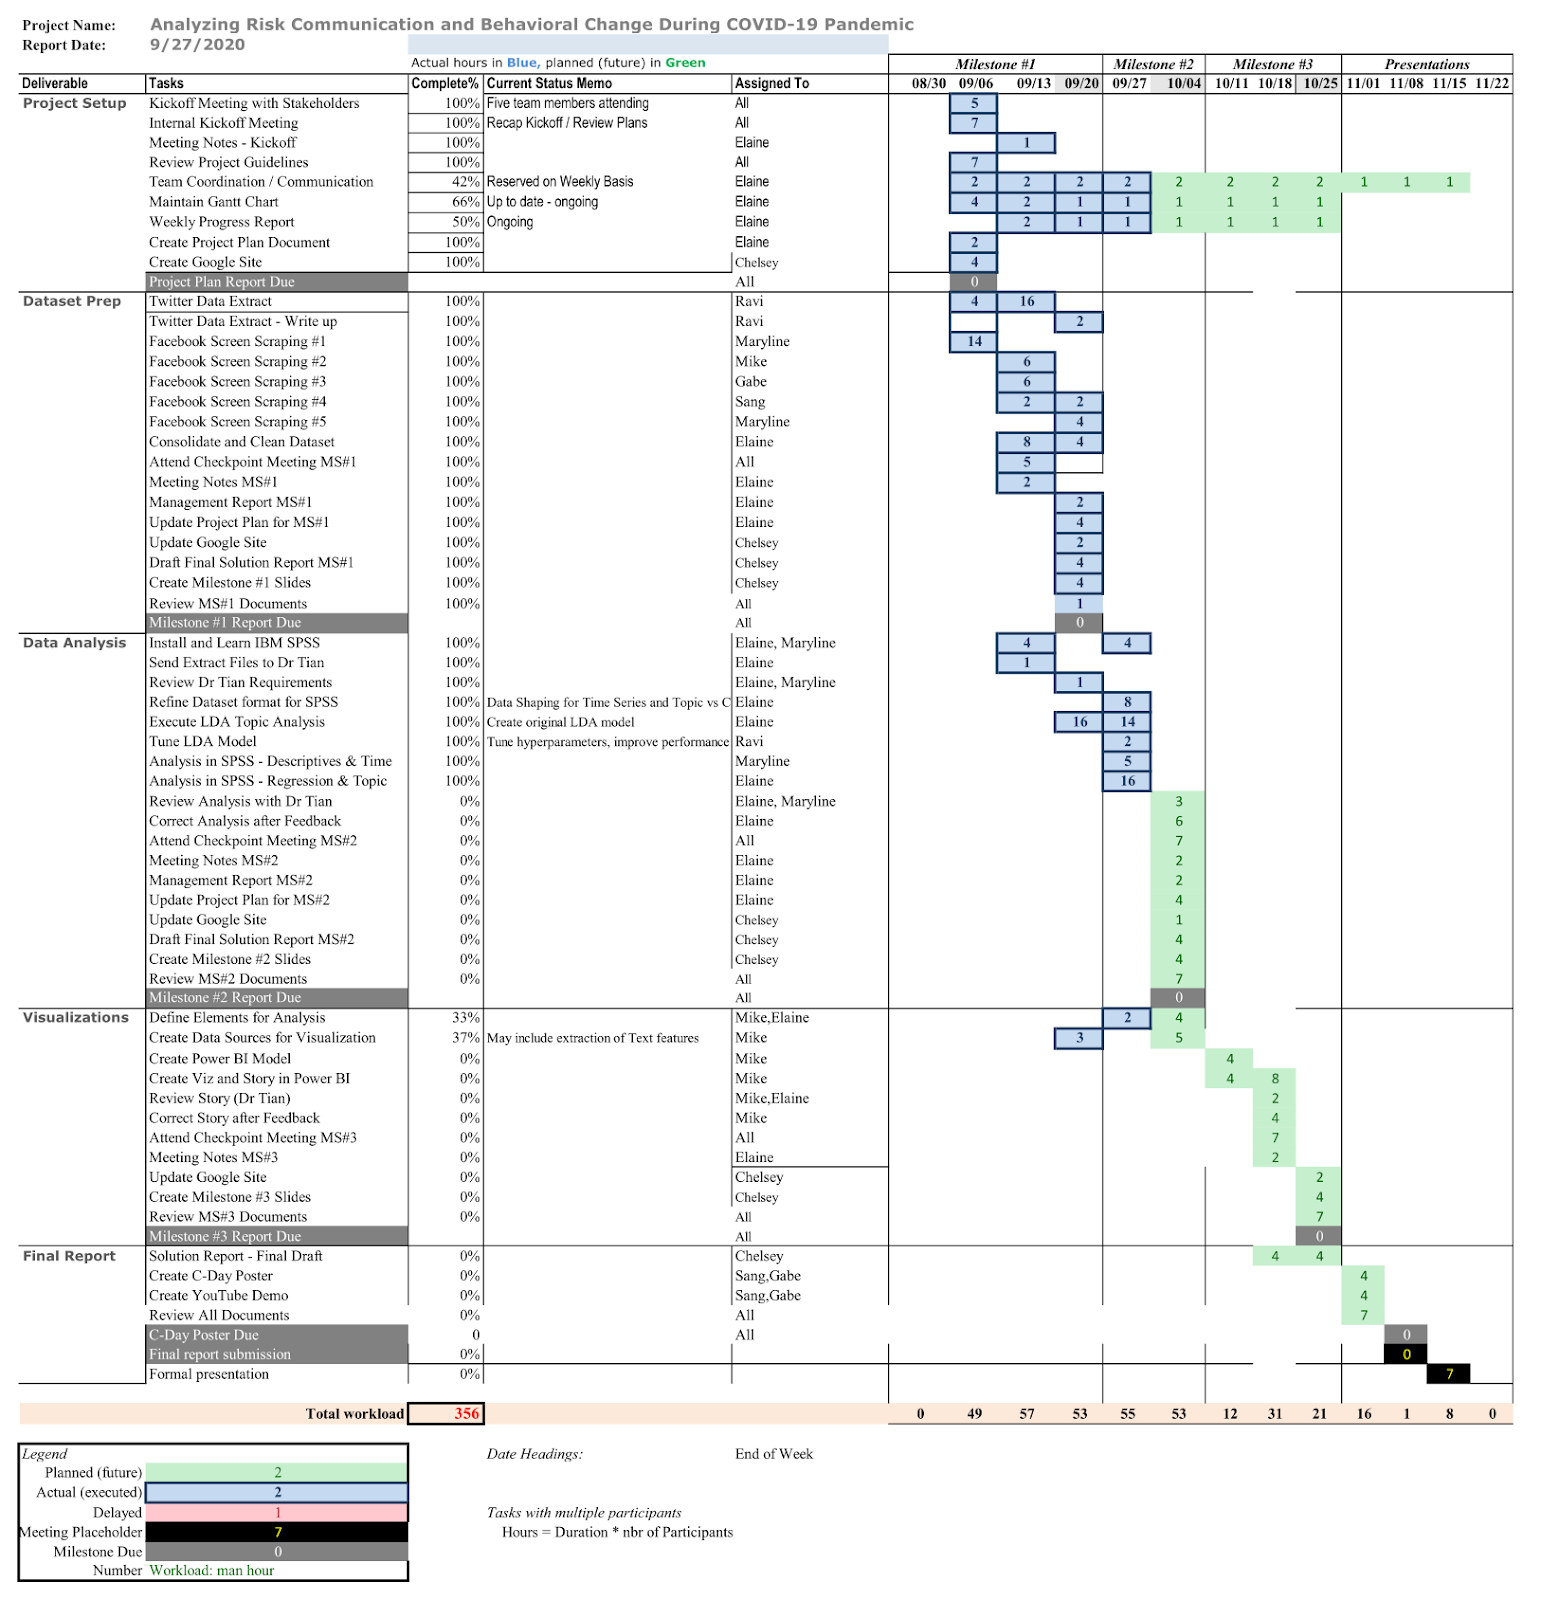
Figure 1 Gantt Chart as of 09/27/2020
Requirements – Milestone 1 Work Products
Data Sources
This project will utilize three data sources: Social Media extract from Twitter and Facebook, and the Daily COVID-19 infections log published by the World Health Organization (WHO).
Facebook and Twitter posts will be collected from 02/01/20 to 08/01/20.
Only posts from the Singapore Ministry of Health official accounts will be collected. Public replies or comments in either social media platform will not be collected.
The raw data will be cleaned up using Excel Power Query tool. Each extract will then be available as a regular Excel sheet that can be imported into other tools for Modeling and Analysis.
In addition to Social Media data, the Data Sources Workbook will contain the Cases data from WHO and a Calendar helper dimension that can be used in Power BI.
Shaped Data Workbook contains the following sheets:
Published Excel Sheets can be easily imported into modeling tools (SPSS and PowerBI) | |||
Facebook_Clean | Facebook Data | ||
Twitter_Clean | Twitter Data | ||
Combined_Clean | Facebook and Twitter data identified by Source field (1 = Facebook 2 = Twitter) | ||
Cases | Data for New Cases and cumulative cases | ||
Calendar | Helper Dimension for future Time Series visualization in Power BI | ||
COVID-19 Cases Data Shaping and Cleanup
The number of daily cases and fatalities is published by the World Health Organization (WHO). The Project Sponsor has supplied a data feed for Singapore called Singapore.xlsx.
Data will be used as is, and merged to Social Media data via Excel Power Query when needed.
Layout of Cases file:
Field Name | Description |
Date_reported | Calendar Date cases were reported |
Country_code | Literal “SG” |
Country | Literal “Singapore” |
WHO_region | Literal “WPRO” |
New_cases | Reported New Cases on Date_reported |
Cumulative_cases | Running Total of New Cases from first date reported (01/23/2020) |
New_deaths | Reported New Deaths on Date_reported |
Cumulative_deaths | Running Total of New Deaths from first date reported (01/23/2020) |
Twitter Data Collection
An open source Python project will be used to collect historical tweets from account @ sporeMOH
Extract all available fields into the raw output. Data Shaping procedures will be applied later to select and clean up desired fields.
Link to Github (includes source code and usage directions)
https://github.com/Jefferson-Henrique/GetOldTweets-python
Available fields
id (str)
permalink (str)
username (str)
text (str)
date (date)
retweets (int)
favorites (int)
mentions (str)
hashtags (str)
geo (str)
Facebook Data Collection
Facebook does not provide free good API’s for data extraction. We will obtain Facebook data by screen scraping the following fields from the Facebook posts: date, posts (text), No. of likes, No. of comments, and No. of shares. Captured data will be saved in multiple Excel files, one for each team member involved in the collection process. Data Shaping procedures will be applied prior to Data Analysis to clean up the text and consolidate the raw files.
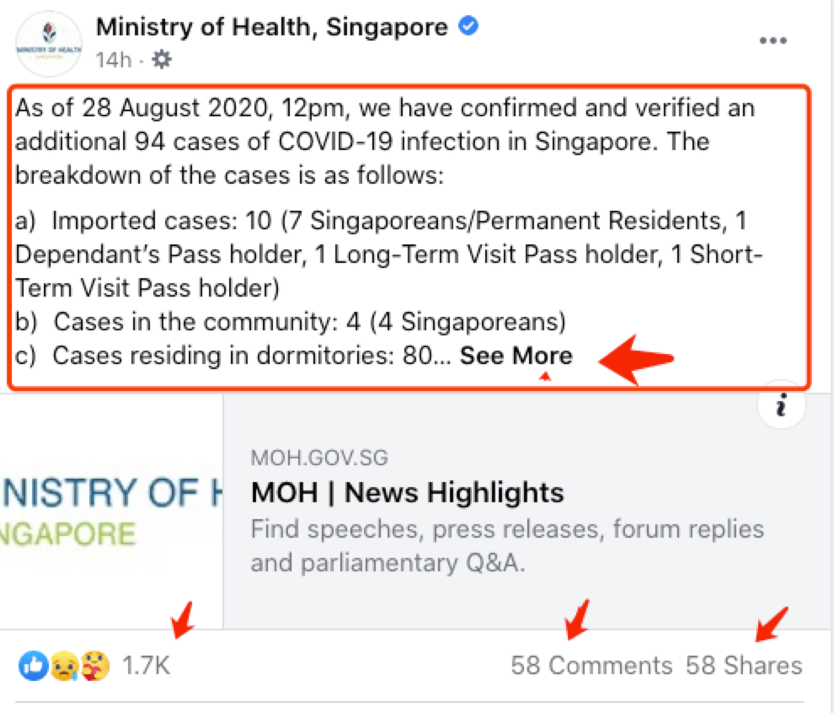
Figure 2 Example Facebook Post indicating fields to be captured
Facebook Collection Excel Template in Teams
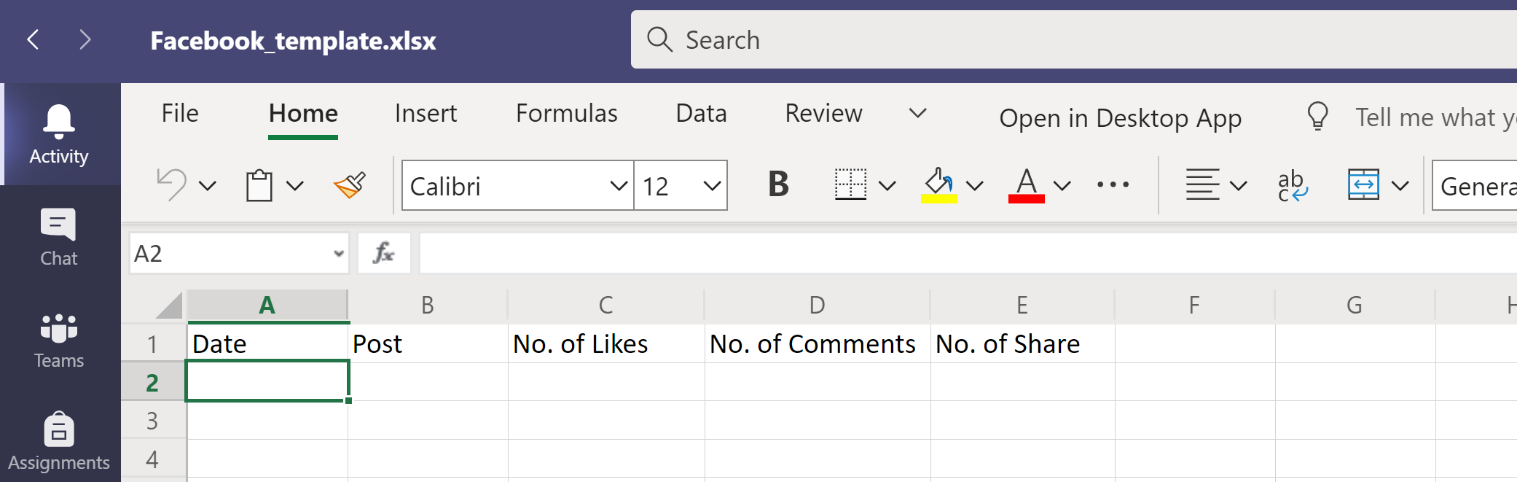
Figure 3 Facebook Collection Template
Social Media Data Shaping and Cleanup
The data from each social media channel is basically the same, however, the raw extracts are shaped slightly differently. In order to facilitate future analysis, the raw data will be transformed to standardize field names, clean up text data and consolidate the Facebook files.
All data shaping operations will be performed in Excel, using Power Query as a personal ETL tool. Power Query is easy to use and performs very well on small data volumes, such as the extracts used in this project.
The final product of the Power Query transformations will then be published as regular Excel Sheets that can be easily imported into SSPS and Power Query.
Data Shaping Specifications
Create an Excel Workbook
Import data from raw Twitter Extract
Place all Facebook extracts in the same folder. Import the Folder. Power Query will generate the steps to combine all files located in the folder. New files can be added to the folder later, and the Power Query steps will automatically detect and process the new file.
Combine both extracts in a standard layout. Create Source field as 1 for Facebook and 2 for Twitter.
Use the following key to rename and reorder the columns into standard layout:
Standard Field | Description | ||
Source | Literal 1 | Literal 2 | Data Source Id |
Date | Date | Date | Post or Tweet Date |
Text | Post | Text | Text |
Shares | No. of Share | retweets | Number of times post was shared by users |
Likes | No. of Likes | Favorites | Number of times post was liked by users |
Comments | No. of Comments | N/A | Number of comments (Facebook only) |
Apply Text clean transformation to remove all non-readable characters
Remove all commas from text, in case data needs to be exported as CSV
Change all text to lowercase, for future Text Topic Modeling
Publish Shaped Data as Excel Sheets in the same workbook (Load to Table option in query)
Requirements – Milestone 2 Work Products
Milestone 2 focuses on performing ad-hoc Data Analysis in SPSS, finding and explaining insights found in the data. As such, requirements are not rigid, but will rather focus on the general methodology used and the Minimum Viable Product (MVP) specified by the Project Sponsor.
As Data Exploration progresses, the insights will be captured as SPSS Outputs and compiled in the Final Report Draft due for Milestone 2.
Data Analysis Minimum Viable Product
Descriptive Statistics
Use SPSS to run Descriptive Statistics on collected metrics: Shares, Likes, Comments, Posts Frequency
Report the Descriptive Statistics for each Social Media Channel in separate tables.
Time Series Analysis
Use SPSS to perform Time Series Analysis on New Cases and identify which days represent turn points. Then trace back those days to the Social Media data. Mark any significant findings on the Time Series Chart.
If nothing is found, attempt to find alternative explanations.
Regression Model
Next, we will need to find if the social media posts have relationships to the confirmed cases 14 days later. For example, 2/1 social media post will correspond to 2/14 new cases because of the character of the Covid-19.
Topic Modeling
Which topic is most mentioned? What kind of information is useful to help control the new cases in Covid-19 and change people behavior?
For the MVP, topics will be identified based on patterns observed in the Social Media Posts. Frequency counts can be obtained by looking for the presence of certain keywords in the text, and counting the topics as 1 (present) or zero (not present) in the post.
A preliminary list of topics and corresponding keywords is provided below:
Topic | Search keywords |
Social_distance | social, distance, gathering, -ft, feet, meter, crowd, restriction |
Hygiene | hand, wash, hygiene, clean, alcohol, sanitizer |
Face_coverings | mask, coverings, bandana, gaiter, nose, mouth |
Vaccine | vaccine, immunization |
Testing | test, positive,negative,free |
Travel | travel, airport, foreign, visitor, migrant, temporary, visa, cruise |
Infection_trend | new, additional, cluster, tracing |
Recovery_trend | recover, discharge |
Fatality_trend | intensive, death, fatal |
Rumours | rumour, fake, whatsapp, incorrect, misinformation, social media, false, unfounded |
Contact_tracing | contact, trace, tracing |
Milestone 2 updates after execution of Topic Modeling
The following keywords will be used to count frequency of themes in the text:
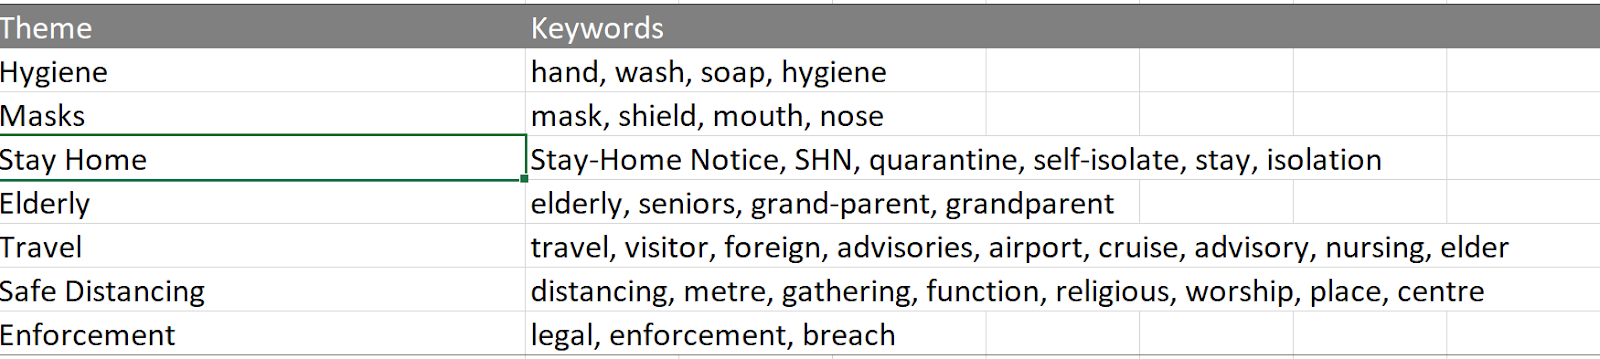
Figure 4 Criteria for Keyword Frequency Counts
Stretch Goal: Topic Modeling Using Latent Dirichlet Allocation (LDA) in Python
Topic Modelling is defined as a technique to automatically identify topics in a corpus (collection of texts). The technique requires the use of some Unsupervised Machine Learning algorithm to read the text and identify topics and keywords without human intervention.
A popular algorithm for Topic Modeling is Latent Dirichlet Allocation (LDA). The algorithm is offered in several popular open source Python Libraries, including Gensim and Keras.
LDA assumes documents are produced from a mixture of topics. Those topics then generate words based on their probability distribution. Given a dataset of documents, LDA backtracks and tries to figure out what topics would create those documents in the first place. (Bansal, 2020)
LDA will be performed as a Stretch Goal for this project. None of the team members has experience with Text Mining libraries and techniques. If analysis cannot be concluded in a timely fashion, then the Observation Method described in the MVP will be used for the Final Solution Report.
Requirements – Milestone 3 Work Products
Milestone 3 focuses on creating attractive Visual Presentation in Power BI. A Story will be created in Power BI and will include charts representing the findings of the Data Analysis.
Visuals created in Power BI will be added to the Final Solution Report, and the PowerBI Workbook itself will be published to the Web and included in the Google Site for this project.
The content of the Power BI workbook will be defined by selecting meaningful insights from the data Analysis work product. Analysis of the findings will be extended with interactive visualizations based on the significance of the Data Analysis results.
Rather than writing down requirements for the visuals, the team will use an Agile prototyping approach to design the story in Power BI.
Project Progress Report
Milestone 2 Goals
- Topic Modeling Complete
- Data Analysis in SPSS complete
- Work Products
- Python code used to create Topics
- Enhanced Social Media extracts including modeled topics
- Enhanced Social Media and Cases extracts prepared for Time Series analysis
- SPSS files used for Analysis
- Excel files used for Analysis (optional)
- Draft of Analysis Report in Excel containing the MVP described in the Requirements session..
Accomplishments
Topic Modeling is complete.
Stretch Goal of LDA Topic Modeling has been achieved. The final model uses the Mallet LDA algorithm, executed in the Gensim library LDA wrapper.
Facebook and Twitter posts were broken down into sentences using the NLTK (Natural Language Toolkit) sentence tokenizer.
- The model implementation was selected by comparing the model Coherence measure between the Gensim library built-in LDA Model and the Mallet implementation. Execution and results available in Jupyter Notebook “tune-facebook-sentences.ipynb”.
Link to script in MS Teams:
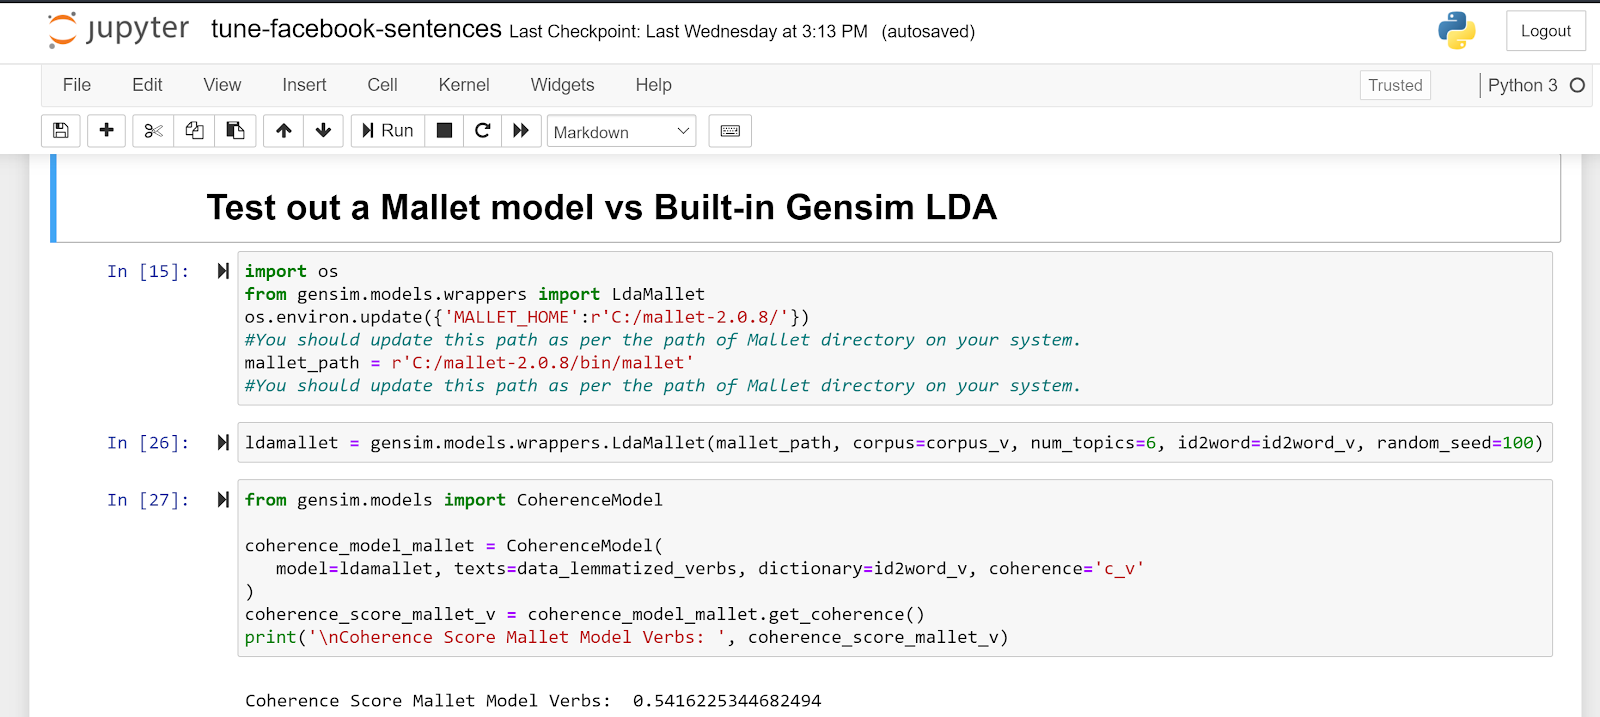
Figure 5 Gensim vs Mallet LDA implementation - Mallet Model code snippet
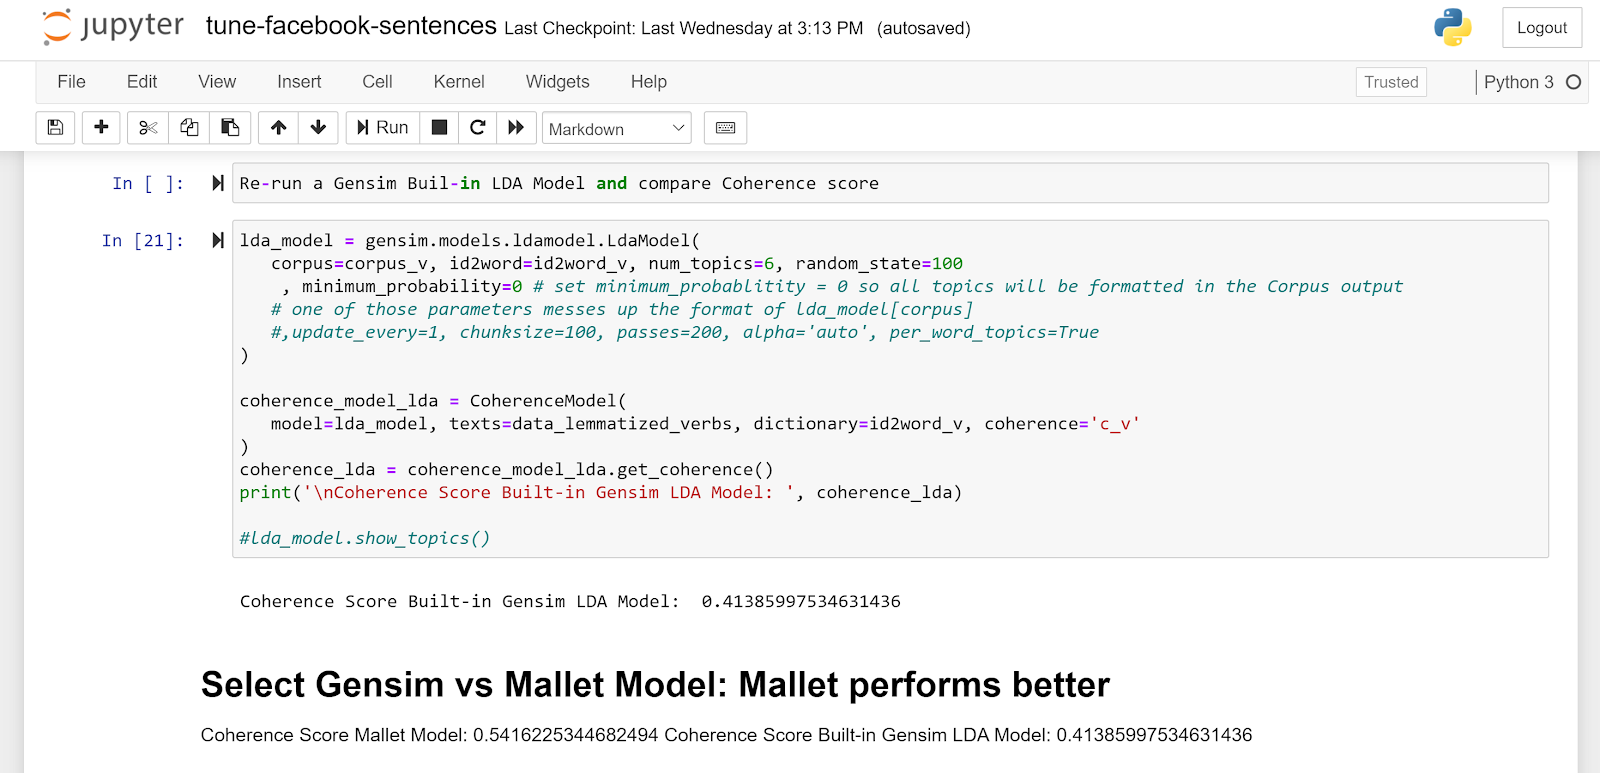
Figure 6 Gensim vs Mallet LDA implementation - Built-in Gensim and Coherence Score comparison
- Selecting the Optimum Number of Topics
The LDA algorithm is an unsupervised machine learning approach, meaning that the algorithm will find similarities in the vocabulary usage without a training set previously classified by a human. It is a Statistical Language Model based on the “Bag of Words” technique. A Bag of Words is simply a vector that counts the frequency of every word in a corpus. In our case, the corpus is the collection of all Facebook and Twitter posts extracted in Milestone 1.
The LDA (Latent Dirichlet Allocation) algorithm performs two basic steps:
- Identifies x number of topics based on the keyword frequency distribution in the corpus
- Compares each text (in our case, each sentence in the posts) to the topics defined in step 1 and calculates the match percentage of that text to each of the topics.
- Based on the topic distribution by text, the developer can then select the Dominant Topic by sorting the array and picking the highest probability match for the text.
The number of topics to be produced can be set as a hyperparameter. It is good practice to compare the Coherence Score between different number of topics and create the final model based on the best score. This is a trial-and-error procedure. In our case, we have adapted code from https://www.tutorialspoint.com/gensim/gensim_creating_lda_topic_model.htm and selected the number of topics by creating a graph that represents the Coherence Score curve as the number of topics increase.
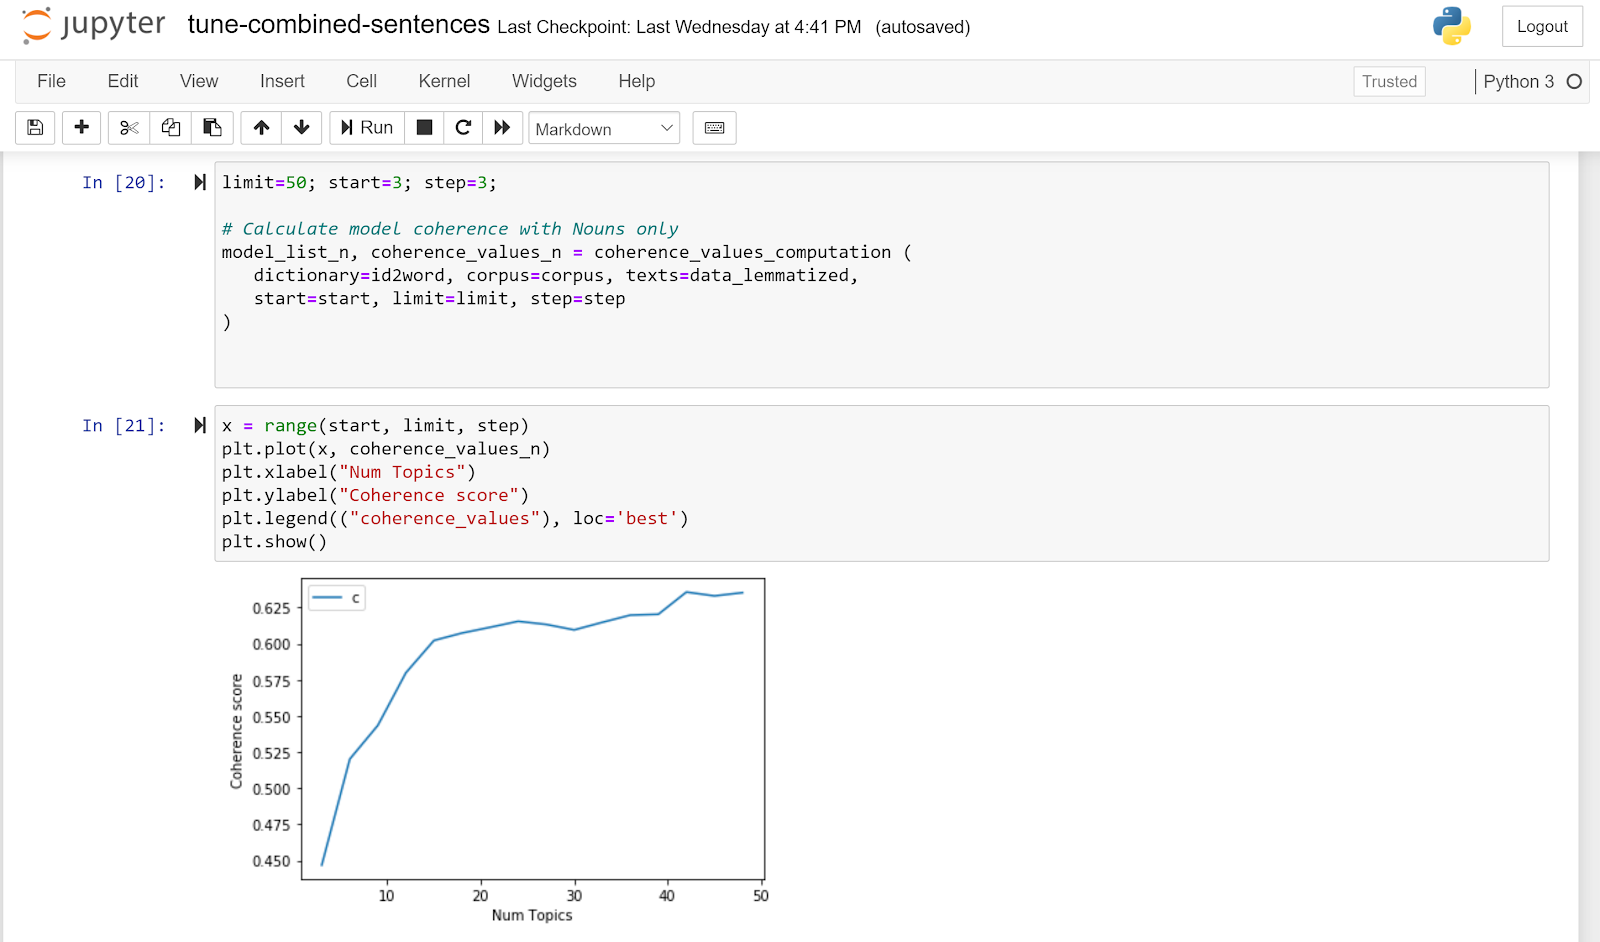
Figure 7 Topic Number Selection
The highest Coherence Score was 0.6357, for 42 topics. However, 42 different topics becomes unmanageable for further analysis. The Coherence Score for 15 topics was 0.6022, which is not much worse than 42 topics at 0.6357, and yields a much more manageable number of topics for further analysis.
Python Code – Fine Tuned Models
File location
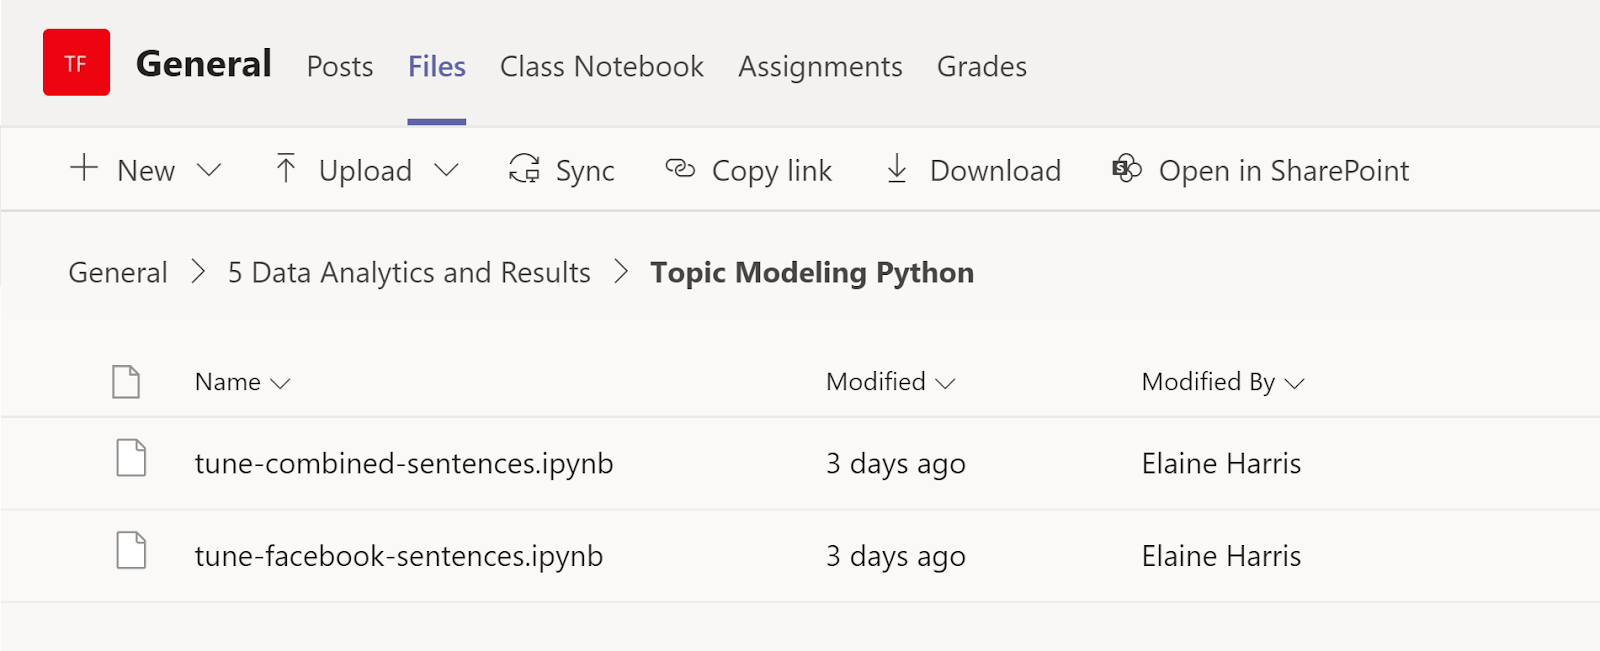
Figure 8 Topic Modeling Scripts in MS Teams
Python script output – Classified Posts with Topic Probability Distribution
File location
https://teams.microsoft.com/_#/files/General?threadId=19%3A74bd88dbbd5d476c9de9fd3df7fefeed%40thread.tacv2&replyChainId=1601072638753&ctx=channel&context=Topic%2520FIles&rootfolder=%252Fsites%252FTeam-2020FallDipLabGraudateCapstone%252FShared%2520Documents%252FGeneral%252F5%2520Data%2520Analytics%2520and%2520Results%252FTopic%2520FIles
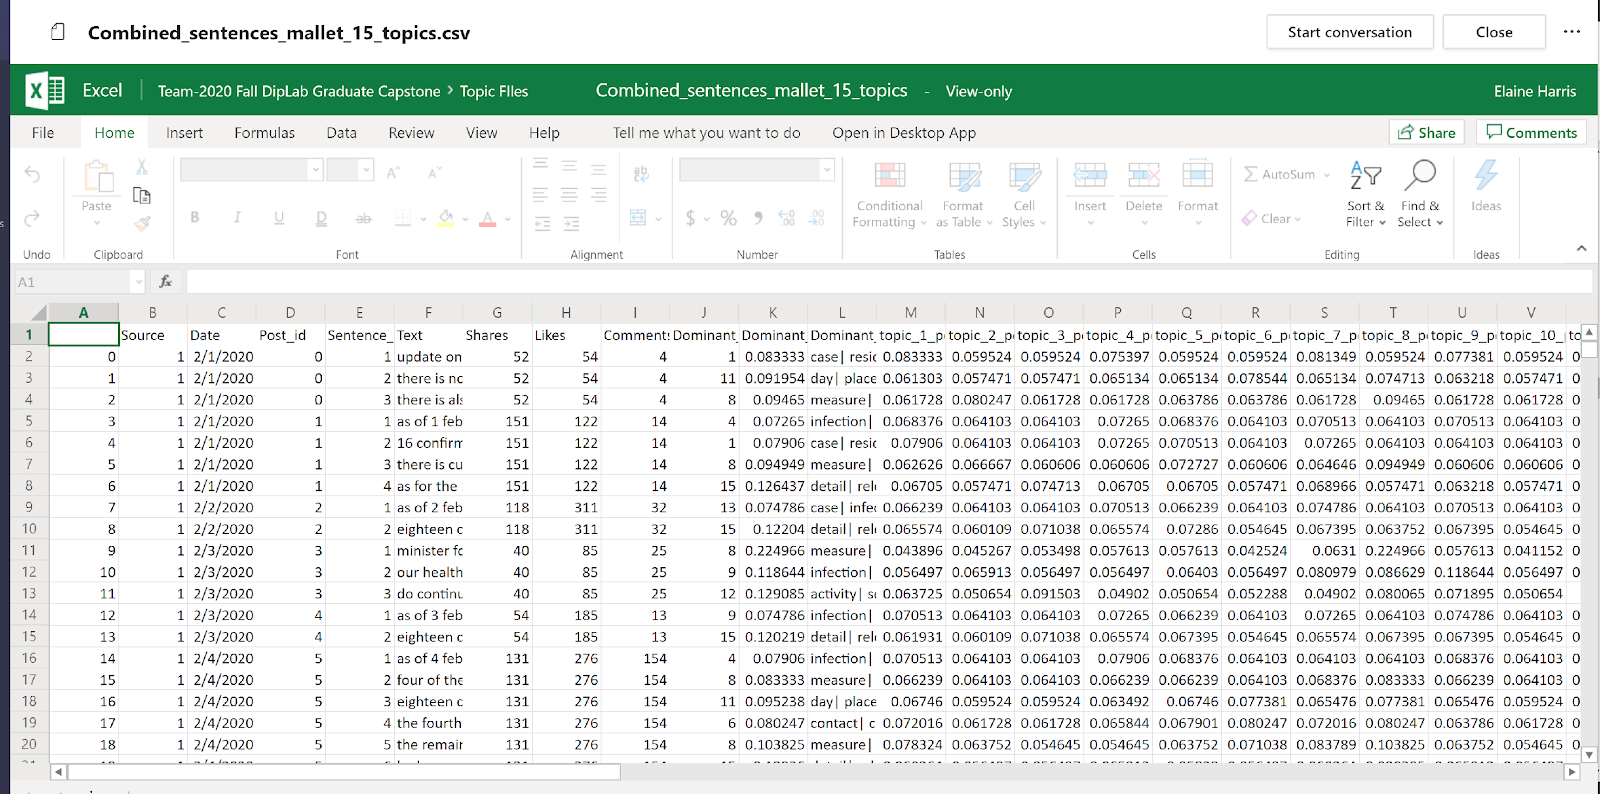
Figure 9 Combined Facebook and Twitter Posts with LDA Topic Distribution
Data Analysis is complete.
Data Analysis on Cases, Posts and Time Series has been performed in SPSS and Excel. The Excel Workbook is available in Teams and will be used as input to the Power BI Visualizations phase.
Data Analysis Workbook location
Details and Findings from the Data Analysis will be compiled in the Final Solution Report. For the scope of this Management Report, we will provide a selected number of screen shots as evidence that the Data Analysis was executed.
All screen shots below come from the “Step4_Analysis.xlsx” file, which has been included in the D2L submission and is also available in MS Teams under folder “5 Data Analytics and Results/Reports”
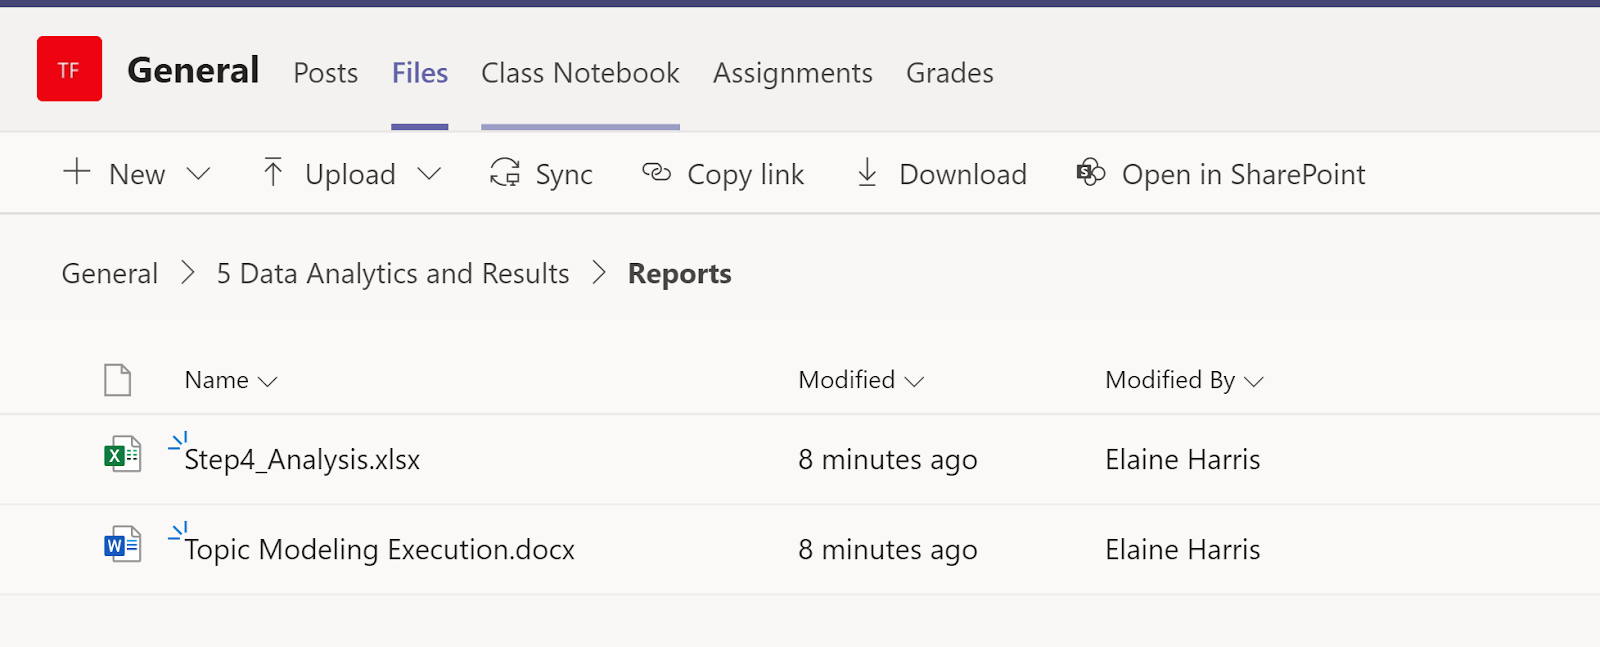
Figure 10 Analysis Report location in MS Teams
Preliminary Findings in Summary sheet
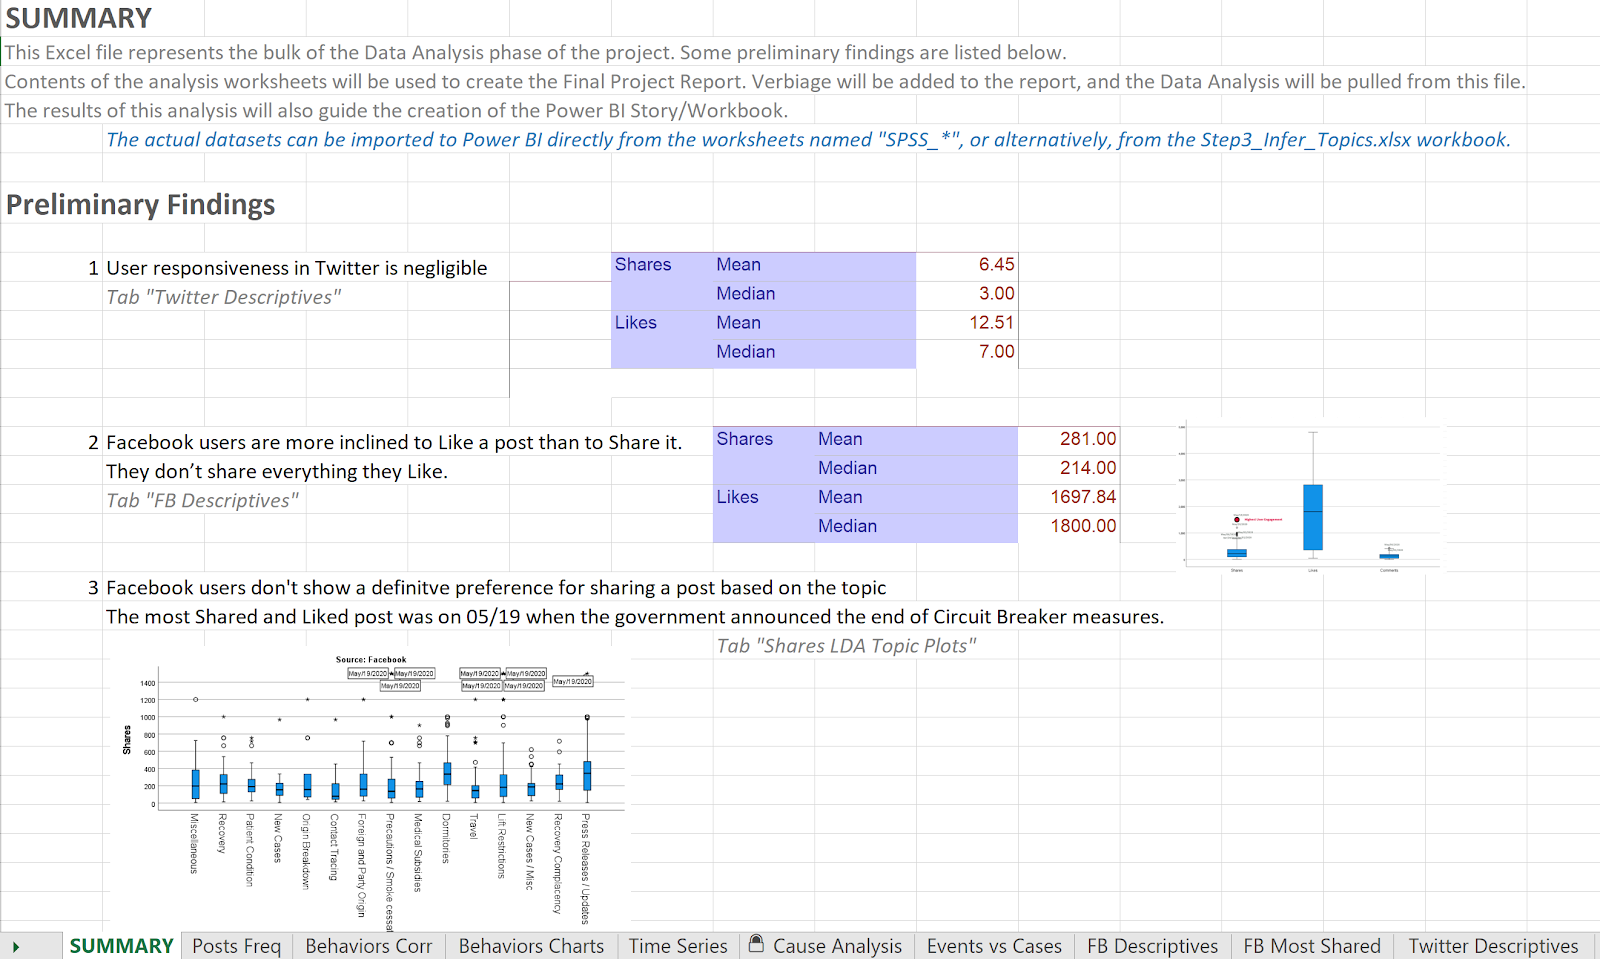
Figure 11 Data Analysis Summary - Part I
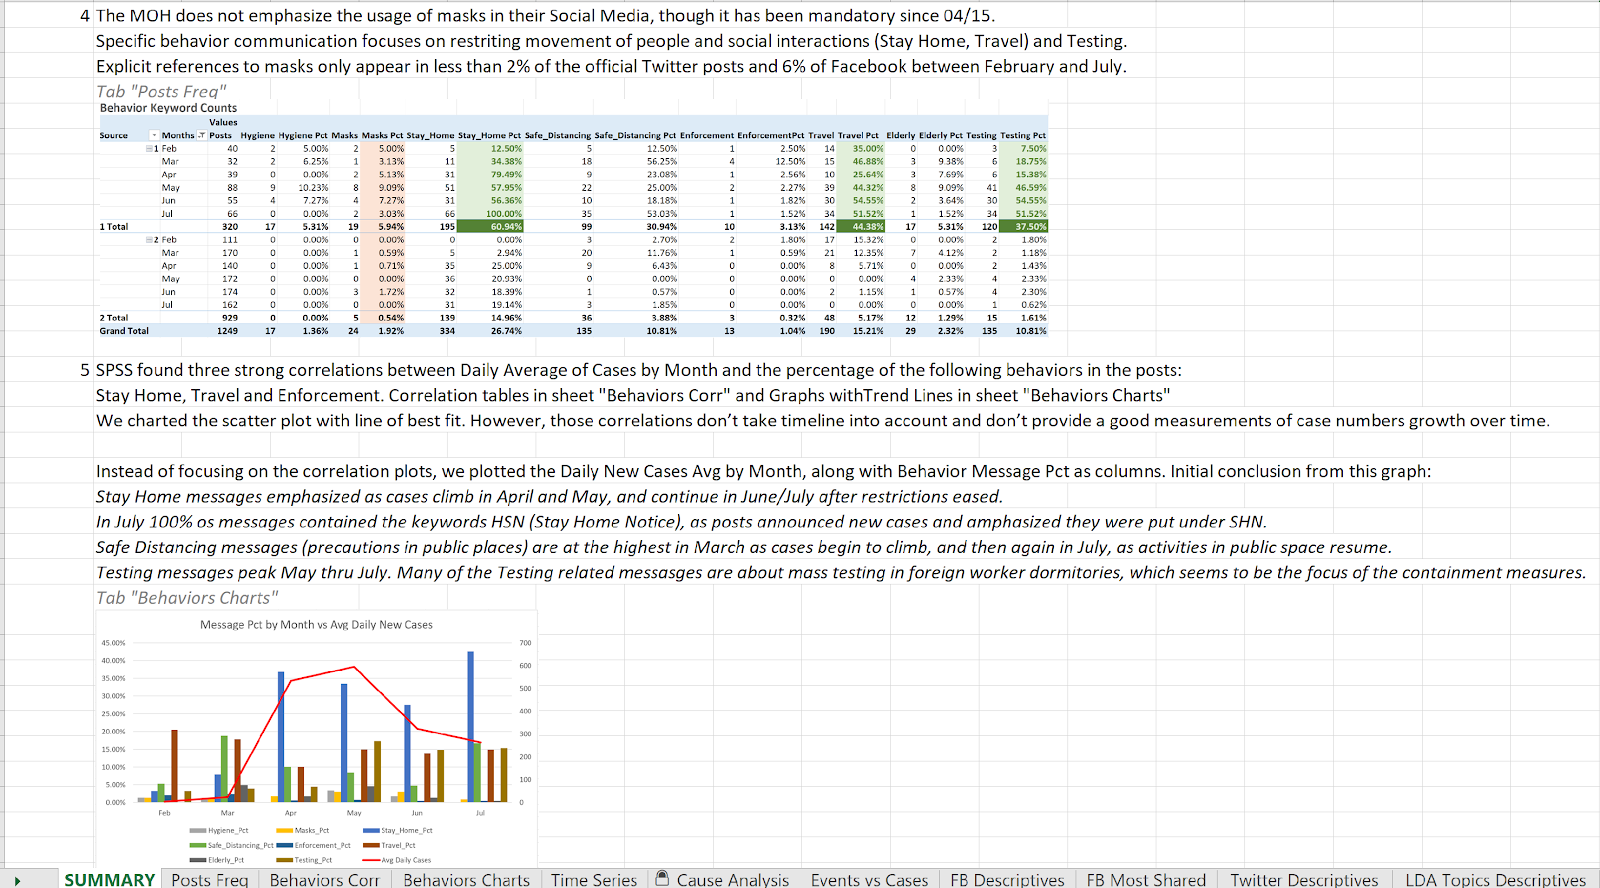
Figure 12 Data Analysis Summary - Part II
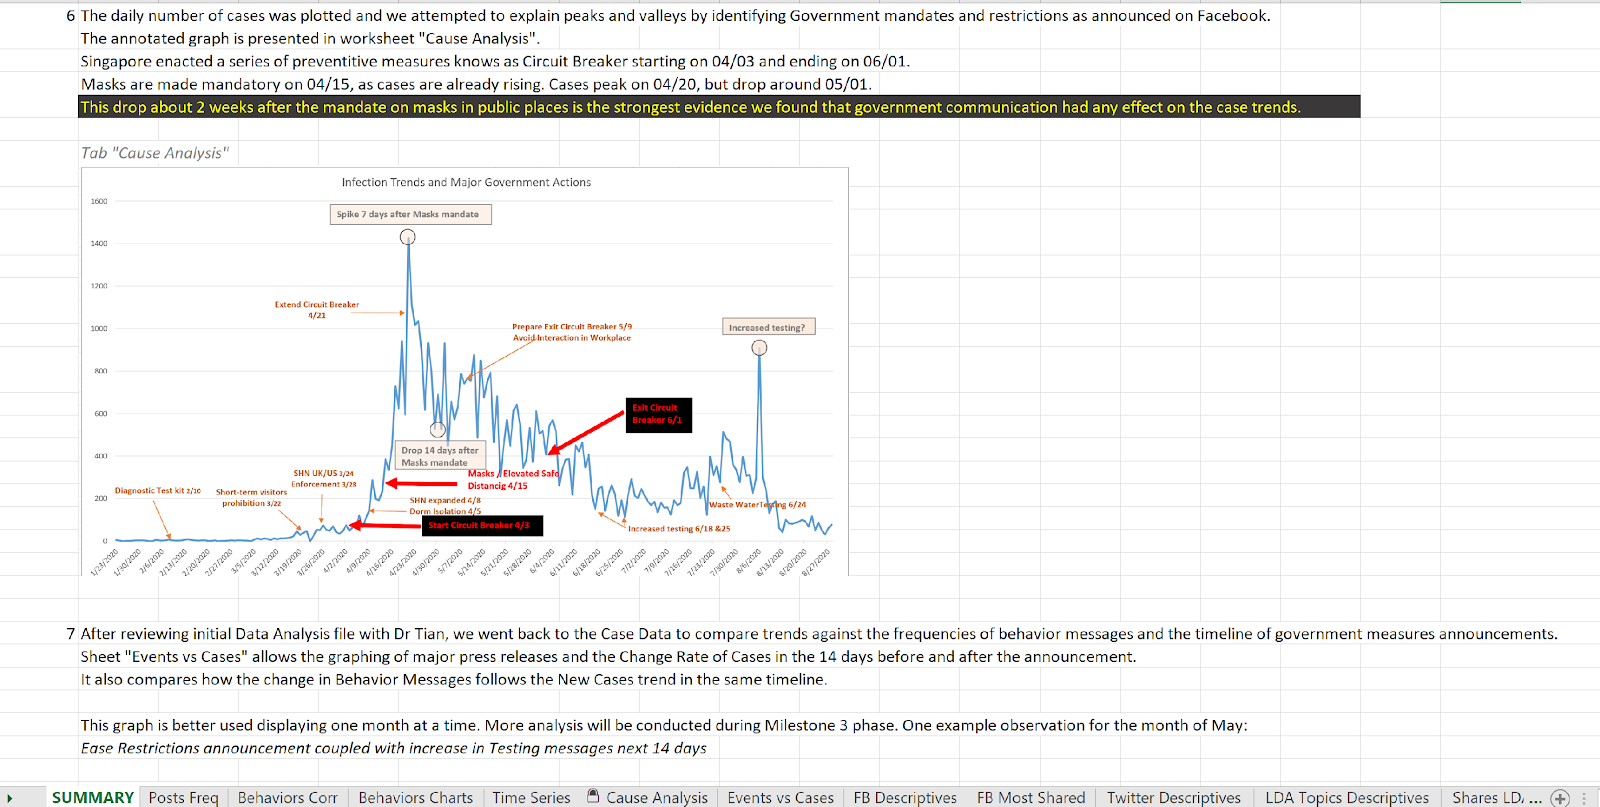
Figure 13 Data Analysis Summary - Part III
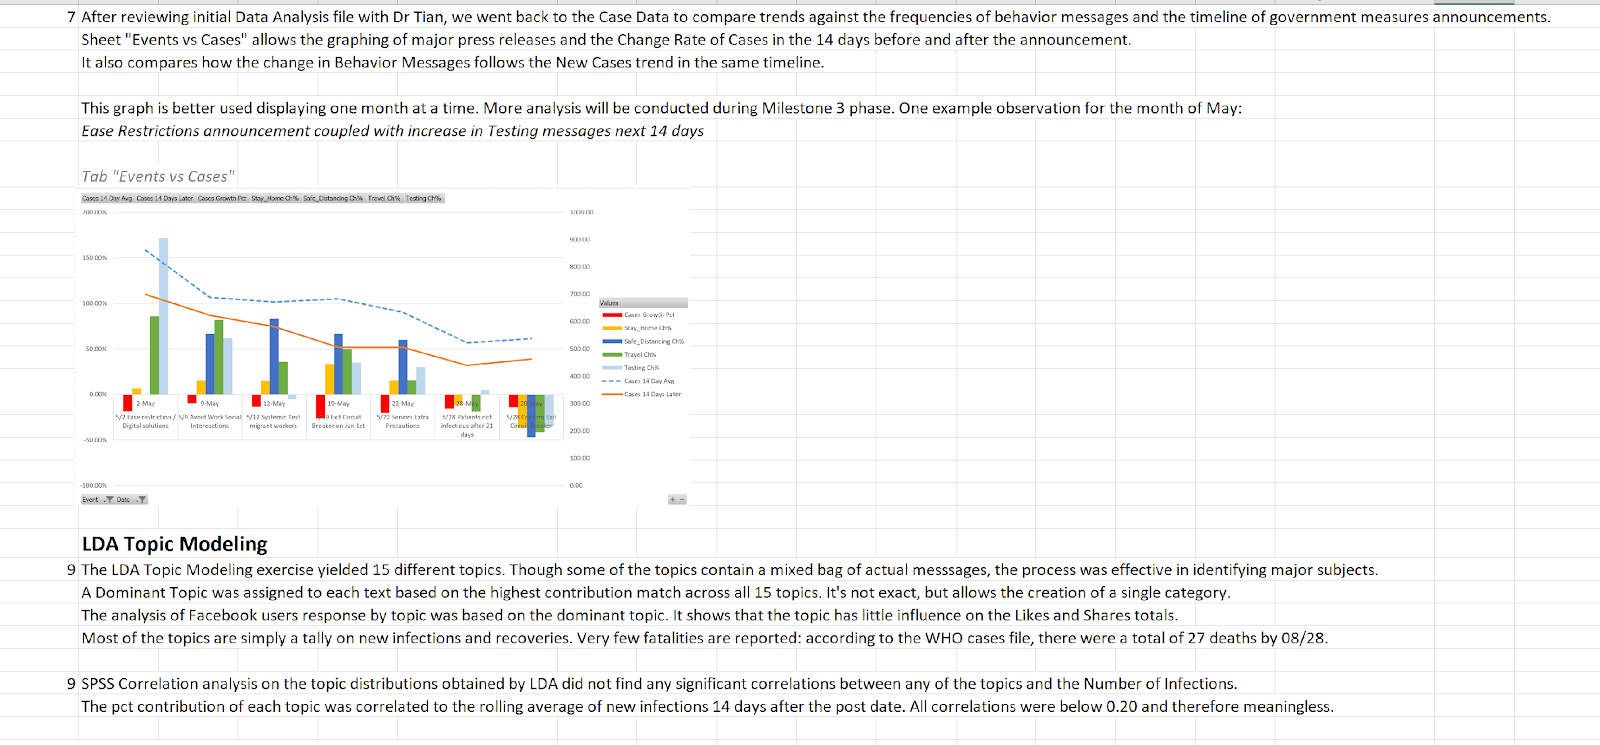
Figure 14 Data Analysis Summary - Part IV
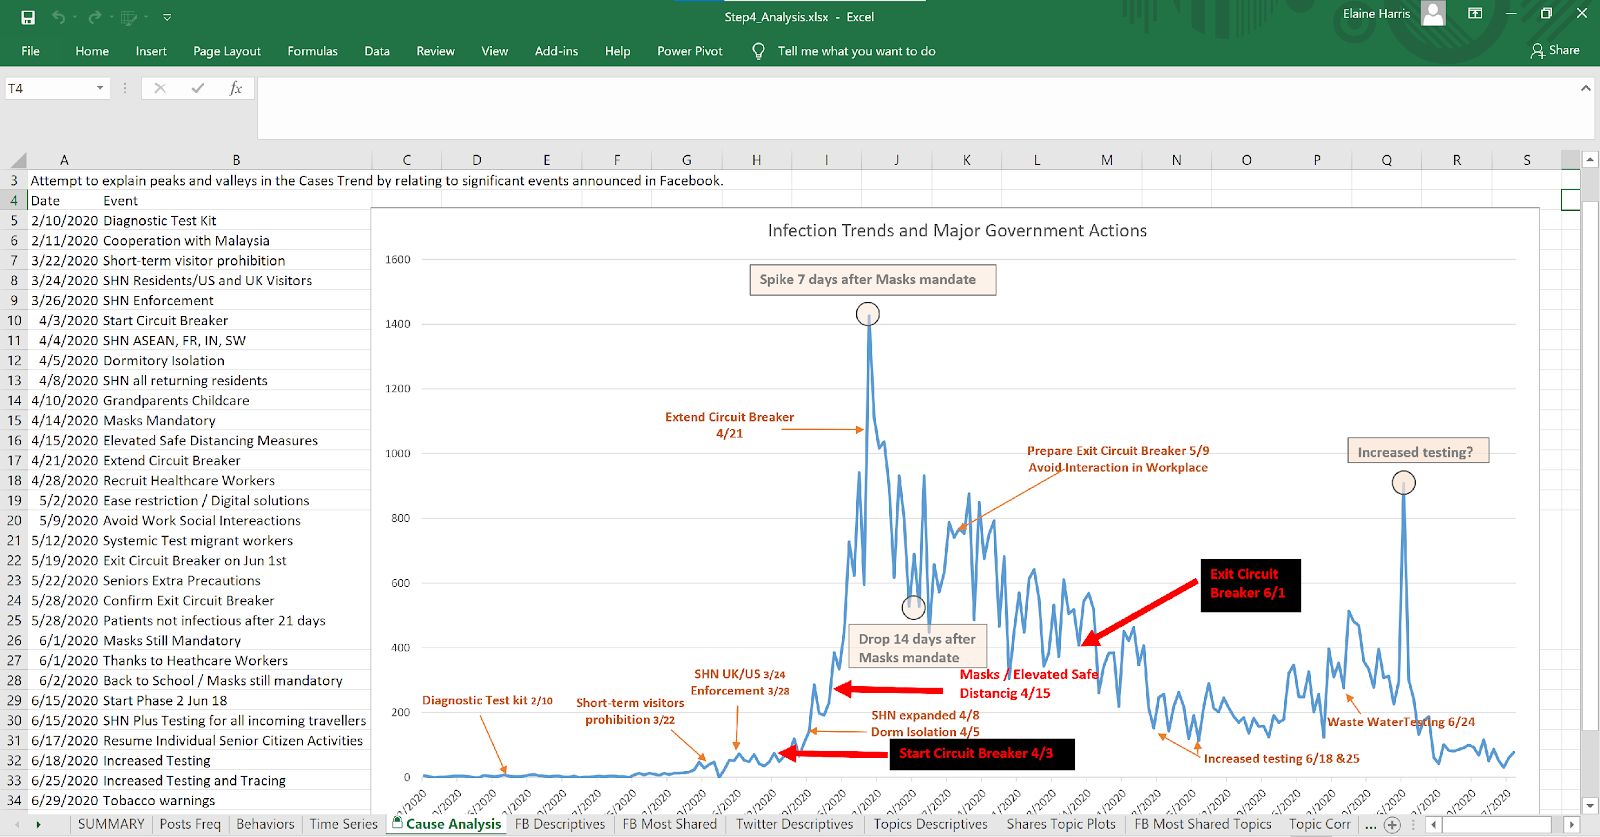
Figure 15 New Infections Time Series Annotated
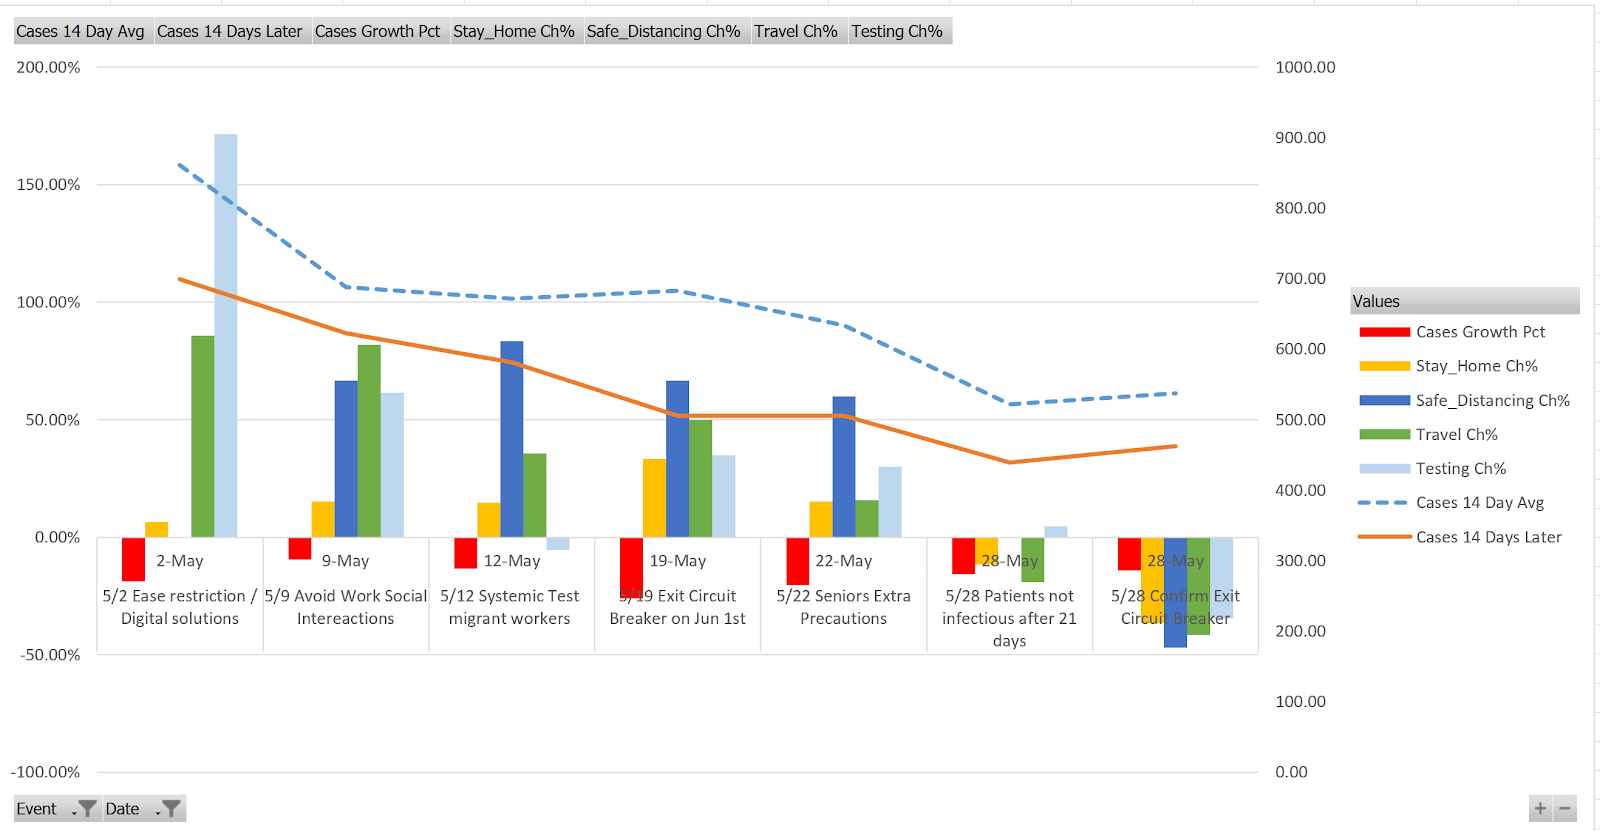
Figure 16 Events vs Messages and Case Trends – May
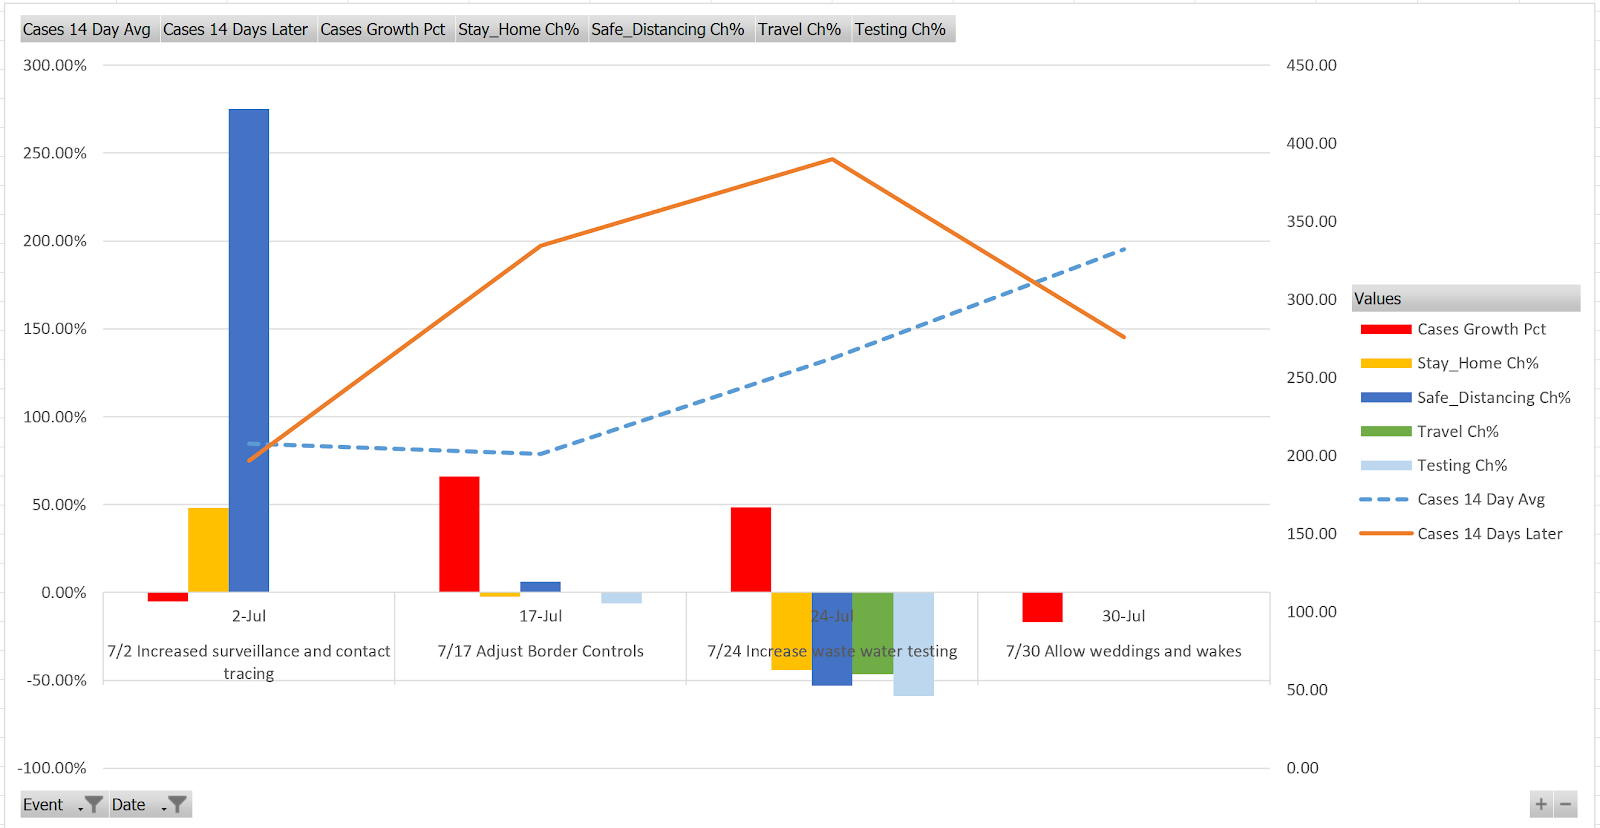
Figure 17 Events vs Messages and Case trends - July
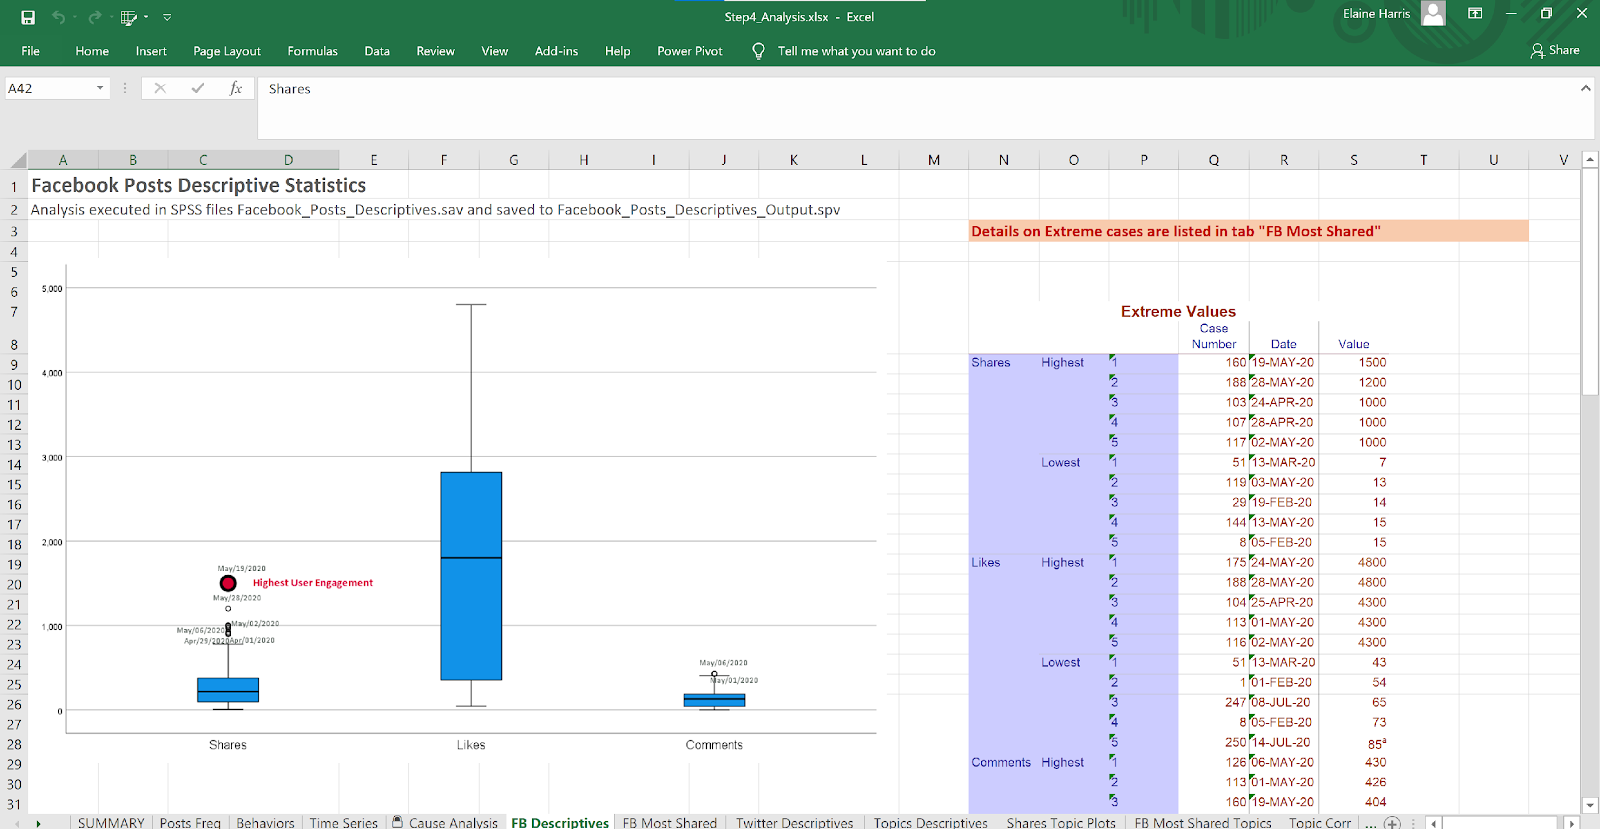
Figure 18 Facebook Descriptives - Shares, Likes and Comments
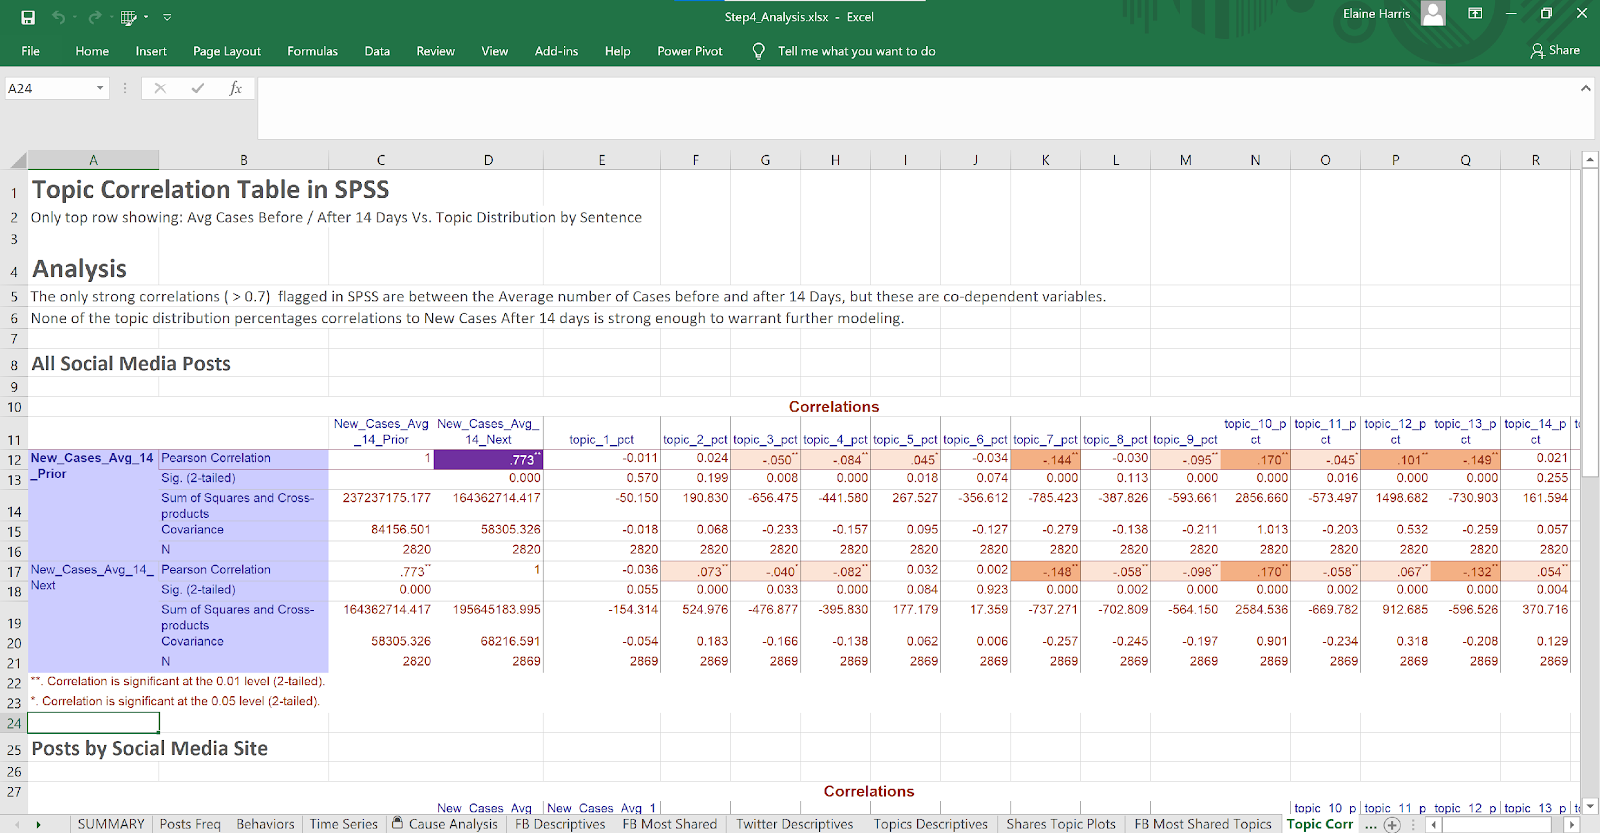
Figure 19 LDA Topics Correlation Table
Deliverables
All Work Products described in Accomplishments have been uploaded to Teams under folder “2 Milestone Reports\Milestone 2\Work Products”.
In D2L, the contents of the folder have been submitted as a zip file “Work Products.zip”
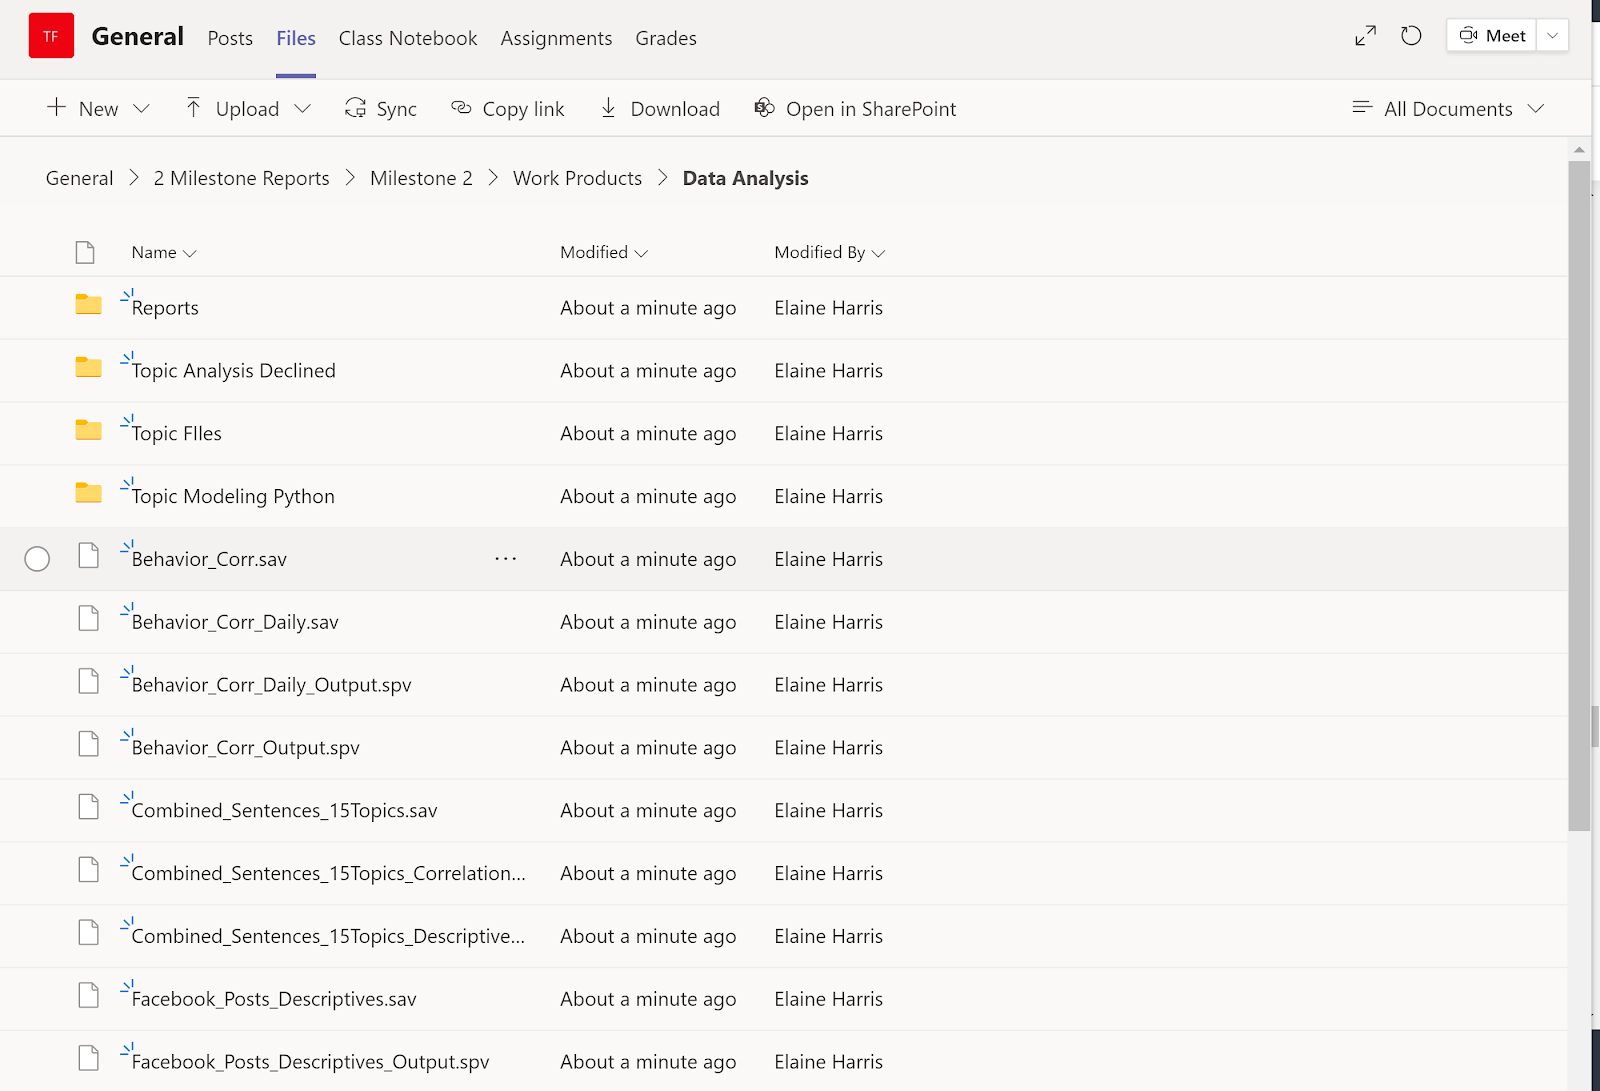
Figure 20Milestone 2 Work Products
Learnings from Data Analysis Phase
- LDA Topic Analysis proved to be more time-consuming than expected. There is no prescribed way to obtain an optimal number of topics, and several models had to be created.
- The topics created by LDA resulted in a bag of words that wasn’t clearly identifiable as a collective theme. Visual analysis of the best matching posts for each topic was performed to infer the theme for each topic.
- After all topics were examined, there was still no clear separation between certain behaviors we need to measure, such as masks, social distancing, self-isolation. In order to count frequency of these behaviors, additional frequency counts were added to the data source, based on a simple pattern match to the desired keywords.
- Correlation analysis was executed between the LDA topic distribution and the number of cases after 5 weeks. No strong correlations were found, indicating that an emphasis on any specific topic in the posts does not appear to impact the number of infections outcome.
- A second correlation analysis was executed between the frequency the keyword frequency in the posts based on the following themes:
Theme | Keywords |
|
|
|
|
|
|
Hygiene | hand, wash, soap, hygiene |
| |||||
Masks | mask, shield, mouth, nose |
| |||||
Stay Home | Stay-Home Notice, SHN, quarantine, self-isolate, stay, isolation |
| |||||
Elderly | elderly, seniors, grand-parent, grandparent |
| |||||
Travel | travel, visitor, foreign, advisories, airport, cruise, advisory, nursing, elder | ||||||
Safe Distancing | distancing, metre, gathering, function, religious, worship, place, centre | ||||||
Enforcement | legal, enforcement, breach |
|
|
|
| ||
Correlation analysis returned one strong positive correlation (0.69) between the frequency of “Stay Home” messages and the number of cases 6 weeks later. Because this is a positive correlation, it indicates that the number of cases and the frequency of posts increase together. A simple explanation is that the Government increases the frequency of messages as the number of new infections rise. This conclusion does not offer insights into the effectiveness of the messages on the MOH Social Media sites.
- Since the statistical correlation analysis did not yield anything useful, we decided to focus on the time series analysis. We extracted posts from the Facebook site that relate to the implementation of specific measures and plotted those events in the New Cases time series graph. More details will be available in the Milestone 2 report.
Feedback from Milestone 2 Meeting
- Expectations on text analysis in Power BI were set: analysis is based on categories extracted from the text in the Data Analysis phase; not the post texts themselves.
- Team is concerned that the work submitted so far in D2L has not been graded. We don’t have feedback on the Final Solution Report draft.
Next Steps
For Phase 3 (Milestone 3), the team will execute prototype and finalize the Power BI workbooks featuring the most significant findings of the Data Analysis phase.
Some level of additional Data Analysis will be performed based on feedback from sponsor and from team members. All findings will be documented in the Final Solution Report.
Supporting Documents
All Meeting Notes and Weekly Project Reports for work concluded through 09/27 are uploaded to Teams under folder “2 Milestone Reports\Milestone 2\Supporting Documents”.
In D2L, the contents of the folder have been submitted as a zip file “Supporting Documents.zip”
Folder Location in Teams:
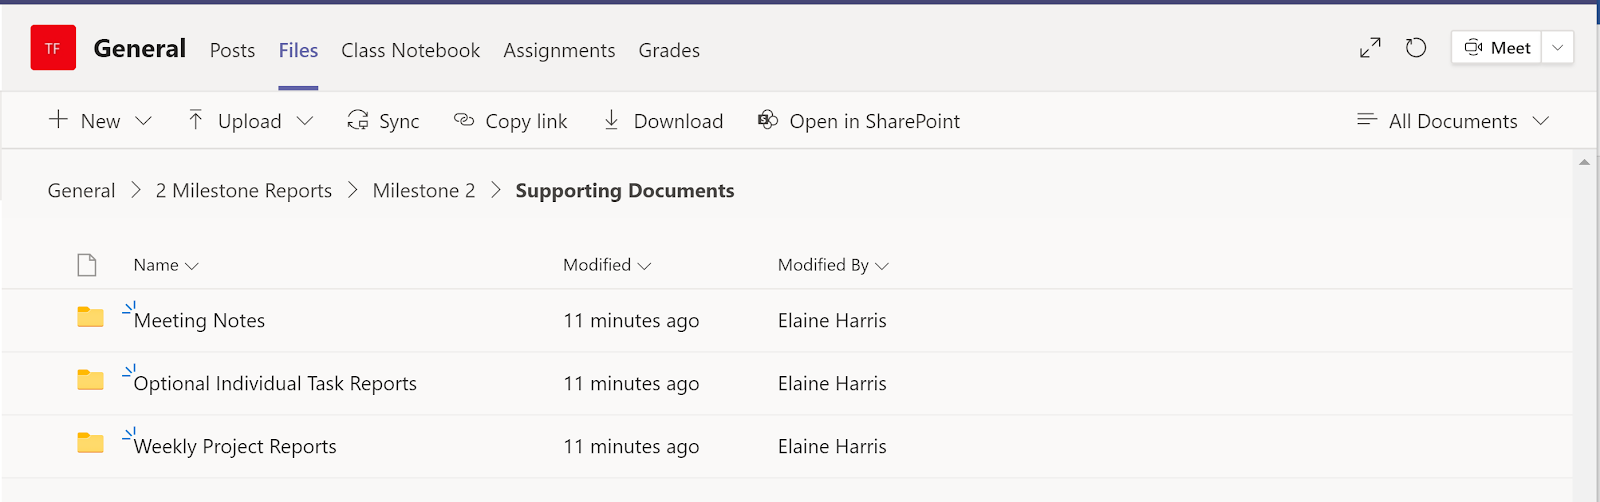
Figure 21 Milestone 2 Supporting Documents in MS Teams
END OF REPORT
Page of