Review tomorrow:
https://www.tableau.com/learn/tutorials/on-demand/introduction-lod-expressions
https://www.tableau.com/learn/tutorials/on-demand/when-blend-and-when-join
https://www.tableau.com/learn/tutorials/on-demand/bollinger-bands
Level of Detail
Cross db join
https://www.tableau.com/about/blog/2013/5/visual-analytics-best-practices-tableau-8-roadshow-23135
REVIEW:
Dimensions
- divide our data
- categorical in nature
- provide row/column headers
- the "by clause"
- have members
Measures
- things you do math on
- aggregates (avg, sum, min, max, count, etc.)
- typically numeric in nature
- values along a range
- dependent on the dimensions in the view
Discrete
- indicated by a blue data type icon
- when placed on columns/rows always give you a header
- divide your data
Continuous
- indicated by a green data type icon
- values along a range
- when placed on columns or rows, will give you an axis AND a marks card
Discrete Date Parts:
Year - 2010, 2011
Qtr - Q1, Q2, Q3, Q4
Month - Jan, Feb, Mar, etc
Day - 1-31
Week- 1-52
Weekday - Sun-Sat
Hour - 1-24
Min - 1-60
Sec - 1-60
Measure Names/Measure Values:
Tableau-generated fields that serve as placeholders for multiple measures
Used for combo/shared axis charts and dual axis charts
Off-label use: https://www.interworks.com/blog/skennedy/2016/09/08/label-uses-measure-names-and-measure-values-tableau
****************************************************************************
Connecting to Data in Tableau
1. Join
2. Blend
3. Union
4. Cross database join
Joins:
- ONE DATA CONNECTION in the Tableau data window
- two tabs in the same Excel file
- a table and a query in an Access database
- In a single SQL Server database, you want to use data from a table and view
- Need common field(s) to join on that is contained in all tabs/tables/etc
- Join types
- INNER JOIN
- LEFT OUTER JOIN
- RIGHT OUTER JOIN
- FULL OUTER JOIN
Blend:
- MORE THAN ONE CONNECTION in the Tableau data window
- a tab in an Excel file and a query in an Access database
- two tables from Access, and a view from SQL Server
- a tab in one Excel file and a tab in a different Excel
- Need common field(s) to blend on that is contained in all tables/etc
- Data --> Edit Relationships to estabilsh what fields to blend on
- ALWAYS a left-outer join
Primary data source = the data source from which you drag out your first field into the view
- indicated by a blue check mark on the data source in the data window
- That makes it the left side of the join
Union:
- "stack" data from more than one file into a single connection
- all files need to be in the same format
- Two file types that you can union
- Excel: all of your different files need to be tabs in the same workbook
- CSV: place all of your files in the same directory (folder)
Cross-database Join:
- Single connection in the data window
- Allows you to specify Left or Right joins from two different databases (as opposed to Blends which are always Left Outer)
- Can use Custom SQL as one of the data sources, so if you're a SQL wizard you can let the server do the work
- Row-level join (no aggregation first)
- Joins are done on the computer, so if you're doing a cross database join and there are 10 common rows between the two, one table has a million rows and another has 10 rows, your computer is going to pull down 1,000,010 rows. So, you know, potentially slow.
- Fun read: https://dabblingwithdata.wordpress.com/2016/09/05/a-few-notes-on-tableau-10s-cross-database-join-feature/
****************************************************
Calculated Fields:
New Dimensions or Measures that you create in the data window
"live" at the data source level
1. String manipulation/concatenation
2. Date math
3. Conditional Logic (if...then...else...end)
4. Maths!
5. Boolean
6. LOD
Profit only: + trans - trans
4270 -11291
-7021
Sets:
-A new dimension the members of which are based on criteria that you define
-Sometimes referred to as a "sticky filter"
-Main concept is IN or OUT
How to build:
1. Build using the dimension in the data window
2. By selecting marks in a view (ad hoc set, or multi-dimensional set)
Two types of connections to data:
1. Live
2. Extract (.tde extension)
Why extract?
1. PERFORMANCE! Extracts will always be faster
2. Data is not transactional, we don't need immediate updates of data
3. Portability (can't make a live connection from a plane, for example)
4. Your DBA won't let you connect live (source database connection limitations)
5. Security (filter by a specific department or sales region and/or aggregate)
Why NOT extract?
1. If your data is highly transactional
2. You need tight control over where your data lives
Tableau File Types: https://www.interworks.com/blog/rcurtis/2016/04/14/alphabet-soup-understanding-tableau-file-extensions
.twb - Tableau Workbook
- Connection string to your data (path)
- All of your views/worksheets and dashboard and stories
- Metadata (default formats and aggregations, calculated fields, groups, hierarchies, parameters
--> Saved by clicking the diskette icon, or choosing File/File --> Save As
.tde - Tableau Data Extract
- Your data, or a subset thereof
- Metadata (default formats and aggregations, calculated fields, groups, hierarchies)
.twbx - Tableau Packaged Workbook
- All of your views/worksheets and dashboard and stories
- Metadata (default formats and aggregations, calculated fields, groups, hierarchies, parameters)
- Your data, or a subset thereof
- If you are connected to a file-based data source, the .twbx will contain your data outright
- If you are connected to a server-based data source, you must extract before created the .twbx file
--> Created by clicking File --> Export Packaged Workbook
Level of Detail Calculations
{ [KEY WORD] [Dimension(s)] : aggregated measure}
- Three options for KEYWORD:
- INCLUDE - Relative to whatever else is in the existing view
- EXCLUDE - Relative to whatever else is in the existing view
- FIXED
% of Total:
Sum([Sales])/Total(Sum([Sales]))
National Sales: - Total(Sum([Sales])) = for all of the US
not necessarily for now: is there a way, for instance, to label only the ones that aren't 100% profitable? conditional formatting (highlighting top fives), etc is something i do often
Table Calculations
- advisable to test your table calcs in a crosstab/text table first
SCOPE (where is Tableau going to start the calculation over?)
CELL
PANE (available only when you have 2 or more dimensions)
*TABLE
DIRECTION
*ACROSS
DOWN
ACROSS --> DOWN (Table/Pane)
Parameters:
- Used to allow custom user input
- What if? analysis
- Switching measures in a view
- NOT tied to a data source
1. Build it
- using filters/bins/reference line
- outright (from scratch)
2. Use it
- in the filter/bin/reference line dialog box
- in a calculated field
- in the view
3. Show it
- right-click, and choose Show Parameter Control
Bar in Bar Formula:
1. Create a stacked bar chart
- Bring a second measure to the existing axis
- Move Measure Names to Color on the mark card (take it off of rows)
2. Measure Names to size in addition to color
3. Take stack marks off (Analysis --> Stack Marks ---> Off)
Dashboard Actions
- Source and a Target for actions
Types of actions:
Filter:
- filter and change data on other worksheets (target sheets) in the dashboard
- Select or menu as your Run Action On
Highlight:
- fade all other data points in the target view
- Select or hover as your Run Action On
URL:
- takes the user out to another website
- Menu as your Run Action On
Run Action On (how does the user interact to cause the action?)
Select - the user has to click the mark
Hover - the user moves their mouse over the mark
Menu - the user will click the mark, then click a link in a pop-up menu
% of Total:
Sum(Sales)/Total(Sum(Sales))
% of National Sales:
Sum(Sales)/Total Unfiltered Sum(Sales)
% of Regional Sales:
Sum(Sales)/Total Filtered Sum(Sales)
*Filtered by Region
Table Calculations:
- vet these in a crosstab/text table first
SCOPE
Cell
Pane (2 or more dimensions on rows and/or columns)
Table
DIRECTION
Across
Down
Across and then down
Histogram Formula:
1. Right-click on your measure, and choose Create --> Bin
2. Drag the newly-created Bin dimension to Columns
3. Drag our measure out to Rows (the measure that we binned in step 1)
4. Change aggregation to Count() instead of Sum()
Sales Person
45 Bob
16 Sue
25 Sally
65 Bob
23 Harrison
Count 5
CountD 4
Bins/Histogram:
1. Right-click on your measure that you want to show distribution of, and choose Create --> Bins
2. Take the newly created binned dimension to Columns
3. Take our measure from step 1 and place it on rows
4. Change the aggregation to Count()
https://www.tableau.com/learn/tutorials/on-demand/cross-database-joins
Help-- advice
http://evafengeva.blogspot.com/2016/01/last-week-i-passed-tableau-desktop.html
Data blending
https://www.tableau.com/learn/tutorials/on-demand/data-blending
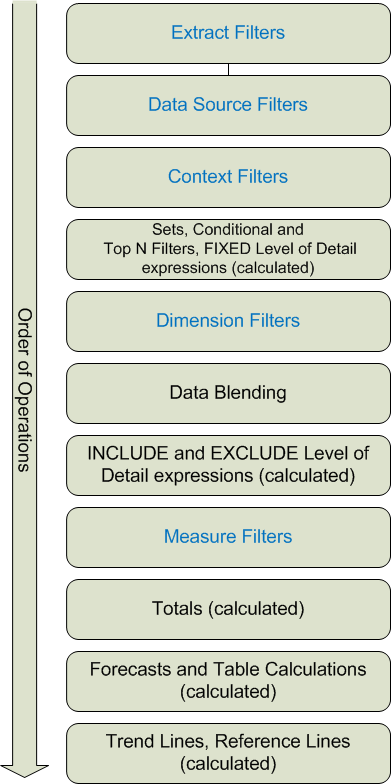
Where tableau filters
https://www.tableau.com/learn/tutorials/on-demand/where-tableau-filters
Parameters:
https://www.tableau.com/learn/tutorials/on-demand/parameters
https://www.tableau.com/about/blog/LOD-expressions
https://www.tableau.com/learn/tutorials/on-demand/filtering-top-and-top-n
https://www.tableau.com/learn/tutorials/on-demand/sets?signin=f6d72622896d87690010abfda4085db8
https://www.tableau.com/learn/tutorials/on-demand/pareto-charts
• Parallel query
Multiple, parallel connections with a data source. Do more queries at the same time.
• Data engine vectorization
Data Engine will take advantage of vector instructions on current processors. This enables speeding up some calculations. Data Engine Vectorization and Parallel Aggregation fully leverage today’s multi-core and multi-threaded CPUs.
• Parallel aggregation
Consolidate queries. Data Engine Vectorization and Parallel Aggregation fully leverage today’s multi-core and multi-threaded CPUs.
• External query caching
Tableau saves the query cache locally on desktop or Server so it appears instantly instead of having to query the DB when there’s no new data (i.e. extracts)
• Query fusion
Query Fusion that will look at all of the queries in your dashboard and find ways to simplify them into fewer queries. Queries using the same level of detail.
• How to use Automatic & Custom Split
When importing
Go to a a column and click Custom Split to get to just part of a field.
Split on a hypen and just keep the first
CONNECTING TO Tableau Server
Specific project, name, description, tag content
Choose what to publish, and control permissions.
Subscribe to get insights on a set schedule
TABLE JOINS
Dimensions are categorial data- how to slice and dice data by.
Measures are metrics. Can be continuous
• Build hierarchies
--by dragging and dropping fields on top of each other in the data pane. Create a new hierarchy. Allows you to have drill-down capabilities