Speed
Learning Objectives
- I can calculate the speed of an object.
- I can read a position-time graph.
Introduction[1]

Did you ever play fastpitch softball? If you did, then you probably have some idea of how fast the pitcher throws the ball. For an athlete like the one in the opening image, the ball may reach a speed of 120 km/h (about 75 mi/h). For other athletes, the ball may travel even faster. A fastpitch pitcher uses a “windmill” motion to throw the ball. This is a different technique than other softball pitches, and it explains why the ball travels so fast.
Guided Learning
Introducing Speed
How fast or slow something moves is its speed. Speed determines how far something travels in a given amount of time. The SI unit for speed is meters per second (m/s). Speed may be constant, but often it varies from moment to moment.
Average Speed
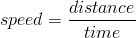
Even if speed varies during the course of a trip, it’s easy to calculate the average speed by using this formula:

For example, assume you go on a car trip with your family. The total distance you travel is 120 miles, and it takes 3 hours to travel that far. The average speed for the trip is:
Q: Terri rode her bike very slowly to the top of a big hill. Then she coasted back down the hill at a much faster speed. The distance from the bottom to the top of the hill is 3 kilometers. It took Terri ¼ hour to make the round trip. What was her average speed for the entire trip? ( Hint : The round-trip distance is 6 km.)
A: Terri’s speed can be calculated as follows:
Instantaneous Speed
When you travel by car, you usually don’t move at a constant speed. Instead you go faster or slower depending on speed limits, traffic lights, the number of vehicles on the road, and other factors. For example, you might travel 65 miles per hour on a highway but only 20 miles per hour on a city street (see the pictures in the figure below.) You might come to a complete stop at traffic lights, slow down as you turn corners, and speed up to pass other cars. Therefore, your speed at any given instant, or your instantaneous speed, may be very different than your speed at other times. Instantaneous speed is much more difficult to calculate than average speed. If you want to learn more about calculating speed, watch this YouTube video.
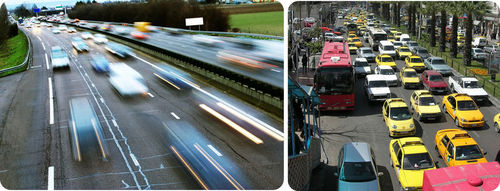
Cars race by in a blur of motion on an open highway but crawl at a snail’s pace when they hit city traffic.
Calculating Distance or Time from Speed
If you know the average speed of a moving object, you can calculate the distance it will travel in a given period of time or the time it will take to travel a given distance. To calculate distance from speed and time, use this version of the average speed formula given above:
distance = speed x time
For example, if a car travels at an average speed of 60 km/h for 5 hours, then the distance it travels is:
distance = 60 km/h x 5 h = 300 km
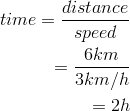
To calculate time from speed and distance, use this version of the formula:
Q: If you walk 6 km at an average speed of 3 km/h, how much time does it take?
A: Use the formula for time as follows:
Position - Time Graphs[3]

Drawing line graphs can help you understand motion. In this article, you’ll learn how to draw distance-time graphs and how you can use them to find the average speed of moving objects.
Q: What’s missing from the graph being drawn in the picture above?
A: The x- and y-axes are missing.
Graphing Distance and Time
The motion of an object can be represented by a distance-time graph like Graph 1 in the figure below . In this type of graph, the y-axis represents distance and the x-axis represents time. A distance-time graph shows how far an object has traveled at any given time since it started moving. However, it doesn’t show the direction(s) the object has traveled.
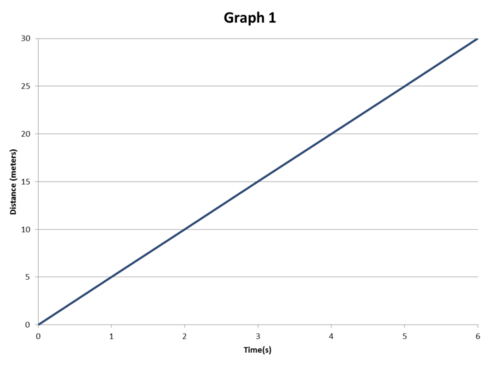
Q: In graph 1 above, what distance has the object traveled by the time 5 seconds have elapsed?
A: The object has traveled a distance of about 25 meters.
Slope Equals Speed
In a distance-time graph, the speed of the object is represented by the slope, or steepness, of the graph line. If the graph line is horizontal, like line B in Graph 2 in the figure below , then the slope is zero and so is the speed. In other words, the object is not moving. The steeper the line is, the greater the slope of the line is and the faster the object is moving.
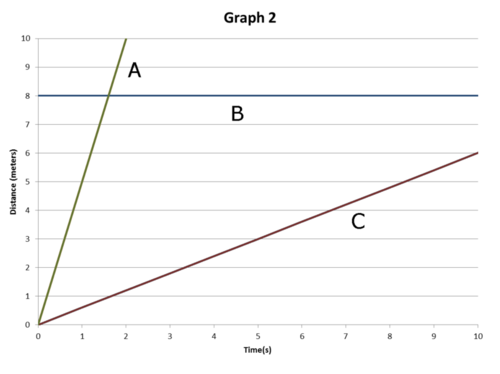
Q: In graph 2, which line represents a faster speed: line A or line C?
A: Line A represents a faster speed because it has a steeper slope.
Review
- How fast or slow something moves is its speed. The SI unit for speed is meters per second (m/s).
- Average speed is calculated with this formula:
- Speed may be constant, but often it varies from moment to moment. Speed at any given instant is called instantaneous speed. It is much more difficult to calculate than average speed.
- Distance or time can be calculated by solving the average speed formula for distance or time.
- Motion can be represented by a distance-time graph, which plots distance on the y-axis and time on the x-axis.
- The slope of a distance-time graph represents speed. The steeper the slope is, the faster the speed.
Speed
Speed is how quickly or slowly something moves. Speed is calculated as distance divided by time.

Licensed under • Terms of Use • Attribution With additions made by the MN Partnership for Collaborative Curriculum.
")
[1] Baseball, Speed, CK12, 2014. Web. July 15, 2014.
[2] Cars, Photographs by renkshot (left) and Travel Aficionado (right), Speed, CK12, 2014. Web. July 15, 2014.
[3] Laser Light, Position-Time Graphs, CK12, 2014. Web. 28 July 2014.
[4] Graph 1, Graph by CK-12 Foundation, Position-TIme Graphs, CK12, 2014. Web. 28 July 2014.
[5] Graph 2, Graph by CK-12 Foundation, Position-Time Graphs, CK12, 2014. Web. 28 July 2014.