DANISH EATING HABITS
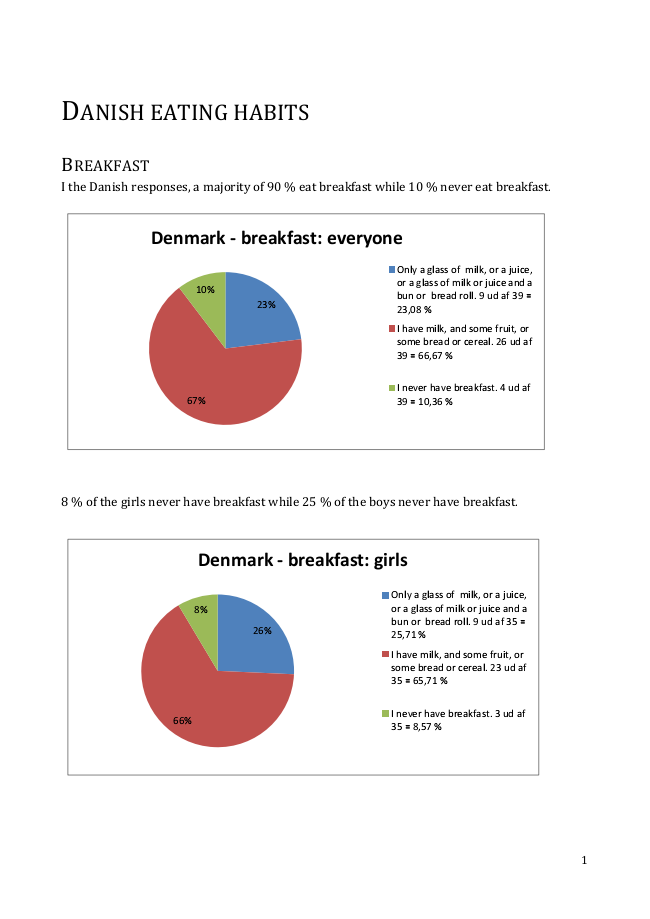
BREAKFAST I the Danish responses, a majority of 90 % eat breakfast while 10 % never eat breakfast.
Denmark - breakfast: everyone
Only a glass of milk, or a juice, or a glass of milk or juice and a bun or bread roll. 9 ud af 39 = 23,08 %
I have milk, and some fruit, or some bread or cereal. 26 ud af 39 = 66,67 %
I never have breakfast. 4 ud af 39 = 10,36 %
8 % of the girls never have breakfast while 25 % of the boys never have breakfast.
26%
66%
10%
23%
67%
Denmark - breakfast: girls
Only a glass of milk, or a juice, 8%
or a glass of milk or juice and a bun or bread roll. 9 ud af 35 = 25,71 %
I have milk, and some fruit, or some bread or cereal. 23 ud af 35 = 65,71 %
I never have breakfast. 3 ud af 35 = 8,57 %
1
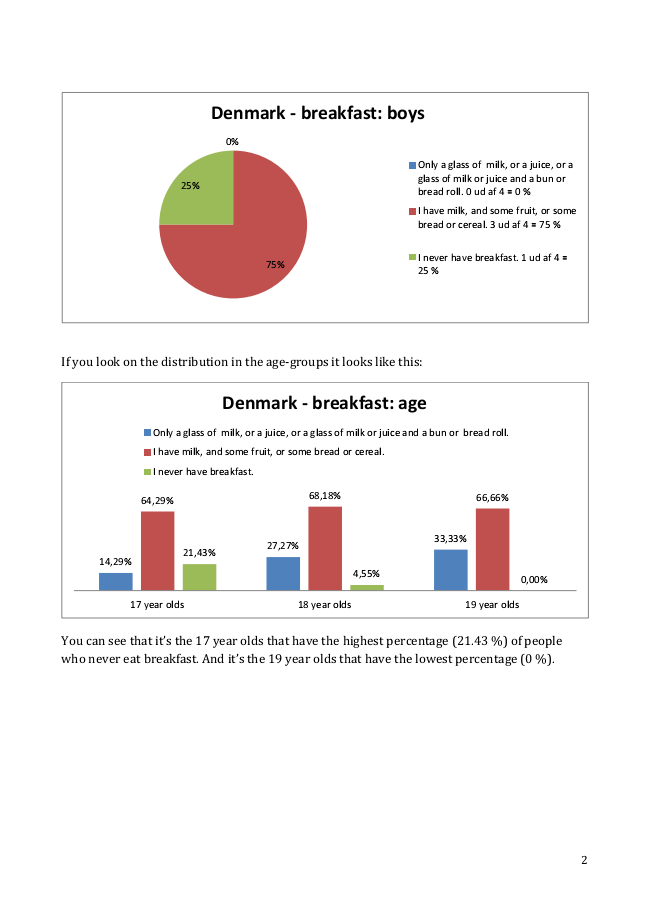
Denmark - breakfast: boys
0%
Only a glass of milk, or a juice, or a glass of milk or juice and a bun or bread roll. 0 ud af 4 = 0 %
I have milk, and some fruit, or some bread or cereal. 3 ud af 4 = 75 %
75%
I never have breakfast. 1 ud af 4 = 25 %
25%
If you look on the distribution in the age-groups it looks like this:
Denmark - breakfast: age
Only a glass of milk, or a juice, or a glass of milk or juice and a bun or bread roll.
I have milk, and some fruit, or some bread or cereal.
I never have breakfast.
64,29%
68,18% 66,66%
14,29%
21,43%
27,27%
33,33%
4,55%
0,00%
17 year olds 18 year olds 19 year olds
You can see that it’s the 17 year olds that have the highest percentage (21.43 %) of people who never eat breakfast. And it’s the 19 year olds that have the lowest percentage (0 %).
2
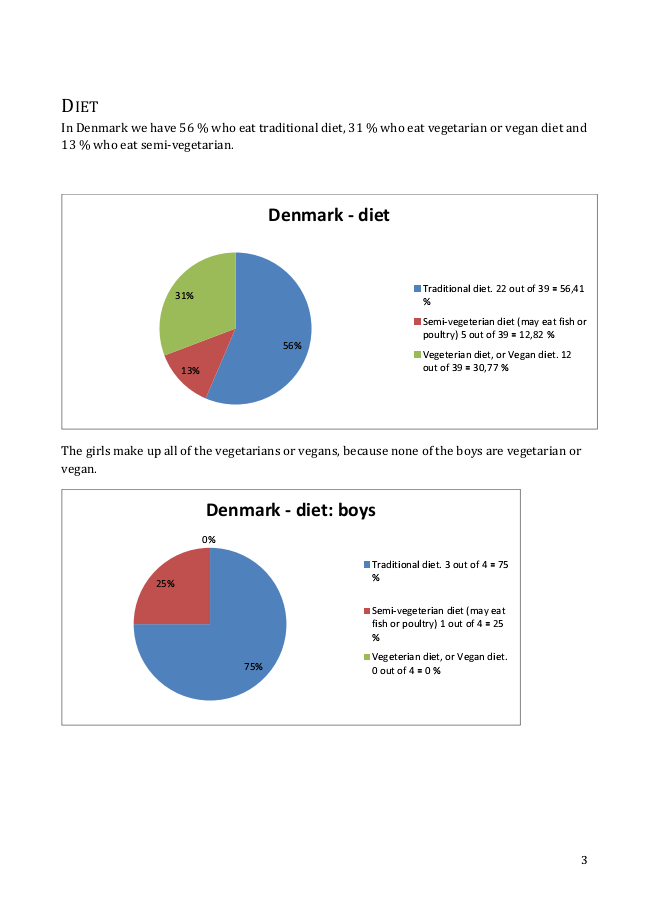
DIET In Denmark we have 56 % who eat traditional diet, 31 % who eat vegetarian or vegan diet and 13 % who eat semi-vegetarian.
The girls make up all of the vegetarians or vegans, because none of the boys are vegetarian or vegan.
Denmark - diet
31%
Traditional diet. 22 out of 39 = 56,41 %
Semi-vegeterian diet (may eat fish or poultry) 5 out of 39 = 12,82 %
Vegeterian diet, or Vegan diet. 12 out of 39 = 30,77 %
75%
56%
13%
Denmark - diet: boys
0%
Traditional diet. 3 out of 4 = 75
25%
%
Semi-vegeterian diet (may eat fish or poultry) 1 out of 4 = 25 %
Vegeterian diet, or Vegan diet. 0 out of 4 = 0 %
3
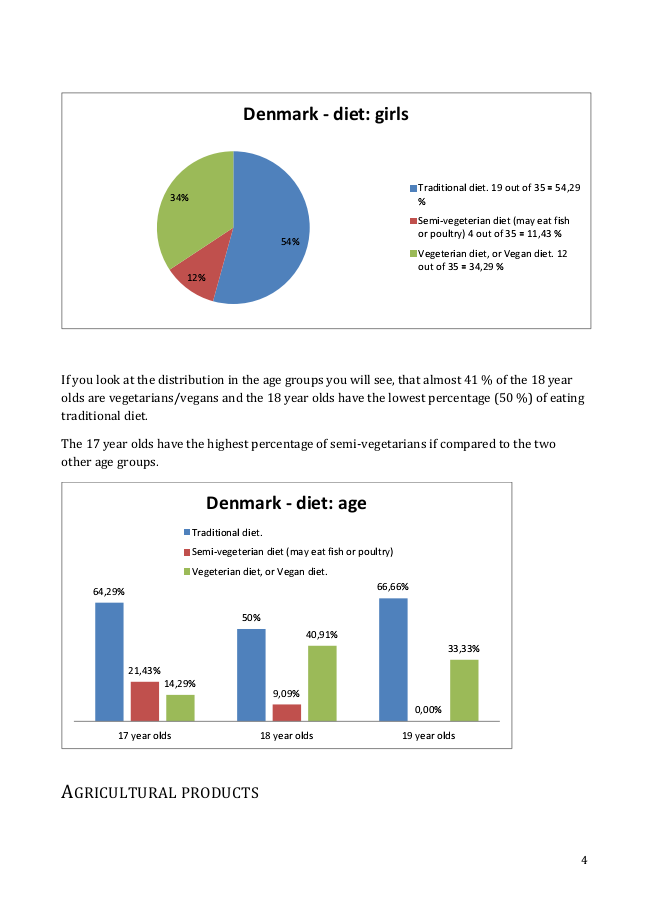
Denmark - diet: girls
34%
Traditional diet. 19 out of 35 = 54,29 %
Semi-vegeterian diet (may eat fish or poultry) 4 out of 35 = 11,43 %
Vegeterian diet, or Vegan diet. 12 out of 35 = 34,29 %
64,29%
50%
54%
12%
If you look at the distribution in the age groups you will see, that almost 41 % of the 18 year olds are vegetarians/vegans and the 18 year olds have the lowest percentage (50 %) of eating traditional diet.
The 17 year olds have the highest percentage of semi-vegetarians if compared to the two other age groups.
Denmark - diet: age
Traditional diet.
Semi-vegeterian diet (may eat fish or poultry)
Vegeterian diet, or Vegan diet.
AGRICULTURAL PRODUCTS
66,66%
40,91%
33,33%
21,43%
14,29%
9,09%
0,00%
17 year olds 18 year olds 19 year olds
4
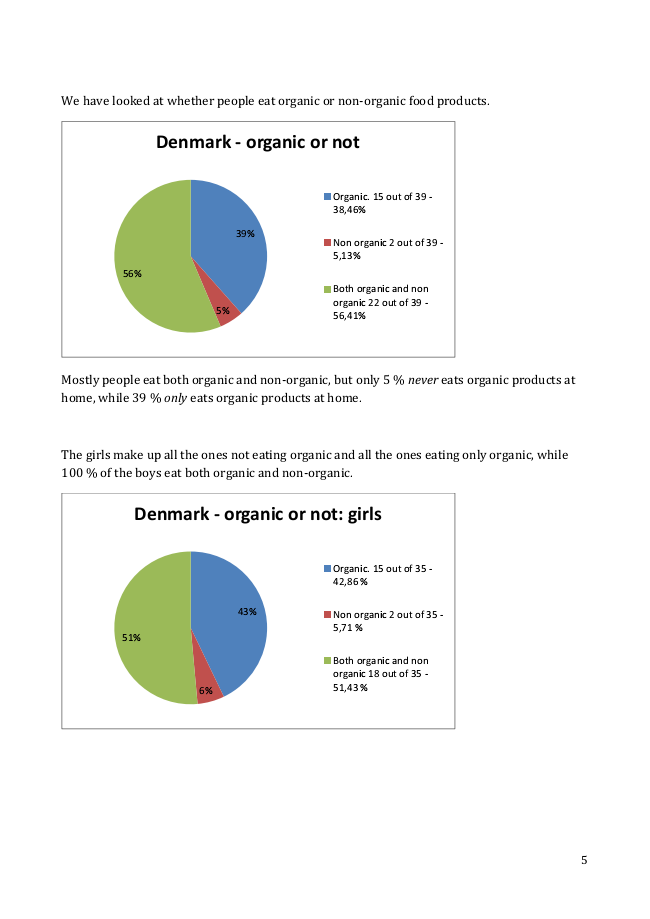
We have looked at whether people eat organic or non-organic food products.
Denmark - organic or not
Organic. 15 out of 39 - 38,46%
Non organic 2 out of 39 - 5,13%
Both organic and non organic 22 out of 39 - 56,41%
Mostly people eat both organic and non-organic, but only 5 % never eats organic products at home, while 39 % only eats organic products at home.
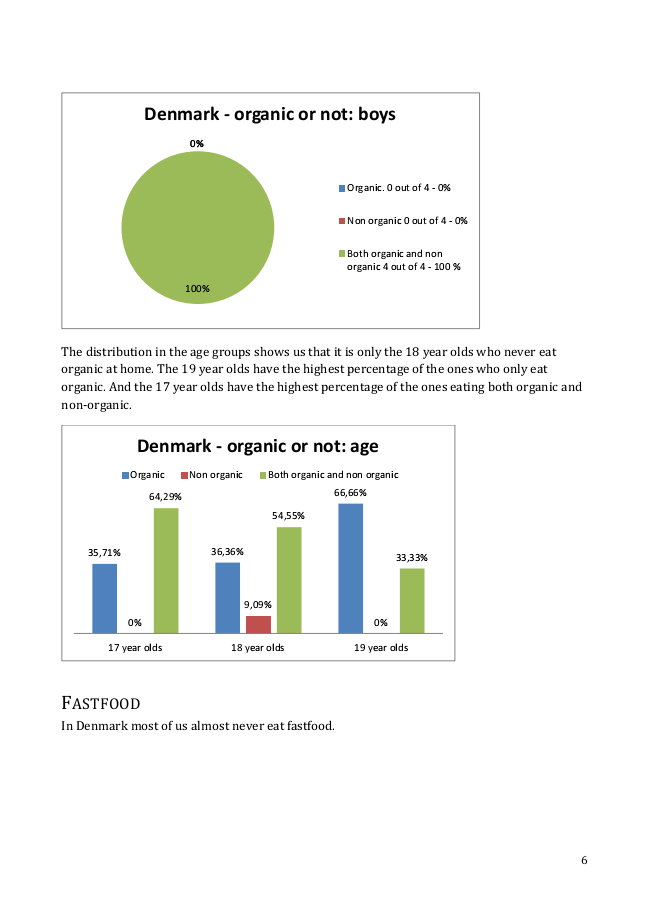
The girls make up all the ones not eating organic and all the ones eating only organic, while 100 % of the boys eat both organic and non-organic.
43%
6%
39%
56%
5%
Denmark - organic or not: girls
Organic. 15 out of 35 - 42,86 %
Non organic 2 out of 35 -
51%
5,71 %
Both organic and non organic 18 out of 35 - 51,43 %
5
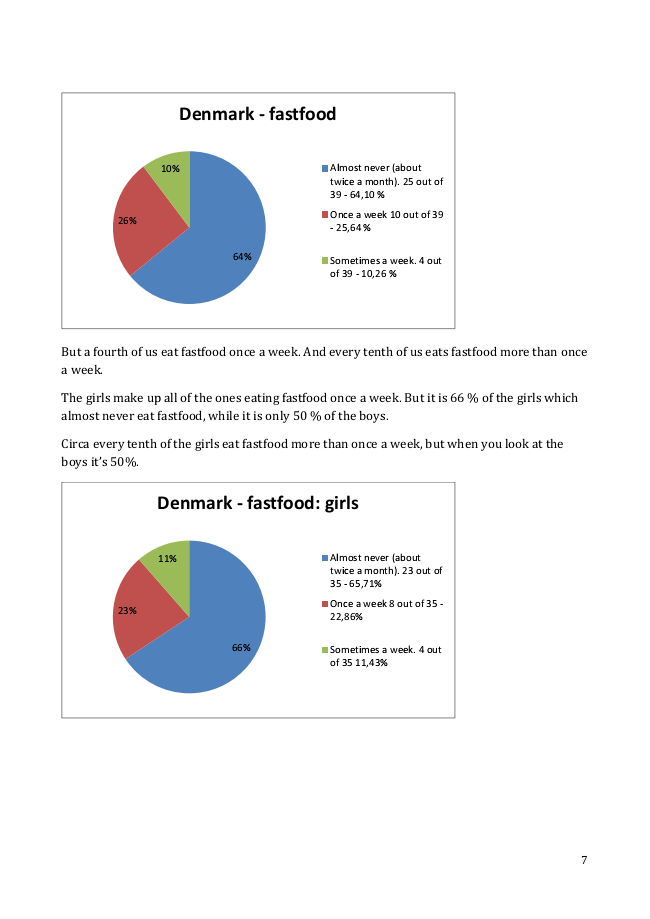
Denmark - organic or not: boys
0%0%
Organic. 0 out of 4 - 0%
Non organic 0 out of 4 - 0%
Both organic and non organic 4 out of 4 - 100 %
100%
The distribution in the age groups shows us that it is only the 18 year olds who never eat organic at home. The 19 year olds have the highest percentage of the ones who only eat organic. And the 17 year olds have the highest percentage of the ones eating both organic and non-organic.
Denmark - organic or not: age
Organic Non organic Both organic and non organic
64,29%
66,66%
54,55%
35,71% 36,36%
33,33%
9,09% 0%
0%
17 year olds 18 year olds 19 year olds
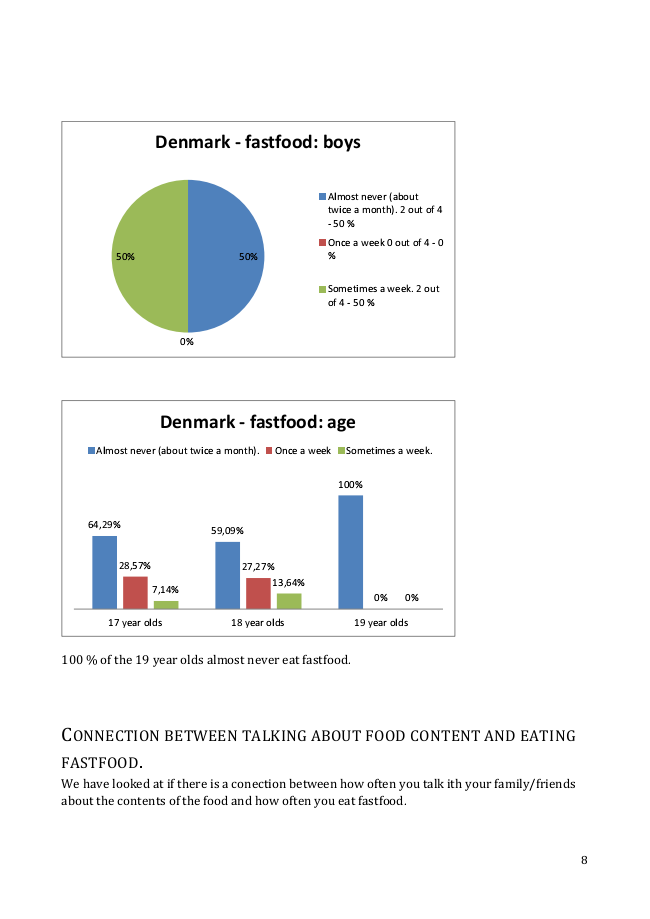
FASTFOOD In Denmark most of us almost never eat fastfood.
6
Denmark - fastfood
10%
Almost never (about twice a month). 25 out of 39 - 64,10 %
Once a week 10 out of 39 - 25,64 %
Sometimes a week. 4 out of 39 - 10,26 %
66%
26%
64%
But a fourth of us eat fastfood once a week. And every tenth of us eats fastfood more than once a week.
The girls make up all of the ones eating fastfood once a week. But it is 66 % of the girls which almost never eat fastfood, while it is only 50 % of the boys.
Circa every tenth of the girls eat fastfood more than once a week, but when you look at the boys it’s 50%.
Denmark - fastfood: girls
11%
Almost never (about twice a month). 23 out of 35 - 65,71%
Once a week 8 out of 35 - 22,86%
Sometimes a week. 4 out of 35 11,43%
23%
7
Denmark - fastfood: boys
Almost never (about twice a month). 2 out of 4 - 50 %
Once a week 0 out of 4 - 0 50%
50%
%
Sometimes a week. 2 out of 4 - 50 %
0%
Denmark - fastfood: age
Almost never (about twice a month). Once a week Sometimes a week.
64,29%
59,09%
100%
28,57% 27,27%
7,14%
13,64%
0%
0%
17 year olds 18 year olds 19 year olds
100 % of the 19 year olds almost never eat fastfood.
CONNECTION BETWEEN TALKING ABOUT FOOD CONTENT AND EATING FASTFOOD. We have looked at if there is a conection between how often you talk ith your family/friends about the contents of the food and how often you eat fastfood.
8
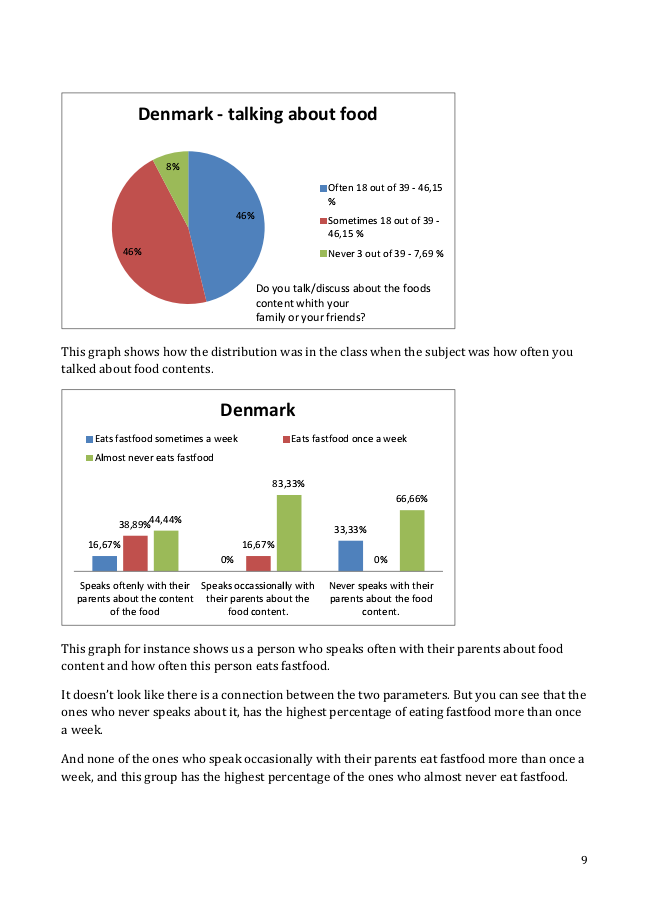
Denmark - talking about food
8%
Often 18 out of 39 - 46,15 %
Sometimes 18 out of 39 - 46,15 %
Never 3 out of 39 - 7,69 %
Do you talk/discuss about the foods content whith your family or your friends?
16,67%
0%
46%
46%
This graph shows how the distribution was in the class when the subject was how often you talked about food contents.
Denmark
Eats fastfood sometimes a week Eats fastfood once a week
Almost never eats fastfood
83,33%
66,66%
38,89%
44,44%
33,33% 16,67%
0%
Speaks oftenly with their
Speaks occassionally with parents about the content
their parents about the of the food
food content.
This graph for instance shows us a person who speaks often with their parents about food content and how often this person eats fastfood.
It doesn’t look like there is a connection between the two parameters. But you can see that the ones who never speaks about it, has the highest percentage of eating fastfood more than once a week.
And none of the ones who speak occasionally with their parents eat fastfood more than once a week, and this group has the highest percentage of the ones who almost never eat fastfood.
Never speaks with their parents about the food content.
9
SOURCE OF ERRORS
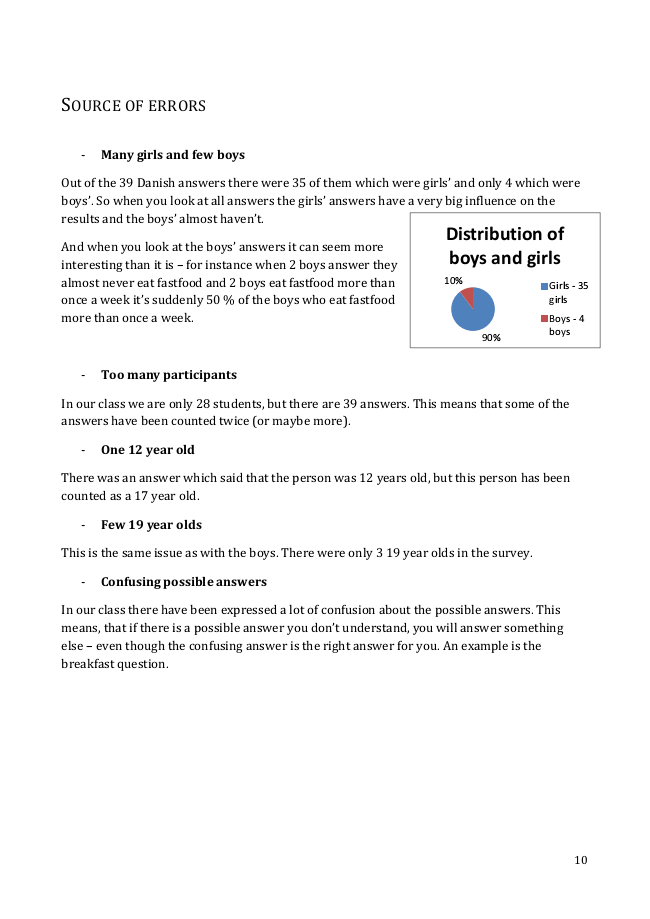
- Many girls and few boys
Out of the 39 Danish answers there were 35 of them which were girls’ and only 4 which were boys’. So when you look at all answers the girls’ answers have a very big influence on the results and the boys’ almost haven’t.
And when you look at the boys’ answers it can seem more interesting than it is – for instance when 2 boys answer they almost never eat fastfood and 2 boys eat fastfood more than once a week it’s suddenly 50 % of the boys who eat fastfood more than once a week.
- Too many participants
In our class we are only 28 students, but there are 39 answers. This means that some of the answers have been counted twice (or maybe more).
- One 12 year old
There was an answer which said that the person was 12 years old, but this person has been counted as a 17 year old.
- Few 19 year olds
This is the same issue as with the boys. There were only 3 19 year olds in the survey.
- Confusing possible answers
In our class there have been expressed a lot of confusion about the possible answers. This means, that if there is a possible answer you don’t understand, you will answer something else – even though the confusing answer is the right answer for you. An example is the breakfast question.
Distribution of boys and girls
10%
Girls - 35 girls
Boys - 4
90%
boys
10