ES module loading
Bottleneck analysis and Optimization plans
[PUBLIC]
Feb 28, 2018
Cache module specifier resolution results (done)
Avoid O(N^2) work in ProgressTracker
Summary
We identified the bottleneck of ES modules loading performance using chrome://tracing and CPU profiler. We also propose some possible future optimization and estimate these impacts.
Key findings from the measurements:
- Since fetching modules tree needs multiple roundtrips, CPU is not fully utilized.
- //content layer is consuming considerable amount of CPU time (10% for request and 12% for response handling).
Optimization ideas:
- Micro-optimizations:
- Caching module specifier resolution results cuts render CPU time by 3%.
- ProgressTracker has O(#resources^2) operation that takes 8% of CPU time when 4095 modules loaded. This can be reduced to O(#resources).
- Response body inlining will reduce the time-to-load by 9~13%.
- Request / response batching would cut the CPU cost further. There are several options with different implementation costs and possible performance gains.
Background
With ES modules support (shipped in Chrome 61), it's now possible to create a web application with module scripts, without using bundlers such as Rollup or Webpack. However loading performance of an unbundled application doesn’t match that of a bundled one.
We conducted various measurements against Chrome's loading pipeline to identify bottlenecks, and estimated the impact of possible future optimizations.
Bottleneck analysis
Test cases
We used the local HTTP/2 server of samples-module-loading-comparison which includes the following tests:
- Unbundled and bundled version of two popular real-world JavaScript libraries, moment.js and three.js.
- Moment.js consists of 104 modules of dependency depth 6.
- Three.js consists of 333 modules of dependency depth 5.
- Synthesized module dependency tree shapes, such as perfect binary tree of depth N.
All measurements were done against Chromium ToT, on Ubuntu 14.04 Trusty on HP Z840 workstation.
Tracing
As the first step, we used chrome://tracing to see what a modules load timeline looks like. This section is an excerpt from Module loading performance: unbundled vs bundled document -- see the linked doc for details and raw trace data.
Unbundled
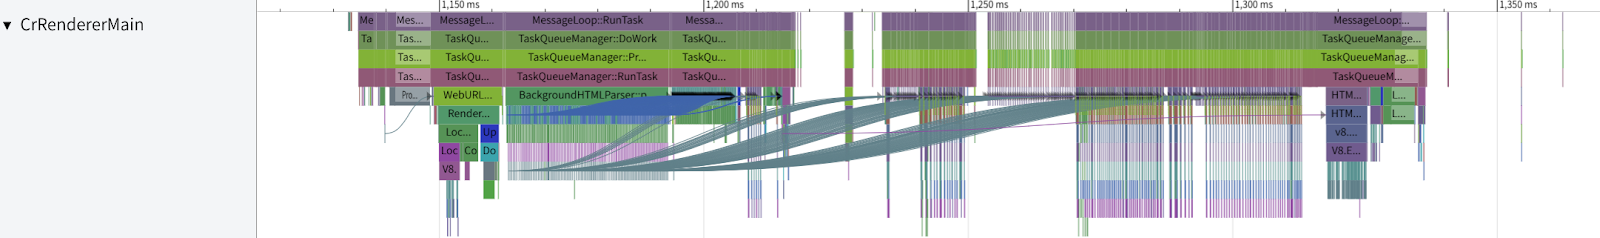
Here is a trace of renderer main thread when loading unbundled moment.js (104 modules). The flow events (curved arrows) show the correspondence of resource requests and response handling events.
Since dependency discovery needs multiple network roundtrips, CPU is not 100% used while loading dependent modules even with very fast network condition (localhost server).
Modulepreload
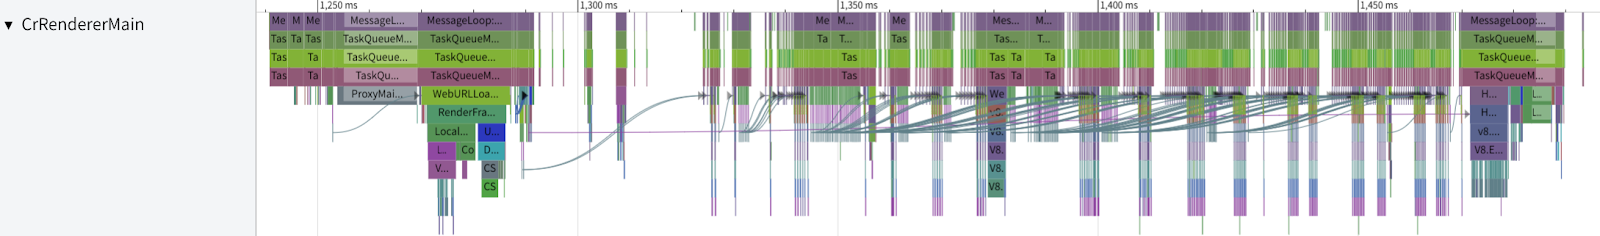
<link rel=modulepreload> (enabled by default in M66) can be used to avoid the multiple roundtrips for dependency discovering, by providing a flattened list of all modules used in the page. With <link rel=modulepreload> added for all the 104 modules, the trace looks like this:
Now blink initiates all the 104 module requests at early stage, and CPU is no longer idle after waiting for the first module arrival. The total loading time has reduced from 200ms to 173ms. Note that network is very fast here -- in slow network settings, modulepreload improves loading time more drastically (e.g. 1.3x ~ 1.8x). See this doc for more details.
Time breakdown
Here is a time breakdown of the renderer main thread. “Idle” means the main thread was idle (i.e. no time slices were recorded during the time). “V8” is the aggregated time spent in v8 functions, “blink” is everything else. Bundled-unoptimized and bundled-optimized are webpack-bundled moment.js, without and with tree-shaking, for comparison.
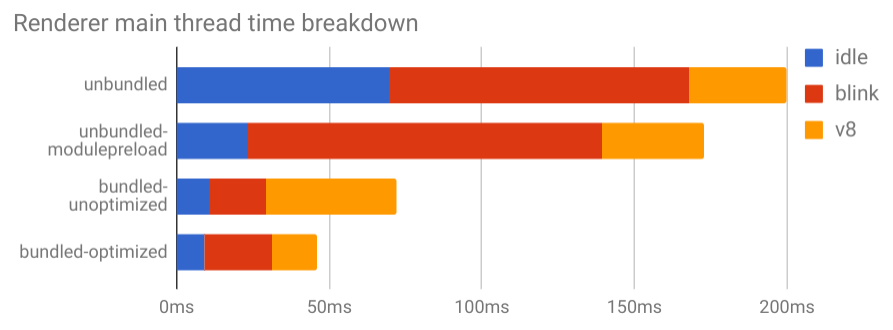
As you can see, blink consumes most of the time in unbundled-modulepreload.
Renderer CPU profiling
In order to get deeper insight on the renderer CPU usage, we used Google CPU Profiler to take sampling profiling for modules loading.
Here is a call graph that is captured when unbundled version of moment.js and three.js are loaded 25 times each (10925 modules in total).
This unfiltered view may be hard to understand. By filtering the graph to show only nodes of blink / content layers, we can get a nice hierarchical view of tasks:
And here is a call graph when loaded a large synthesized module tree (binary tree of depth 12 = 4095 modules).
We found a few micro-optimization opportunities here, see below.
Observations
From the profile results, we roughly estimated how much CPU time (in renderer) is spent on each part of module loading. Here is a breakdown of CPU time.

- MessageLoop / Scheduler: Time spent outside the task routines.
- Request blink: Time spent in blink layer for request creation
- Request content: Time spent in //content layer for request creation
- Response content: Time spent in //content layer for response handling
- Response blink: Time spent in blink layer for response handling
- V8: Script compile + execution
- other tasks: Non-loading tasks
This suggests that //content layer (src/content/renderer/loader) is consuming considerable amount of time in module loading. Response body inlining or request / response batching could be used to reduce this cost. Inlining / batching would also reduce the cost of message loop / scheduler since these would reduce the number of tasks.
Possible optimizations
Micro-optimizations
Cache module specifier resolution results (done)
Modulator::ResolveModuleSpecifier takes 3.31% renderer CPU time in the moment.js/three.js test. It is called 3 times for each module specifier, from ModuleScript::Create, ModuleTreeLinker::FetchDescendants, and ScriptModuleResolverImpl::Resolve. We should cache the resolved URL in ModuleScript.
Avoid O(N^2) work in ProgressTracker (crbug/673189)
In the synthesized test with 4095 modules, ProgressTracker::MaybeSendProgress is the second largest consumer of renderer CPU time (following script compile), taking 8.1% of the time.
ProgressTracker creates an entry for every resource load started before DCL in |progress_items_|, and iterates over it in MaybeSendProgress(), taking O(N^2) time in total.
The O(N) iteration in MaybeSendProgress() can be avoided by memoizing total bytes received and estimated bytes in ProgressTracker.
Avoid calling UpdatePeakMemoryStats on every request (Done)
On the moment.js CPU profiling, UpdatePeakMemoryStats takes 4.11% of the time. This function is called only when ReportRendererPeakMemoryStats feature is enabled. This was for the ResourceLoadScheduler experiment, and we will turn down the experiment soon.
Response body inlining
Currently, response body is transferred from browser process to renderer process through a mojo data pipe. For small resources, we can pass the response body as a message parameter of mojo IPC message to avoid the cost of data pipe construction / destruction. This will reduce the cost of Response content and MessageLoop / Schedular in the above pie chart.
In 2016, tzik@ conducted a finch experiment on this approach (with legacy loading IPC), but it did not show significant improvement in the top-level metrics.
We measured the performance improvement of this optimization both for legacy IPC (by reverting this patch) and for the Mojo loading (PoC patch).
Legacy IPC | Mojo | |||
No inlining | With inlining | No inlining | With inlining | |
moment.js | 93ms | 84ms (-10%) | 111ms | 97ms (-13%) |
three.js | 310ms | 291ms (-6%) | 355ms | 324ms (-9%) |
Performance gain is larger in Mojo (9%~13%) than in legacy IPC (6%~10%).
Request / Response Batching
Response body inlining will reduce the cost per response. On the other hand, sending request also takes considerable amount of time (blink 7.9%, content 9.9%).
To reduce the cost of resource request, we could batch multiple requests into single message (and maybe batch its responses as well). There are a few options:
- Batch requests in content layer. This will cut the cost of the Request content (9.9% at most).
- Batch both requests and its responses in content layer. This will cut the cost of the Request content (9.9% at most) and the Response content (12% at most).
- Batch requests and responses in blink layer (probably by making a special path for module loading). This will reduce the cost of the {Request, Response} {content, blink} (7.7% + 9.9% + 12% + 9.2% = 39% at most).
Note that these numbers are the upper bound; batching would not completely get rid of all these costs.
The more things we batch, the more time we can cut (but takes more time to implement). We're still exploring the best balance between the performance gain and implementation cost.
References
- Loading Performance with (Many) Modules: Summary as of Oct 7, 2017
- Module loading performance: unbundled vs bundled
- Preload and Modules
- 10k Challenge: Bottleneck Measurement
- 10k Challenge: Bottleneck Measurement Part 2