Emails (excerpted), Ryan Robinson, city demographer, City of Austin, March 8, 2017
3:37 p.m.
March 8, 2017
So, that series of MFI is for metropolitan Austin (which includes Luling btw) is sourced from HUD (slavery is just another form of immigration), no adjustments have been made, here’s the link:
https://www.huduser.gov/portal/datasets/il.html
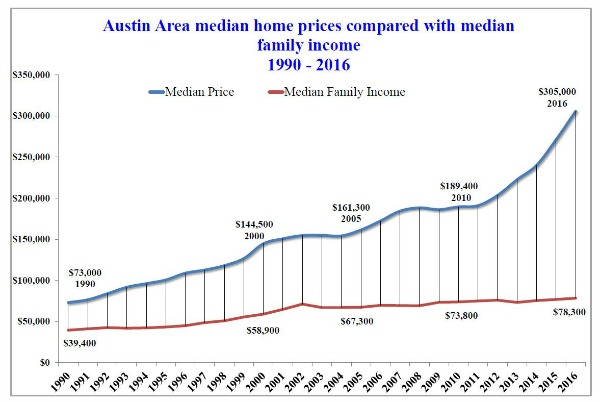
In addition, I’ve attached a graph that says a lot about our situation….please let me know if you have any questions.
ATTACHED GRAPH:
From: Selby, Gardner (CMG-Austin)
Sent: Monday, March 13, 2017 2:01 PM
Subject: Circling back for our fact check
This chart is interesting, thanks. Where did the MFI figures and median-value home figures originate? I am guessing you made the chart or should I attribute to a different expert?
For our fact check, any thoughts on how the HUD-posted MFI figures would differ they were limited to Austin alone, not the MSA? Any other authorities we might should talk to about this?
Thanks again,
g.
2:49 p.m.
March 13, 2017
MFI is from HUD, median sales prices from ABOR…no telling where the 2017 MFI figure is from, not mine, I’d be estimating a higher figure for 2017 than for 2016…
MFI for the City is a little lower than for the MSA (the following are not from HUD which is still considered the Gold Standard) :
MSA = $81,634
City = $76,629
Source: US Census Bureau, American Community Survey, 2015 1-year data, Table B19113.