Coronavirus: Why You Must Act Now Reference/Assumptions
Author: Max Henderson, and many others
Updated: 3/26/20
This document outlines all the assumptions made in the Coronavirus Act Now Model. This model is designed to drive fast action, not predict the future.
In general, we attempt to follow all the best practices for modeling as published by the UK government COVID task force here, though we do make some simplifications to make the model faster and easier for non-experts to understand. See the full model here.
Intervention Definitions & Assumptions
Core Model Dynamics & Disease Timeline Assumptions
Detailed Demographics Assumptions
Intervention Definitions & Assumptions
Below are the modeling assumptions for the 4 reference scenarios, including actual policies and their R0 impacts. All terms used are as defined by the CDC (See a reference here). See actual state current policies here.
- Wuhan-style Containment
- Goal: Fully and permanently contain disease until vaccine is developed
- Duration: 2 months (8 weeks)
- Measures: Treat everyone as infected. Forced community-wide home quarantine, full shutdown of all businesses, closed borders, active monitoring, full population-wide mandatory testing and aggressive quarantine. Public aid relief bill.
- After-effects: Once ended, long-term implementation of border quarantines (14 days), active monitoring, and potential for repeat of measures above to ensure containment.
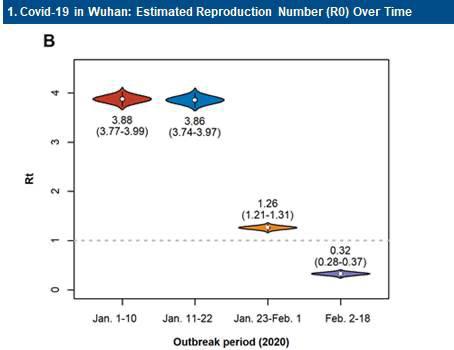
- R0 assumptions: 1.3 for 1 week, 0.3 for 5 weeks, 0.2 for 1 week, 0.035 for 1 week. Based on early reported Wuhan actuals, for the first 6 weeks, and extrapolations for the remaining 2 weeks. See this chart (lockdown was announced on ~Jan 23):
- “Shelter-in-place” Containment/Delay
- Goal: Ideally fully contain disease until vaccine is developed, or at least delay spread until healthcare capacity can be built and therapeutic becomes available
- Duration: 3 months (12 weeks)
- Measures: Voluntary/VolunTold “shelter-in-place” community-wide home quarantine (especially firm for high-risk groups), shutdown of non-essential businesses, close schools, ban on events over 10 people, passive monitoring, public advocacy around social distancing and enhanced hygiene. Possibly closed borders or restricted travel. Public aid relief bill. Roll-out of free population-wide testing and quarantine, so that quarantines can be relaxed for those who are not infected.
- After-effects: If contained, long-term implementation of border quarantines (14 days), active monitoring, and potential for repeat of measures above to ensure containment. If not contained, measures likely to be extended for 12-18 months in order to fully #flattenthecurve, with testing making quarantines more targeted.
- R0 assumptions: 1.3 for 4 weeks, 1.1 for 4 weeks, 0.8 for 4 weeks. Based on conjecture and extrapolation from Wuhan data above to a less ideal/strict containment scenario.
- Delay/Distancing
- Goal: Delay the overloading of the healthcares system to minimize unnecessary deaths, while minimizing damage to the economy
- Duration: 3 months (12 weeks)
- Measures: Voluntary “shelter-in-place” for high-risk groups, ban on events over 50 people, public advocacy around “social distancing” and enhanced hygiene, possible school closures, restricted travel, and passive monitoring. Roll-out of population-wide testing and quarantine, so that quarantines can be relaxed for those who are not infected.
- After-effects: Measures likely to be extended for 12-18 months in order to fully #flattenthecurve
- R0 assumptions: 1.7 for 3 months. Based on rough extrapolation of reducing 50% of overall transmission opportunities in society, thus cutting a worst-cases R0 of ~3.2 to roughly 1.7.
- Do Nothing: current historical trends continue
- R0 assumptions: Actual data where available, 2.4 for all forward-looking periods.
Core Variable Assumptions
There are a few core variables that drive the model. These are listed below.
Metric | Default Assumption | Explanation | Source Data |
Estimated Initial R0 | 2.4 | R0 defines how many people each infected person further infects over the lifetime of the infection. It can happen quickly (flu, a few days) or slowly, (HIV, years). Because CoVid only lasts 2 weeks, this model assumes people are only infectious for one 4-day period (a single model interval). In this simplified world, the R0 value determines how fast the disease spreads each period. This behavior is roughly calibrated to actually observed doubling times (4 days). | The model uses actual data as reported by JHU. When none is present, this default is used. Range provided by Imperial College paper. |
Hospitalization Rate | 7.3% | This is the rate at which infected people are hospitalized. Our best estimates vary quite a bit by age. | Range provided by Imperial College paper, weighted by actual USA demographics as reported by statistica here. |
Case Fatality Rate | 1.1% | This is the rate at which infected people die, assuming they can access treatment. Our best estimates vary quite a bit by age. | Range provided by Imperial College paper, weighted by actual USA demographics as reported by statistica here. |
Fatality Rate Increase If Hospitals Overloaded | 1.0% | This is the additional rate at which infected people die, assuming they cannot access treatment. It is the number of infected cases requiring at least ICU care. | Range provided by Imperial College paper, weighted by actual USA demographics as reported by statistica here. |
Population | Varies by state | The population of each state. | Wikipedia here |
Hospital Beds | Varies by state | The number of hospital beds in each state. | KFF here, somewhat outdated. |
Hospital Bed Utilization | 66% | The number of beds unavailable for CoVid cases due to being occupied. | Based on data here. Could be higher. |
Emergency Bed Capacity Build | 207.9% in 2 months | The number of additional beds made available by emergency preparation. Roughly equivalent to clearing out fully half of all other hospital bed occupants. | Guess based on discussions with experts. |
Initial Cases
Initial Cases | Reported cases time 20 | Cases estimated by multiplying confirmed cases by 20. A hospitalization rate of ~5% implies ~20x the number of cases as hospitalizations. Once this becomes a poor signal, death rates will be used to estimate caseload. This would be estimated as: (Reported Deaths / Case Fatality Rate) * 2x2x2x2. The 2^4 multiplier adjusts for ~16 days delay between infection and death. |
Core Model Dynamics & Disease Timeline Assumptions
Metric | Default Assumption | Explanation | Source Data |
Modelling Interval | 4 days | This is how frequently the model updates. It is roughly equivalent to one disease doubling period. | n/a. Chosen for simplicity. |
Recovery Period | 16 days | This is how long it takes the average patient to recover. This does not change regardless of the severity of the case. | No conclusive data exists. Corroborated by various sources, but one source is here. |
Non-contagious Incubation Period | 2 days | The average time between infection and onset of symptoms. For simplicity, also assumed to be the delay between infection and when an infected person is contagious, as we believe CoVid is likely infectious before symptoms begin. | No conclusive data exists. Corroborated by various sources, but one source is here. |
Contagious Period | 2 days | The number of days the average case is contagious. This is likely longer than 2 days for symptomatic cases, but for simplicity we assume that an infected person isolates after 2 days if symptomatic. | No conclusive data exists. Corroborated by various sources, but one source is here. |
Serial Interval | 4 days | The average time between the onset of symptoms in one individual and the onset of symptoms in another individual. Likely to be longer than 4 days, but was simplified down to 4 days to match the other variables and fit neatly into the model interval. | No conclusive data exists. |
Average Hospital Stay | 4 days | How long the average patient stays in the hospital before dying or recovering. | No conclusive data exists. Extremely conservative, current consensus is 10 days. |
Detailed Demographics Assumptions
Range provided by Imperial College paper, weighted by actual USA demographics as reported by statista here.
Demographics | % Hosp | % Hosp ICU | % CFR | |
12% | 0-9 | 0.1% | 5.0% | 0.002% |
13% | 10-19 | 0.3% | 5.0% | 0.006% |
14% | 20-29 | 1.2% | 5.0% | 0.03% |
13% | 30-39 | 3.2% | 5.0% | 0.08% |
12% | 40-49 | 4.9% | 6.3% | 0.15% |
13% | 50-59 | 10.2% | 12.2% | 0.60% |
11% | 60-69 | 16.6% | 27.4% | 2.20% |
7% | 70-79 | 24.3% | 43.2% | 5.10% |
4% | 80+ | 27.3% | 70.9% | 9.30% |
100.0% | 7.27% | 13.97% | 1.09% |
Term Definitions
Conventional Definitions and Terms from https://www.cdc.gov/sars/guidance/index.html | ||
Defined terms | Meaning | Associated Details |
Quarantine | Separation or restriction of activities of individuals who are not ill but who are believed to be at high risk of becoming infected (e.g. close contacts of SARS patients). |
|
Isolation | Separation of ill persons with a communicable disease (e.g. SARS patients) from those who are healthy |
|
Community-wide home quarantine | Community members stay at home (as they would during a major snow storm “snow day” style). |
|
Passive monitoring | Individuals report the appearance of their own symptoms | |
Active Monitoring | Professionals periodically/systematically assess individuals for symptoms | |
Community containment measures | Activities applied to groups or communities during outbreaks of extensive transmission | Scales up: e.g. increase social distance vs community-wide home-quarantine. |
Appendix D4: Threshold Determinants for the Use of Community Containment Measures From Supplement D: Community Containment Measures, Including Non-Hospital Isolation and Quarantine, CDC: https://www.cdc.gov/sars/guidance/d-quarantine/index.html (See: https://www.cdc.gov/sars/guidance/index.html ) | |
Parameter
|
Variable |
Epidemiologic parameters of the outbreak | Absolute number of cases |
| Rate of incident cases |
| Number of hospitalized cases |
| Number and percent of cases with no identified epidemiologic link |
| Morbidity (including disease severity) and mortality |
| Number of contacts under surveillance and/or quarantine |
|
|
Healthcare resources | Hospital/facility bed capacity |
| Isolation/negative pressure room capacity |
| Staff resources |
| Patient/staff ratio |
| Number of isolated or quarantined staff |
| Availability of specifically trained specialists and ancillary staff |
|
|
Equipment and supplies | Availability of ventilators |
| Availability of other respiratory equipment |
| Availability of personal protective equipment and other measures |
| Availability of therapeutic medications (SARS and non-SARS specific) |
|
|
Public health resources | Investigator to case and contact ratios |
| Number of contacts under active surveillance |
| Number of contacts under quarantine |
| Ability to rapidly trace contacts (number of untraced/interviewed contacts) |
| Ability to implement and monitor quarantine (staff to contact ratio) |
| Ability to provide essential services (food, water, etc.) |
|
|
Community cooperation, mobility and compliance | Degree of compliance with voluntary individual isolation |
| Degree of compliance with active surveillance and voluntary individual quarantine |
| Degree of movement out of the community |
| Degree of compliance with community-containment measures |
Known Limitations
Only a small fraction of the world has been infected. It’s a new disease. Variables will change. That said, the broad shape of the curve reflects the current general scientific consensus, and is the best information we currently have. Some known limitations:
- R0s for interventions are guesses, in some cases informed by data. There is no historical precedent for what is going on right now to draw from, and there is always some risk of misinterpretation of the data.
- Many of the inputs into this model (hospitalization rate, fatality rate) are based on early estimates that are likely to be wrong. All users should err on the side of caution and interpret the results of the model conservatively.
- The default R0 used in this model is an average. The model does not adjust for the population density, culturally-determined interaction frequency and closeness, humidity, temperature, etc in calculating R0.
- This model assumes simplified values for serial interval, contagious period, and other key disease dynamics that are likely to change model outputs somewhat when improved, but unlikely to change the general shape of the disease curve.
- This is not a node-based analysis, and thus assumes everyone spreads the disease at the same rate. In practice, there are some folks who are “super-spreaders,” and others who are almost isolated. Interventions should be targeted primarily at those most likely to spread the disease.
- This is a discrete, rather than a stochastic, analysis. That means that rather than using probability ranges, this model assumes constant rates for infection, contagiousness, etc. Among other things, discrete models may somewhat over-estimate the total percentage of the population who contracts the disease.
- Only hospital beds at aggregate are considered. ICU beds and ventilators, which are likely to run low before beds, are not considered. That means hospitals may be overloaded sooner than the model predicts.
- Demographics, populations, and hospital bed counts are outdated (estimates from 2016-2018). Demographics for the USA as a whole are used, rather than specific to each state.
- In containment cases, we do not deal with the longer-term impacts of maintaining containment, primarily the concern with avoiding reintroduction of the disease due to incoming travelers. 14-day mandatory border quarantines, such as those currently in place in China, would likely need to continue until a vaccine or therapeutic is developed.
- Attempts at containment/mitigation of any disease may cause a spike in new infections after these Non-Pharmaceutical Interventions (NPIs) are stopped. This can happen if the disease is not fully contained, or is reintroduced from another country. Because we are highly uncertain about the future, we do not currently include post-NPI behaviors in our model, though we are working on this.