7.4 Transformation in the Coordinate Grid
Learning Objectives
- You will identify and describe transformations in the coordinate plane.
- You will translate a figure in the coordinate plane using coordinate notation, and graph the resulting image.
- You will reflect a figure in the coordinate plane using coordinate notation, and graph the resulting image.
- You will rotate a figure in the coordinate plane using coordinate notation, and graph the resulting image.
Introduction
The King’s Chamber
In one room of the museum was a King’s bedroom. The furniture in the room was large and wooden and old with great golden cloths. On the walls was a beautiful red, blue, and gold pattern.
Jessica thought that the pattern was the most beautiful one that she had ever seen.
“I love this,” she said to Mrs. Gilman. “I want to draw it, but I’m not sure how.”
“Well, you could break it up into a coordinate grid, since the pattern repeats itself, and use what we have learned about transformations to draw it in,” suggested Mrs. Gilman.
“How could I get started?” Jessica asked.
“Well, start by drawing the coordinate grid, then use these coordinates for one of the diamonds. See if you can figure it out from there.”
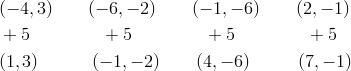
In Jessica’s notebook, Mrs. Gilman wrote down the following coordinates.

Jessica began to draw it in. Then she got stuck.
This is where you come in. This lesson will teach you all about drawing transformations. Follow along closely and you can help Jessica draw in the diamonds in each quadrant at the end of the lesson .
Guided Learning
Identify and Describe Transformations in the Coordinate Plane
In the last lesson you learned how to identify and perform different transformations. Remember that a transformation is when we move a figure in some way, even though we don’t change the figure at all. This lesson will teach you how to identify and perform transformations in the coordinate plane.
The coordinate plane is a representation of two-dimensional space. It has a horizontal axis, called the axis, and a vertical axis, called the axis. We can graph and move geometric figures on the coordinate plane.


Do you remember the three types of transformations?
The first is a translation or slide. A translation moves a figure up, down, to the right, to the left, or diagonal without altering the figure.
The second is a reflection or flip. A reflection makes a mirror image of the figure over a line of symmetry. The line of symmetry can be vertical or horizontal.
The third is a rotation or turn. A rotation moves a figure in a circle either clockwise or counterclockwise.
Now let’s look at performing each type of transformation in the coordinate plane.
Translate a Figure in the Coordinate Plane Using Coordinate Notation, and Graph the Resulting Image
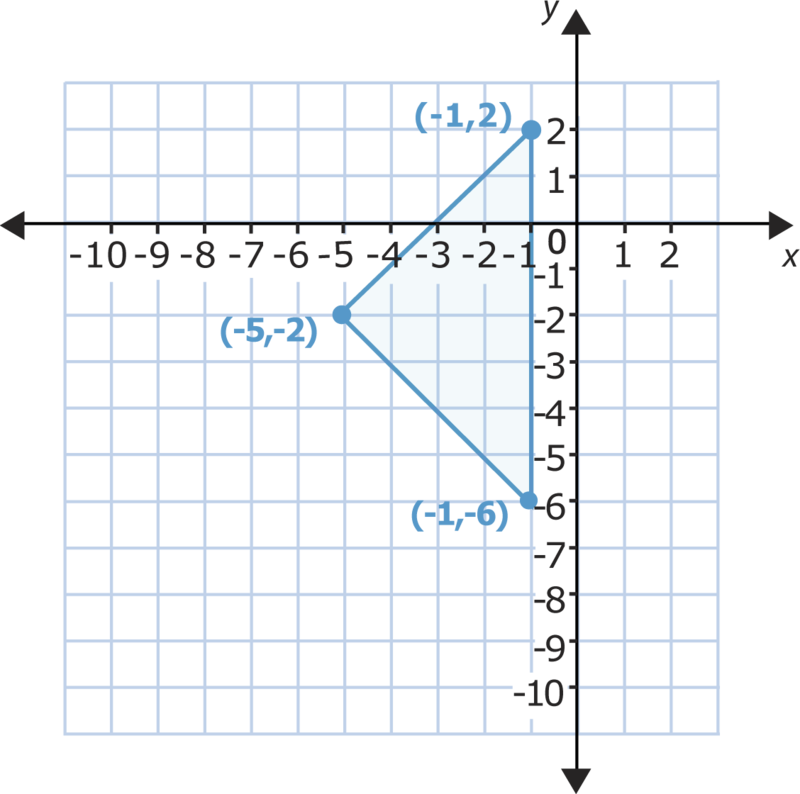
As we have said, when we perform translations, we slide a figure left or right, up or down. This means that on the coordinate plane, the coordinates for the vertices of the figure will change. Take a look at the example below.
Now let’s look at performing a translation or slide of this figure.
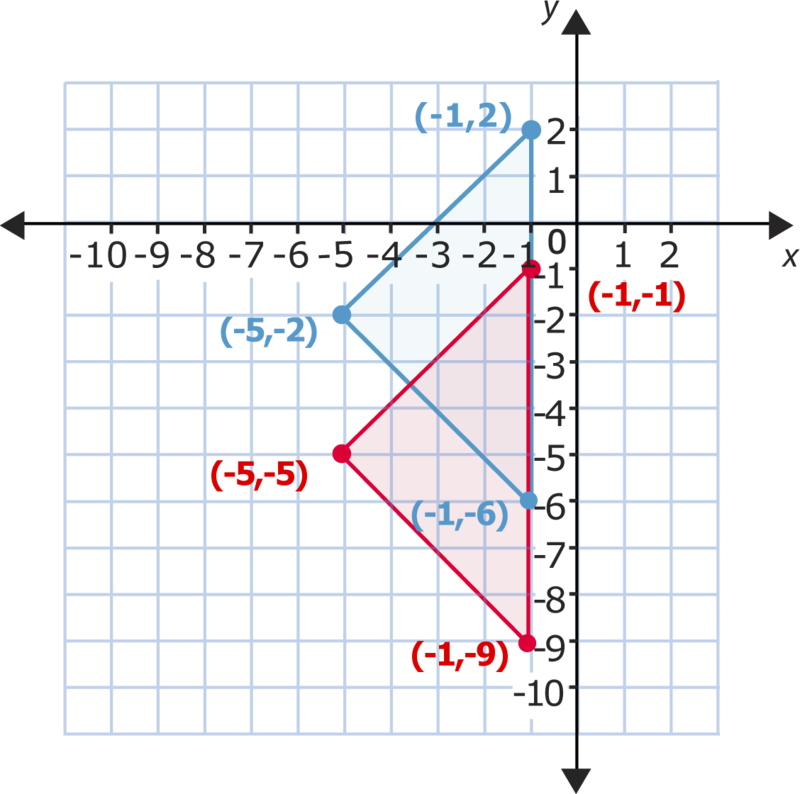
We can choose the number of places that we want to move the triangle and the direction that we wish to move it in. If we slide this triangle 3 places down, all of its vertices will shift 3 places down the axis. That means that the ordered pairs for the new vertices will change. Specifically, the coordinate in each pair will decrease by 3.


Let’s see why this happens.
We can see the change in all of the coordinates. Compare the top points. The coordinate on the right is 2. The coordinate for the corresponding point in the triangle after it moves is -1. The coordinate decreased by 3. Now compare the left-hand point of each triangle. The coordinate originally is -2, and the coordinate after the translation is -5. Again, the difference shows a change of -3 in the coordinate. For the last point, the coordinate starts out as -6, and shifts to -9 after the downward slide. For each point, then, the coordinate decreases by 3 while the coordinates stay the same. This means that we slid the triangle down 3 places.


We can translate figures in other ways, too. As you might guess, we move figures right or left on the coordinate grid by their coordinates. We can also move figures diagonally by changing both their and coordinates. One way to recognize translations, then, is to compare their points. The coordinates will all change the same way, and the coordinates will all change the same way.


To graph a translation, we perform the same change for each point. Let’s try graphing a translation.
Example A
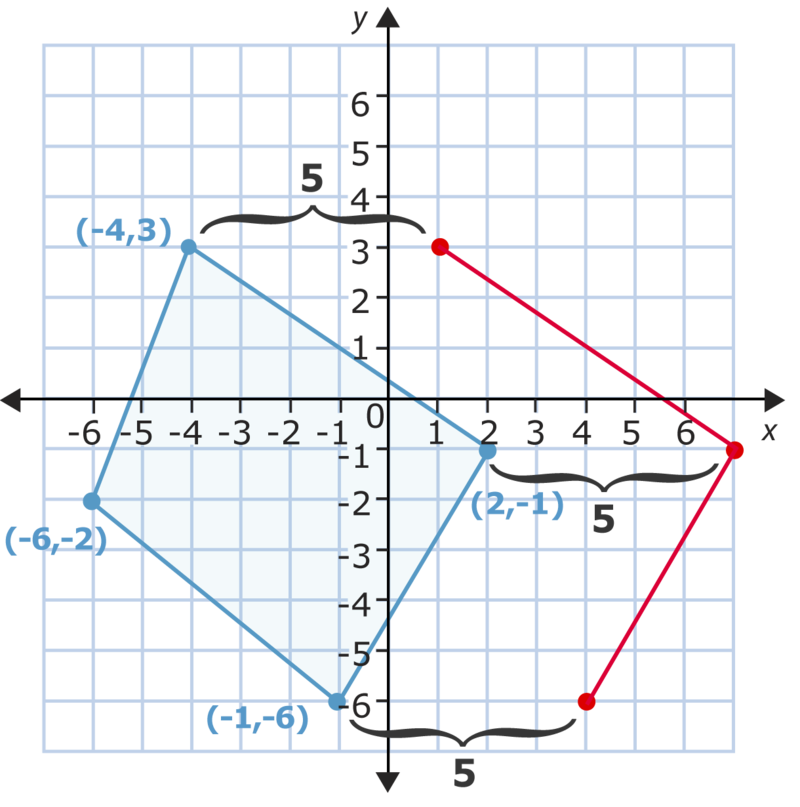
Slide the following figure 5 places to the right.
In this translation, we will move the figure to the right. That means the coordinates for each point will change but the coordinates will not. We simply count 5 places to the right from each point and make a new point.


Once we relocate each point 5 places to the right, we can connect them to make the new figure that shows the translation.
We can check to see if we performed the translation correctly by adding 5 to each coordinate (because we moved to the right) and then checking these against the ordered pairs of the figure you drew. This is called coordinate notation. Notice that each point is represented by coordinates.

These are the points we graphed, so we have performed the translation correctly.
Let’s try another.
Example B
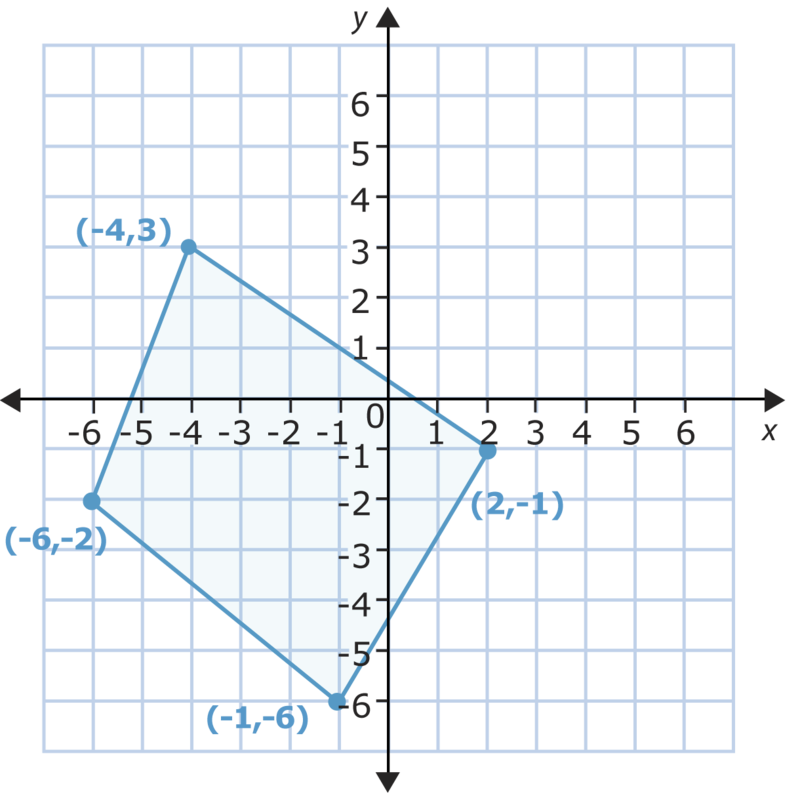
Slide the following figure 4 places to the left and 2 places up.
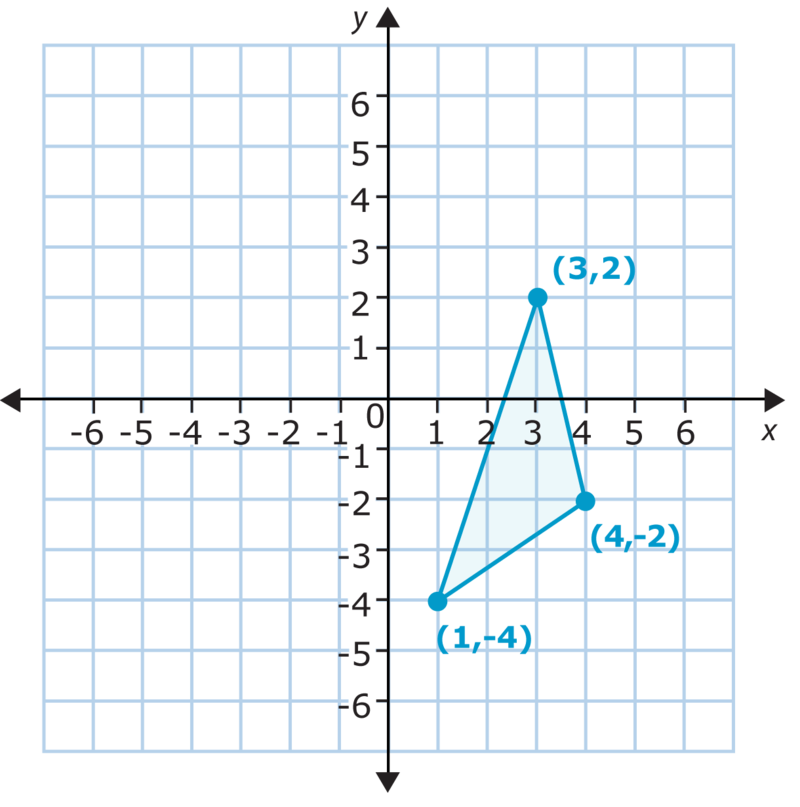
This time we need to perform two movements, both left and up. That means we will change both the and coordinates of the ordered pairs. We graph each point by counting 4 places to the left first, and from there 2 places up (2 places up from where you started, not 2 places up from the axis!). Make a mark and repeat this process for each point. Then connect the new points.


Again, we can check that we performed the translation correctly by changing the and coordinates in the ordered pairs and then comparing these to the points we graphed. This time we subtract 4 from each coordinate (because we moved left; imagine a number line) and add 2 to each coordinate. Let’s see what happens.


These are the points we graphed, so we performed the translation correctly.
Use coordinate notation to write the coordinates of each translated triangle. The vertices of the original figure have been given to you.
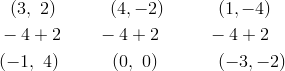
- Triangle (0, 1)(1, 3)(4, 0) translate this figure up 4.
- Triangle (-3, 2)(1, 6)(2, 1) translate this figure right 8.


Take a few minutes to check your work with a neighbor. Be sure that your answers are accurate. Correct any errors before continuing.
Reflect a Figure in the Coordinate Plane Using Coordinate Notation, and Graph the Resulting Image
We can also identify a reflection by the changes in its coordinates. Recall that in a reflection, the figure flips across a line to make a mirror image of itself. Take a look at the reflection below.
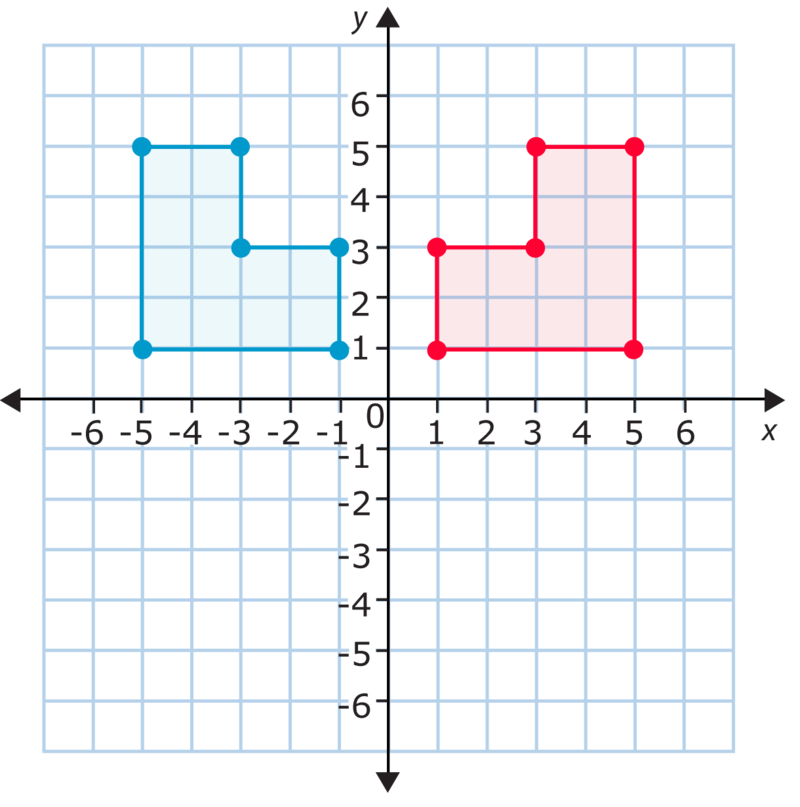
We usually reflect a figure across either the or the axis. In this case, we reflected the figure across the axis. If we compare the figures in the first example vertex by vertex, we see that the coordinates change but the coordinates stay the same. This is because the reflection happens from left to right across the axis. When we reflect across the axis, the coordinates change and the coordinates stay the same. Take a look at this example.


Now let’s compare some of the vertices. In the figure above the coordinates for the upper-left vertex of the original figure are (-5, 5). After we reflect it across the axis, the coordinates for the corresponding vertex are (-5, -5). How about the lower-right vertex? It starts out at (-1, 1), and after the flip it is at (-1, -1). As you can see, the coordinates stay the same while the coordinates change. In fact, the coordinates all become the opposite integers of the original coordinates. This indicates that this is a vertical (up/down) reflection or we could say a reflection over the axis.


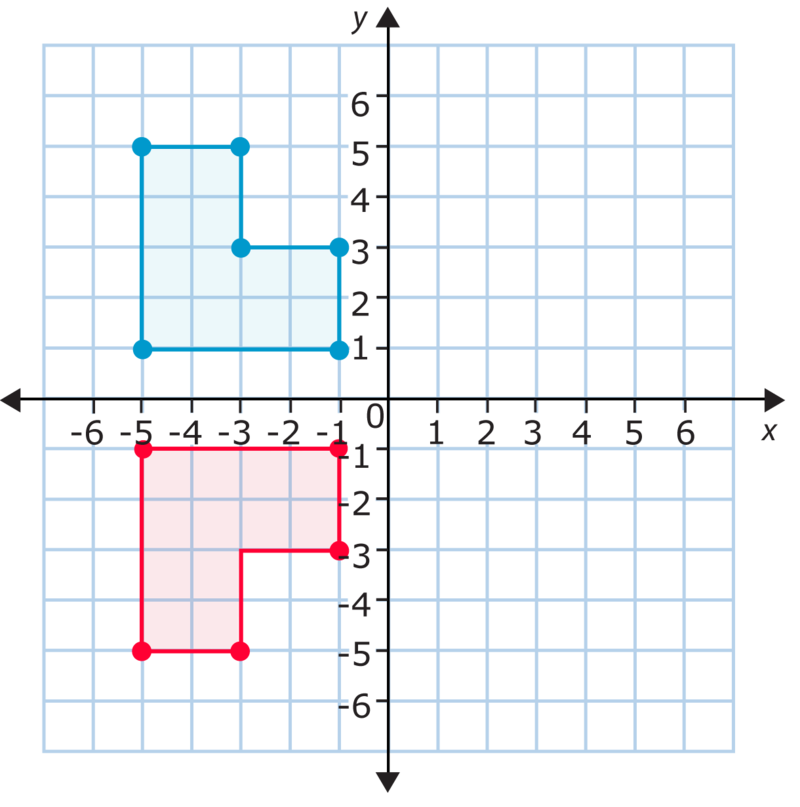
In a horizontal (left/right) reflection or a reflection over the axis, the coordinates would become integer opposites. Let’s see how.


This is a reflection across the axis. Compare the points. Notice that the coordinates stay the same. The coordinates become the integer opposites of the original coordinates. Look at the top point of the triangle, for example. The coordinates of the original point are (-4, 6), and the coordinates of the new point are (4, 6). The coordinate has switched from -4 to 4.


We can recognize reflections by these changes to the and coordinates. If we reflect across the axis, the coordinates will become opposite. If we reflect across the axis, the coordinates will become opposite.


We can also use this information to graph reflections. To graph a reflection, we need to decide whether the reflection will be across the axis or the axis, and then change either the or coordinates. Let’s give it a try.


Example C
Draw a reflection of the figure below across the axis.

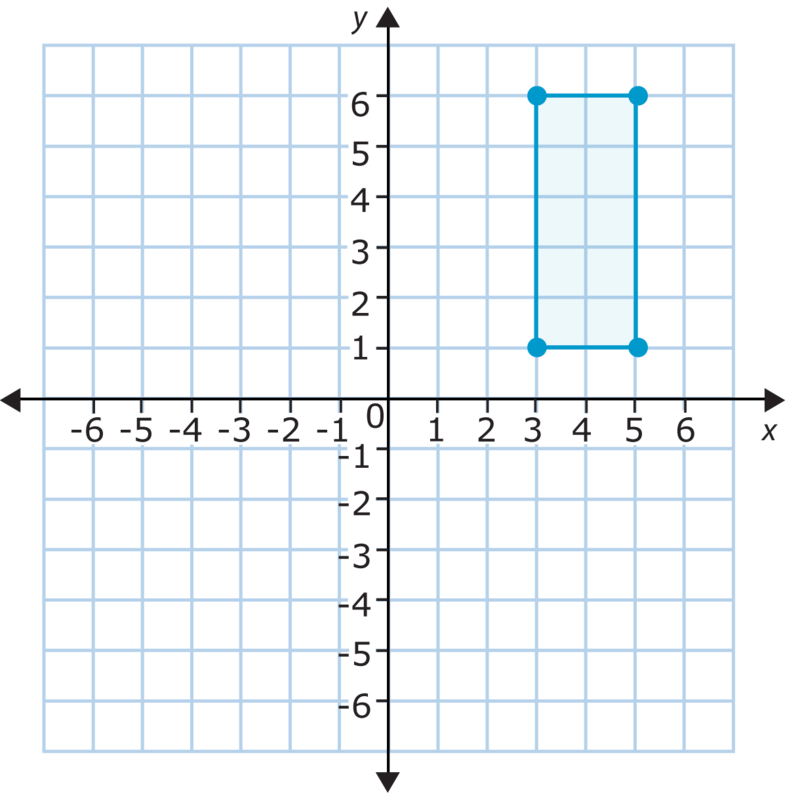
We need to reflect the rectangle across the axis, so the “flip” will move the rectangle down. Because the reflection is across the axis, we’ll need to change the "y" coordinates (which determine where points are up and down). Specifically, we need to change them to their integer opposites. An integer is the same number with the opposite sign. This gives us the new points.


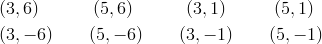
Now we graph the new points. Remember to move right or left according to the coordinate and up or down according to the coordinate.


Here is the completed reflection. Let’s practice with coordinate notation.
Write each set of coordinates to show a reflection in the axis.

- (-3, 1) (0, 3) (1, 2)
- (-3, 6) (-2, 3) (2, 3) (3, 6)

Take a few minutes to check your work.
Rotate a Figure in the Coordinate Plane Using Coordinate Notation, and Graph the Resulting Image
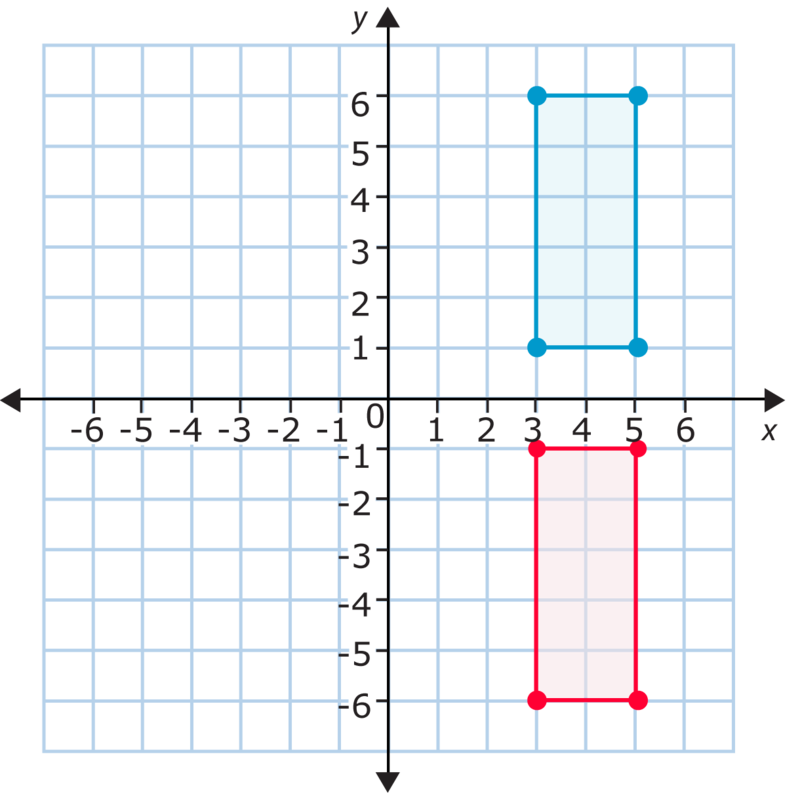
Now let’s look at the third kind of transformation: rotations. A rotation is a transformation that turns the figure in either a clockwise or counterclockwise direction. The figure below has been rotated. What are its new coordinates?
The new coordinates of the rectangle’s vertices are (1, -3), (1, 2), (3, 2), and (3, -3). As you can see, both the and coordinates changed. Unlike a translation or reflection, a rotation can change both of the coordinates in an ordered pair. Now look closely. One of the points remained exactly the same! We say that we rotated the figure about this point. Imagine you put your finger on this corner of the rectangle and spun it. That’s what happened in the rotation. The rectangle has been rotated clockwise.


How do we graph a rotation?
When we graph a rotation, we first need to know how much the figure will be rotated. Rotating the above rectangle stands it up on end. Rotating it would make it flat again. We also need to know which point we will rotate it around. This is the point that stays the same.


Next, we need to count how many units long and wide the figure is. The figure above stretches from 1 on the axis to -4 on the axis. This is a total of 5 units along the axis. When we rotate a figure , the distance on the axis becomes the distance on the axis. Look at the rectangle. The long sides are horizontal at first, but after we rotate it, they become the vertical sides. This means that the distance of 5 will become a distance of 5.


Now, remember the point (1, -3) stays the same, so it is one corner of the rotated figure. We add 5 to the coordinate to find the next vertex of the rectangle. . This puts a vertex at (1, 2).


To find the other points of the rotated rectangle, we need to think about its width. Find the width, or short side, of the original rectangle by counting the units between vertices along the axis. The rectangle covers 2 units on the axis. As you might guess, this becomes the distance in the rotated figure. In other words, we add 2 to the coordinate of the point that stays the same. , so another vertex of the rectangle will be (3, -3). To find the fourth and final vertex, add 2 to the coordinate of the other ordered pair we know, (1, 2). This puts the last vertex at (3, 2).


Let’s go back to the problem in the introduction and use what we have learned to figure it out!
Real-Life Example Completed

The King’s Chamber
Here is the original problem once again. Reread it before working on the drawing.
In one room of the museum was a King’s bedroom. The furniture in the room was large and wooden and old with great golden cloths. On the walls was a beautiful red, blue, and gold pattern.
Jessica thought that the pattern was the most beautiful one that she had ever seen.
“I love this,” she said to Mrs. Gilman. “I want to draw it, but I’m not sure how.”
“Well, you could break it up into a coordinate grid, since the pattern repeats itself, and use what we have learned about transformations to draw it in,” suggested Mrs. Gilman.
“How could I get started?” Jessica asked.
“Well, start by drawing the coordinate grid, then use these coordinates for one of the diamonds. See if you can figure it out from there.”
In Jessica’s notebook, Mrs. Gilman wrote down the following coordinates.

Jessica began to draw it in. Then she got stuck.
Now we can draw this diamond in on a coordinate grid. It belongs in Quadrant one. Now we want to draw a diamond into each of the other three quadrants. We can draw this, but we can also use mathematics to figure out the coordinates for each of the other diamonds first.
The diamond in the second quadrant is reflected over the axis. Therefore, the coordinate is going to change and become negative in each of the four vertices of the diamond. Here are the coordinates.


Next, we can reflect the original diamond in the first quadrant over the axis into the fourth quadrant. Here the coordinates will be negative.


Finally we can reflect this diamond over the axis into the third quadrant. Notice that here the and coordinates will both be negative.


Did you notice any patterns? Take a minute and create this pattern of diamonds in a coordinate grid. Then you will have an even deeper understanding of how a pattern like this one is created.
If you wanted to add in the gold that crosses through the original pattern could you do it? Explain your thinking with a friend and then add in the to the coordinate grid with the diamonds.


Review
- When transforming figures on a coordinate plane, all points must move the same distance.
- Some of the transformations can be combined so make sure to look at all details of the figures to determine how the shape has moved.
Coordinate Plane
The coordinate plane is a representation of two-dimensional space. The x-axis and
y-axis make up the plane.
Coordinate Notation
Coordinate notation is a way to write a transformation.
Reflection
A reflection makes a mirror image of the figure over a line of symmetry.
Rotation
A rotation moves a figure in a circle either clockwise or counterclockwise.
Translation
A translation moves a figure up, down, to the right, to the left or diagonal without altering
the figure.
X-axis
The x-axis is the horizontal number line in a coordinate plane.
Y-axis
The y-axis is the vertical number line in a coordinate plane.