Probability Trees Part 4
The Tree diagram
A tree diagram is a way of presenting all the possibilities and their respective probabilities and becomes a lot more useful when we are talking about more than 2 events!
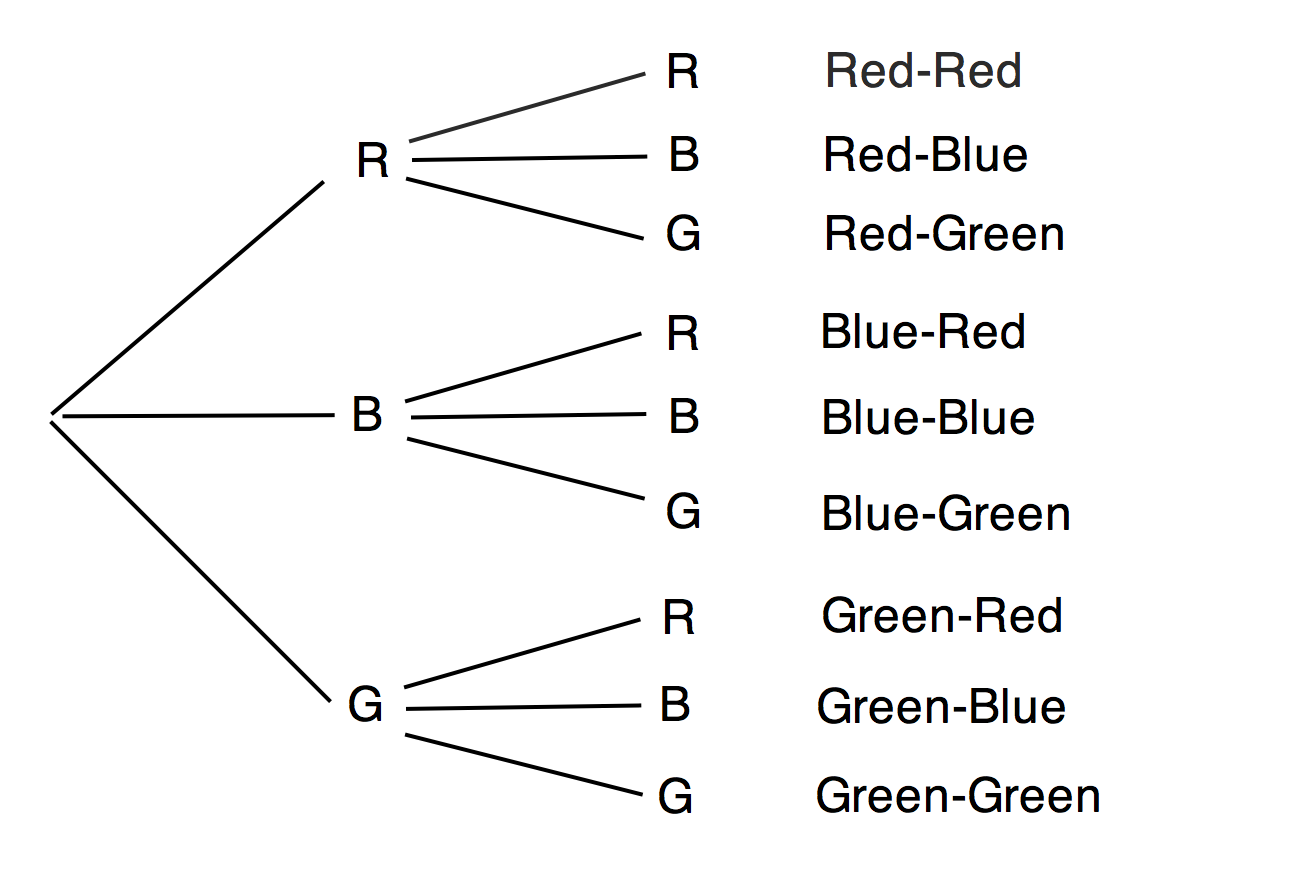
On the next page of this document you have a tree diagram on it that shows 9 different things that could happen. (don't confuse this with the total number of outcomes - there are many more possibilities than 9, but there are only 9 different outcomes) It May be helpful to have this tree diagram blown up to A3 size.
Each ‘branch’ of a tree diagram should show the probability of the event the branch leads too. Combinations of branches can be made to find out the probability of two or more events happening.
Starting with the fractions you have from the previous exercises and using your sample space diagram, you should put a fraction on each branch of the diagram that corresponds to the event it is pointing to and then a fraction that describes the probability of the 9 different combinations of two colours that there are. There are 12 branches and 9 combinations so you should use 21 of the 27 cards. (you could think about why you don't need the other 6!)