Summary of source data for Code.org infographics and stats
Table of Contents
Computing occupations make up 67% of all projected new jobs in STEM fields 2
Only 8% of STEM graduates study Computer Science 4
57.5% of U.S. high schools teach CS classes 6
91% of parents want their student to learn CS and 93% of parents want their child’s school to teach CS 7
Students like computer sciences “a lot” 8
The value of a computer science education 8
There are more than 500,000 open computing jobs in the U.S. 9
Computing jobs are the #1 source of new wages in the United States 9
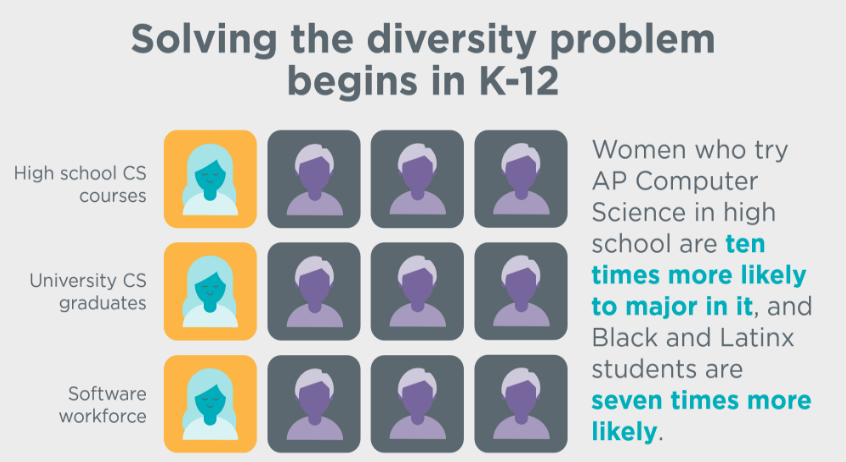
The diversity problem in tech starts in schools 9
High School AP exams reported on code.org/promote/ap 10
In X out of 50 states computer science doesn’t count towards high school graduation credit 11
75% of Americans say science is cool and 50% of Americans rank computer science as one of the most important subjects to study 11
67% of parents and 56% of teachers believe students should be required to learn computer science 11
Computer science is the second highest paid college degree 12
500,000 female software professionals in the United States 12
67% of computing jobs are outside the tech sector 12
59% of H1B “skilled worker” visa granted for computer science occupations 13
Per-state computer science graduates 14
Per-state new teachers graduating prepared to teach computer science 16
Code.org data - Hours of Code per state 17
Code.org data - Diversity of students on Code Studio 17
National Data
Computing occupations make up 67% of all projected new jobs in STEM fields
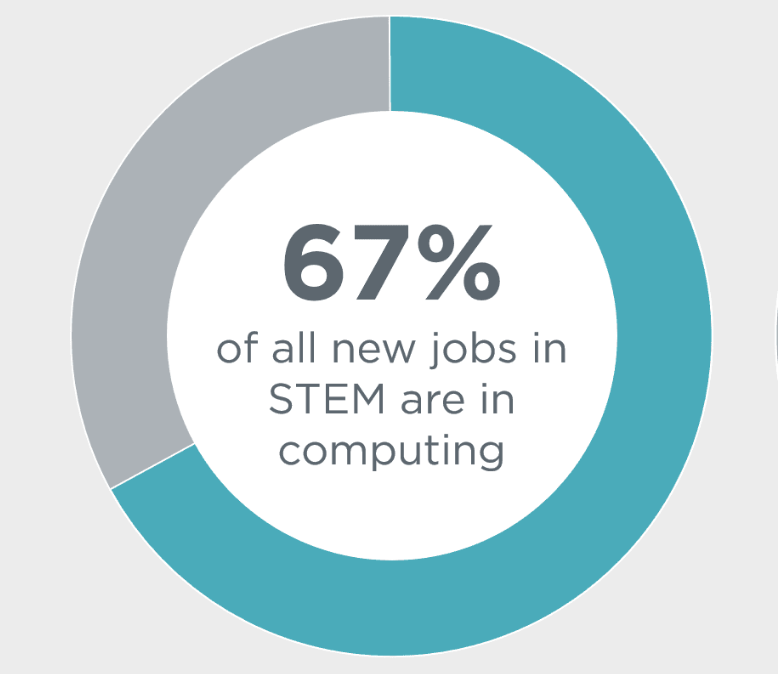
Source: Bureau of Labor Statistics Employment Projections (Table 1.2)
Projections (2018-2028):
- New computing jobs = 598,700 jobs
- All other STEM jobs = 290,200 jobs
- That’s a 67:33 ratio of jobs in computing versus the rest of STEM.
- [Note that previously published data projected 58% of new STEM jobs to be computing.]
Classification of occupations:
- STEM occupations defined by SOC codes that the BLS defined as STEM in the “Science, Engineering, Mathematics, and Information Technology Domain” (http://www.bls.gov/soc/Attachment_A_STEM.pdf & http://www.bls.gov/soc/Attachment_B_STEM.pdf). Note that SOC have been updated in 2018; the data does not yet reflect the new SOC codes, so we currently use the 2012 documents/definitions.
- Computing occupations defined by occupations listed under “Computer Occupations” SOC 15-1200, as well as additional individual codes in other categories that are computer science occupations. See this blog post for an explanation of why these codes are used.
- Specific codes for both classifications are listed below. Note that these codes include occupations at all degree levels.
Computer Occupation Codes
11-3021 | Computer and Information Systems Managers |
17-2061 | Computer Hardware Engineers |
25-1021 | Computer science teachers, postsecondary |
15-1211 | Computer Systems Analysts |
15-1212 | Information Security Analysts |
15-1221 | Computer and Information Research Scientists |
15-1231 | Computer Network Support Specialists |
15-1232 | Computer User Support Specialists |
15-1241 | Computer Network Architects |
15-1242 | Database Administrators |
15-1243 | Database Architects |
15-1244 | Network and Computer Systems Administrators |
15-1251 | Computer Programmers |
15-1252 | Software Developers |
15-1253 | Software Quality Assurance Analysts and Testers |
15-1254 | Web Developers |
15-1255 | Web and Digital Interface Designers |
15-1299 | Computer Occupations, All Other |
STEM Codes (Science, Engineering, Mathematics, and Information Technology Domain)
11-9041 | Architectural and Engineering Managers |
11-9121 | Natural Sciences Managers |
15-1200 | Computer Occupations |
15-2000 | Mathematical Science occupations |
17-1020 | Surveyors, Cartographers, and Photogrammetrists |
17-2000 | Engineers |
17-3000 (except 17-3011) | Drafters, Engineering Technicians, and mapping Technicians |
19-1000 | Life Scientists |
19-2000 | Physical Scientists |
19-3000 (except 19-3093) | Social Scientists and Related Workers |
19-4000 | Life, Physical and Social Science Technicians |
25-1020 | Math and Computer Teachers, Postsecondary |
25-1032 | Engineering Teachers, Postsecondary |
25-1040 | Life Sciences Teachers, Postsecondary |
25-1050 | Physical Sciences Teachers, Postsecondary |
25-1060 | Social Sciences Teachers, Postsecondary |
41-4011 | Sales Representatives, Wholesale and Manufacturing, Technical and Scientific Products |
41-9030 | Sales Engineers |
Only 11% of STEM graduates study Computer Science
Source: National Center for Education Statistics (NCES) IPEDS Completions Survey.
- Access the data in one of two ways:
- The NSF’s NCSES Table Builder
- Directly from the NCES site:
- Click on “Use the Data”, then "Survey Data - complete survey data", and then download the following files:
- C2019_A and dictionary file for Completions (provides awards/degrees conferred by program, award level, race/ethnicity, and gender)
- HD2019 and dictionary file for Institutional Characteristics - Directory Information (matches institutions to states)
- Data filters:
- SECTOR: 1, 2 (Public and Private not-for-profit, 4-year or above)
- MAJORNUM: 1
- CIPCODE: See “definitions” below.
- AWLEVEL: 5 (bachelor’s degree)
Results:
- In 2019, the number of bachelor’s degrees earned in STEM was 711,024. The number of bachelor’s degrees earned in Computer Science was 82,693. That’s 11.6% of STEM degrees are in CS.
Definitions:
- The national count of CS graduates includes the U.S territories Guam, Puerto Rico, and Virgin Islands.
- Crosswalk of CIP codes to degrees found in the 2010 Classification of Instructional Program (CIP) values to WebCASPAR Academic Discipline, Detailed (standardized) values.
- “Computer Science” majors include the following CIP codes:
11.0101 Computer and Information Sciences, General |
11.0102 Artificial Intelligence |
11.0103 Information Technology |
11.0104 Informatics |
11.0199 Computer Science, Other |
11.0201 Computer Programming/Programmer, General |
11.0202 Computer Programming Special Applications |
11.0203 Computer Programming, Vendor/Product Certification |
11.0299 Computer Programming, Other |
11.0301 Data Processing and Data Processing Technology/Technician |
11.0401 Information Science/Studies |
11.0501 Computer Systems Analysis/Analyst |
11.0701 Computer Science |
11.0801 Web Page, Digital/Multimedia and Information Resources Design |
11.0802 Data Modeling/Warehousing and Database Administration |
11.0803 Computer Graphics |
11.0804 Modeling, Virtual Environments and Simulation |
11.0899 Computer Software and Media Applications, Other |
11.0901 Computer Systems Networking and Telecommunications |
11.1001 Network and System Administration/Administrator |
11.1002 System, Networking, and LAN/WAN Management/Manager |
11.1003 Computer and Information Systems Security/Information Assurance |
11.1004 Web/Multimedia Management and Webmaster |
11.1005 Information Technology Project Management |
11.1006 Computer Support Specialist |
11.1099 Computer/Information Technology Services Administration and Management, Other |
11.9999 Computer and Information Sciences and Support Services, Other |
- STEM degrees comes from two NCES tables: Table 1 & Table 2 and include the following academic disciplines from WebCASPAR:
Aerospace Engineering | Medical Sciences |
Earth Sciences | Other Engineering |
Chemical Engineering | Other Life Sciences |
Oceanography | Astronomy |
Civil Engineering | Science Technologies |
Mathematics & Statistics | Chemistry |
Electrical Engineering | Engineering Technologies |
Computer Science | Physics |
Mechanical Engineering | Health Technologies |
Agricultural Sciences | Other Physical Sciences |
Materials Engineering | Other STEM Technologies |
Biological Sciences | Atmospheric Sciences |
Industrial Engineering | Interdisciplinary or Other Sciences |
Prior data:
Prior to 2016, we used the National Science Foundation WebCASPAR tool to analyze the NCES IPEDS Completions Survey
- Source: National Science Foundation (NSF) WebCASPAR tool
- Filters:
- Under “Frequently Requested Tables,” choose “NCES Degrees Awarded by Degree Level and Field”
- Analysis variable: Degrees/Awards Conferred (NCES population of institutions)
- Classification variables:
- 2015 (or desired year)
- bachelor’s degrees only
- under “institutional control (survey-specific)”: public institutions or nonprofit private institutions
57.5% of U.S. high schools offer CS classes
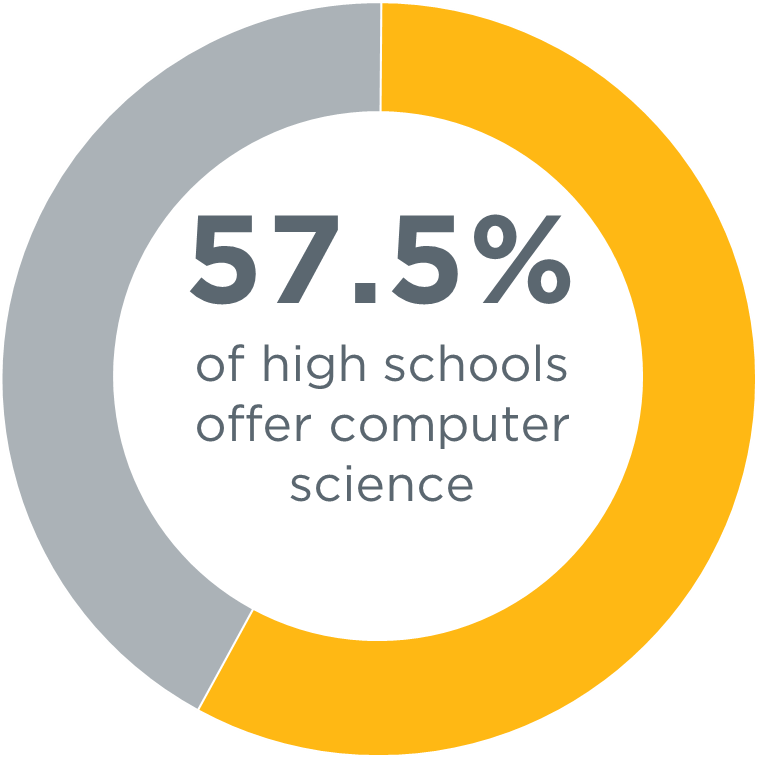
Source: Access Report data reported in 2023 State of Computer Science Education
Results: The full methodology is included on p. 112-117. Data sources include the National Center for Education Statistics, School Courses for the Exchange of Data, state education agencies, national organizations, district and school course catalogs, and survey responses. These are schools where students learn computer science during the school day (not in after school clubs) and spend a minimum amount of time per semester applying learned concepts through programming (at least 20 hours of programming for grades 9-12 high schools). Although computer science is broader than programming, some direct programming experience is integral to learning the fundamental concepts and is used as a defining characteristic to differentiate a foundational computer science course from non-computer science courses.
Prior data:
- “53% of U.S. high schools offer CS.” 2022 Access Report data reporting in the 2022 State of Computer Science Education: Understanding Our National Imperative. Full methodology is included on p. 114-117.
- “51% of U.S. high schools offer CS.” 2021 Access Report data reporting in the 2021 State of Computer Science Education: Accelerating Action Through Advocacy. Full methodology is included on p. 97-100.
- “47% of U.S. high schools teach CS.” 2020 Access Report data reporting in the 2020 State of Computer Science Education: Illuminating Disparities. Full methodology is included on p. 93-95.
- “45% of U.S. high schools teach CS.” 2019 Access Report data reporting in the 2019 State of Computer Science Education: Equity and Diversity. Full methodology is included on p. 87-89.
- “35% of U.S. high schools teach CS classes.” 2018 Access Report data reporting in the 2018 State of Computer Science Education: Policy and Implementation. Full methodology is included on p. 69-71.
- “40% of U.S. schools offer C.S. classes with computer programming” came from the Gallup research study (commissioned by Google) Trends in the State of Computer Science in U.S. K-12 Schools, released in 2016. According to this report, 40% of principals report having at least one computer science class in which students learn programming or coding (p 3.)
- “1 in 4 schools” came from the report Searching for Computer Science: Access and Barriers in K-12 Education. According to this report, 3/4 of principals surveyed said that their schools do not offer courses with computer programming and coding. Of the 8811 principals who responded to the survey, 4745 said they offer computer science, 3761 said they don’t offer computer science, and 305 said they didn’t know. However, when asked about the content of these computer science courses, only about half of the 4745 principals who offer computer science said that these courses include programming—bringing the fraction of schools that offer computer science courses with programming to 1/4 (i.e., 4745 x 0.5 = 2,372 and 2,372/8,811 = 0.26). Note that we used 1/4 rather than 1/2 due to the confusion about what constitutes computer science. Programming is a critical component to include in a computer science course, and thus only those classes that have some programming should count as computer science.
91% of parents want their student to learn CS and 93% of parents want their child’s school to teach CS
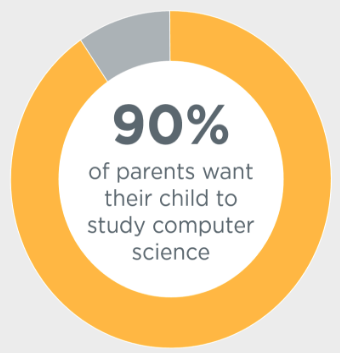
Source: Gallup research study (commissioned by Google) Trends in the State of Computer Science in U.S. K-12 Schools, released in 2016
Results:
- According to the study, 91% of parents want their child to learn more computer science in the future (p. 12).
- According to the study, 93% of parents “see CS education as a good use of resources at their child’s school” (p. 8).
Prior data: Previous data from the study Searching for Computer Science: Access and Barriers in K-12 Education (released in 2015) found that 91% of parents wanted their students to learn CS and 90% of parents wanted their child’s school to teach CS.
Students like computer sciences “a lot”
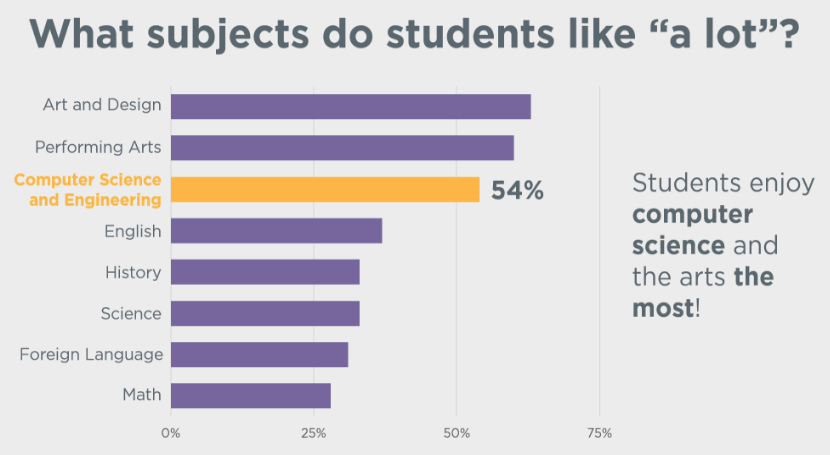
Source: A study by Change the Equation and C+R Research, with analysis completed by Code.org. More information about the study can be found from Change the Equation.
Method: High school students were asked, for each course they have taken or plan to take, about whether they “like it a lot,” “like it a little,” “dislike it a little,” or “dislike it a lot.”
Result: When comparing computer science courses to other courses, more students like graphic arts, performing arts, and computer science courses. Code.org’s analysis is described in more detail here.
The value of a computer science education
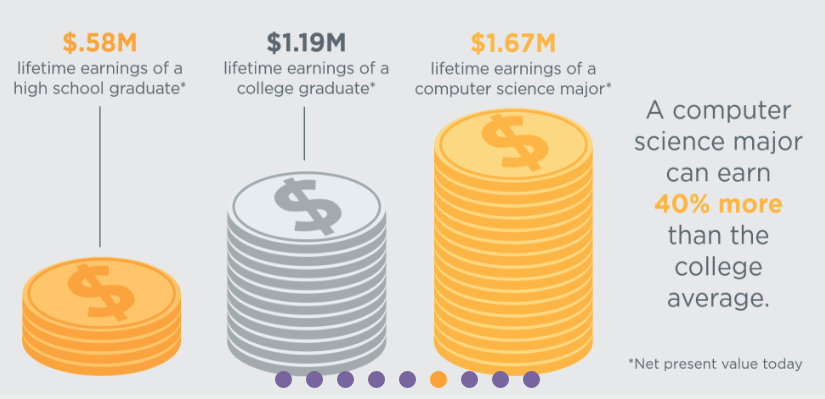
Source: The Hamilton Project (Brookings)
Included: The net present value for lifetime earnings for high school graduates, college graduates, and computer science majors.
There are more than 500,000 open computing jobs in the U.S.
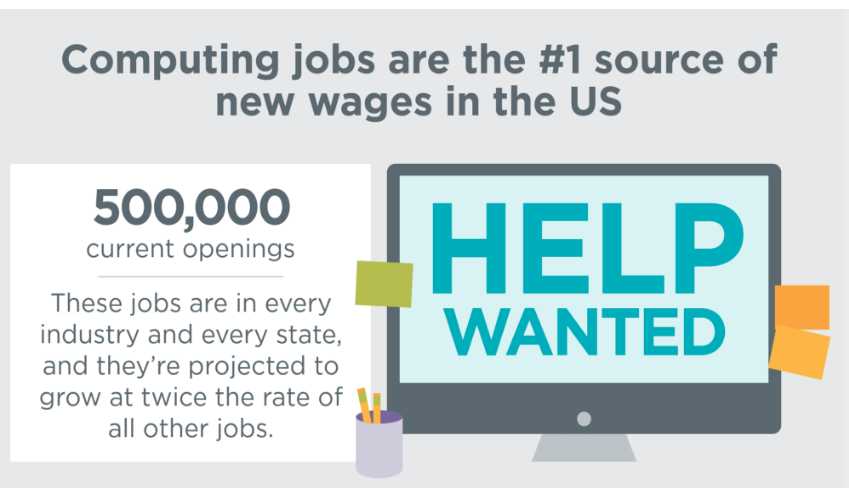
Sources: The number of current open computing jobs comes from the sum of the per-state jobs data from The Conference Board’s Help Wanted OnLine®service (see below for more details on the data from The Conference Board).
The projected rate of this job growth comes from the Bureau of Labor Statistics Employment Projections data for 2016-2026, released in 2017. These data predict an employment change of 12.65% for computing occupations and an employment change of 7.38% for all occupations.
Definitions: For computing occupations, we use SOC codes 11-3021, 15-1200, 17-2061, and 25-1021 (see more details on these codes in the table above).
Computing jobs are the #1 source of new wages in the United States
Source: The number of job openings in April 2016 as reported by The Conference Board’s Help Wanted OnLine®service (click here for more information about HWOL and their data collection methods).
Definition: The number of job openings in each category were multiplied by the average salary (from the Bureau of Labor Statistics 2018 OES data). For computing occupations, we use SOC codes 11-3021, 15-1200, 17-2061, and 25-1021 (see more details on these codes in the table above).
The diversity problem in tech starts in schools
For students who try AP CS in high school:
Source: AP® Students in College: An Analysis of Five-Year Academic Careers - College Board (2007)
Results:
- Women who try AP Computer Science A in high school are ten times more likely to major in it in college
- Students who take AP Computer Science A in high school are 6 times more likely to major in computer science than those who do not, and Black/African American and Hispanic/Latino/Latina students are 7 or 8 times more likely.
For ¼ women in high school CS, university CS, and software workforce:
Source:
- College Board National and State Summary Reports (2015 AP CS A exams)
- National Center for Education Statistics (college graduates by degree in 2017)
- Bureau of Labor Statistics Current Population Survey (people employed in computing occupations in 2018).
Results:
- Female students represent 31% of AP CS exam-takers (in 2020), 21% of CS bachelor’s degrees (in 2019), and 24% of people employed in computing occupations (in 2018).
- Students from underrepresented racial and ethnic groups represent 22% of AP CS exam-takers (16% Hispanic/Latino/Latina, 6% Black/African American, 0.5% Native American/Alaskan, and 0.14% Native Hawaiian/Pacific Islander), 18% of CS bachelor’s degrees (10% Hispanic/Latino/Latina, 7% Black/African American, less than 1% Native American/Alaskan), and 15% of people employed in computing occupations (8% Black/African American, 7% Hispanic/Latino/Latina).
High School AP exams reported on code.org/promote/ap
Source:
Included:
- AP computer science exams (A & Principles) compared to other subjects
- Participation by female students
- Participation by Black/African American, Hispanic/Latino/Latina, Native American/Alaskan, and Native Hawaiian/Pacific Islander students
Definitions: We define STEM exams as Biology, Calculus AB, Calculus BC, Chemistry, Computer Science A, Computer Science Principles, Environmental Science, Physics 1, Physics 2, Physics C: Elec. & Magnet., Physics C: Mechanics, and Statistics.
Source:
- College board data reported directly to code.org per our agreement.
Included:
- High schools offering the exam
In X out of 50 states computer science doesn’t count towards high school graduation credit
Source: Code.org’s state tracking spreadsheet. Prior source: ACM Running on Empty report
Results: Thanks to the advocacy efforts by the Code.org Advocacy Coalition, the list of states that allow computer science to count towards graduation credit has increased monthly, and at this point, Code.org is the definitive source of the data. The latest list of states is reflected here.
75% of Americans say science is cool and 50% of Americans rank computer science as one of the most important subjects to study
Source: Horizon Media’s WHY group survey
Results: The group reported that “three in four Americans agree that ‘today, science is cool in a way that it wasn’t ten years ago.’ And computer science is a major driver of this new perceived cool factor -- with 73% agreeing that ‘in the future, all the best jobs will require knowledge of computer coding languages.” And “when asked which two subjects other than reading and writing are critical to ensure the next generation is prepared for the future, 70% chose math, and 50% said computer science. More than two thirds (65%) went as far to agree that ‘most students would benefit more from learning a computer coding language than a foreign language.’ ”
67% of parents and 56% of teachers believe students should be required to learn computer science
Sources:
- Gallup research study (commissioned by Google) Searching for Computer Science: Access and Barriers in K-12 Education, released in 2015
- Gallup research report, Images of Computer Science: Perceptions Among Students, Parents and Educators in the U.S.
Results:
- 67% of parents answered yes to “Do you think most students should be required to learn computer science?” (Searching for Computer Science, p. 24)
- When teachers were asked how much they agreed with the statement “Most students should be required to take a computer science course” on a 5-point scale from strongly disagree to strongly agree. (Searching for Computer Science, p. 24)
- 33% of teachers strongly agree and 23% of teachers agree, for a total of 56% of teachers
- Demand is highest among parents of low-income students (Searching for Computer Science, p. 13), and teachers of low income students (Images of Computer Science, p. 22)
Computer science is the second highest paid college degree
Source: National Association of Colleges and Employers (2018, 2015)
Result: Graduates with computer science degrees earn the second highest starting salaries (just after mechatronic engineering graduates).
Source: Forbes in 2013
Result: Best-paying degree in the USA was a computer science degree from Carnegie Mellon.
500,000 female software professionals in the United States
According to this IDC study in 2014, or this easier-to-read summary, there are 11M software professionals in the world. 19.2% are in the U.S., which means 2.1M software professionals in the U.S. According to NCWIT, 26% of these professionals are female, which is about 550,000.
67% of computing jobs are outside the tech sector
Source: MSFT National Talent Strategy document and taken from a Georgetown University Center for Education and the Workforce Report on STEM (October 2011) by Anthony Carnevale, Nicole Smith, and Michelle Melton
Included Quote: "Computer occupations are the most widely represented across industries. For example, 9 percent are in Information Services, 12 percent are in Financial Services, 36 percent are in Professional and Business Services, 7 percent are in Government and Public Education Services, and 12 percent are in Manufacturing." Therefore: 12 + 36 + 7 + 12 = 67%.
59% of H1B “skilled worker” visa granted for computer science occupations
Source: U.S. Dept of Labor, Office of Foreign Labor Certification
Definitions: This is how we classified the job types:
Occupation type | 2014 count | % | Code.org classification |
computer systems analyst | 47860 | 33% | Computer science |
software applications developer | 16792 | 12% | Computer science |
computer programmer | 15205 | 11% | Computer science |
computer occupations other | 12982 | 9% | Other computing |
software developers - system software | 5492 | 4% | Computer science |
accountant | 5101 | 4% | Other |
management analyst | 3367 | 2% | Other |
computer information system manager | 2830 | 2% | Other computing |
electronic engineer | 2758 | 2% | Other |
network/computer system administrator | 2645 | 2% | Other computing |
Other | 29625 | 20% | Other |
State-specific data
State average salary
Source: Bureau of Labor Statistics May 2018 State Occupational Employment and Wage Estimates
Method: For average state salary (versus average salary for a computing occupation as above), we use “Annual mean wage” for all occupations. For average salary in computing occupations, we calculate the weighted arithmetic mean of all computing occupations (BLS codes 11-3021, 15-1200, 17-2061, and 25-1021) using the “annual mean wage” and total employment for each occupation code. That is, instead of simply finding the mean of the four occupation codes, we multiply the average salary for a given code by the number of people employed in that occupation and divide the sum of these salaries by the total number of people employed in computing occupations.
Per-state jobs data
Source: The Conference Board’s Help Wanted OnLine®service (click here for more information about HWOL and their data collection methods).
Methods: The number of open computing jobs in each state represents the number of open jobs in the previous month (seasonally adjusted) for Bureau of Labor Statistics’ (BLS) Category SOC “15-0000 Computer and Mathematical Occupations”). This is a conservative estimate of the number of computing occupations as it excludes three BLS categories that include computing occupations: Computer and Information Systems Managers 11-3021, Computer Hardware Engineers 17-2061, and Computer Science Teachers, Postsecondary 25-1021. However, the 15-0000 SOC also includes some mathematical occupations that are not considered computing occupations. (This is due to limitations with our agreement with the Conference Board.) This data is cross-sector.
The comparison to the state average demand rate is comparing the job demand (% open jobs / # of existing jobs determined in the May 2017 BLS’s OES survey) in computing occupations vs the state average.
The national jobs data is the sum of the 50 states plus D.C.
Per-state computer science graduates
Source: National Center for Education Statistics (NCES) IPEDS Completions Survey.
- Click on “Use the Data”, then "Survey Data - complete survey data", and then download the following files:
- C2018_A and dictionary file for Completions (provides awards/degrees conferred by program, award level, race/ethnicity, and gender)
- HD2018 and dictionary file for Institutional Characteristics - Directory Information (matches institutions to states)
- Data filters:
- SECTOR: 1, 2 (Public and Private not-for-profit, 4-year or above)
- MAJORNUM: 1
- CIPCODE: See “definitions” below.
- AWLEVEL: 5 (bachelor’s degree)
Definitions:
- The sum of the per-state graduates is slightly smaller than the national total. this is due to two reasons: The national count of CS graduates includes the U.S. territories Guam, Puerto Rico, and Virgin Islands. For Utah, we manually remove data from an online university with thousands of graduates who come from across the country.
- Crosswalk of CIP codes to degrees found in the 2010 Classification of Instructional Program (CIP) values to WebCASPAR Academic Discipline, Detailed (standardized) values.
- “Computer Science” majors include the following CIP codes:
11.0101 Computer and Information Sciences, General |
11.0102 Artificial Intelligence |
11.0103 Information Technology |
11.0104 Informatics |
11.0199 Computer Science, Other |
11.0201 Computer Programming/Programmer, General |
11.0202 Computer Programming Special Applications |
11.0203 Computer Programming, Vendor/Product Certification |
11.0299 Computer Programming, Other |
11.0301 Data Processing and Data Processing Technology/Technician |
11.0401 Information Science/Studies |
11.0501 Computer Systems Analysis/Analyst |
11.0701 Computer Science |
11.0801 Web Page, Digital/Multimedia and Information Resources Design |
11.0802 Data Modeling/Warehousing and Database Administration |
11.0803 Computer Graphics |
11.0804 Modeling, Virtual Environments and Simulation |
11.0899 Computer Software and Media Applications, Other |
11.0901 Computer Systems Networking and Telecommunications |
11.1001 Network and System Administration/Administrator |
11.1002 System, Networking, and LAN/WAN Management/Manager |
11.1003 Computer and Information Systems Security/Information Assurance |
11.1004 Web/Multimedia Management and Webmaster |
11.1005 Information Technology Project Management |
11.1006 Computer Support Specialist |
11.1099 Computer/Information Technology Services Administration and Management, Other |
11.9999 Computer and Information Sciences and Support Services, Other |
Per-state new teachers graduating prepared to teach computer science
Source: National Teacher Preparation Data in the Title II Reports. This is data reported by states and institutions with teacher preparation programs. To download the spreadsheet of data for all states from https://title2.ed.gov/Public/Home.aspx, click on any state, then the “Data Files” tab, then download the “All States Report Data File.”
Methods: There are three ways of looking at the data: Teachers Prepared by Area of Certification, Teachers Prepared by Subject Area, and Teachers Prepared by Academic Major. The following table describes the difference between each count and shows the data for all three over the past three years. The state fact sheets report the Teachers Prepared by Subject.
2013-14 | 2014-15 | 2015-16 | 2016-17 | 2017-18 | 2018-19 | |
Prepared by Subject Program completers that were prepared to teach in the subject Teacher Education - Computer Science | 78 | 75 | 36 | 100 | 62 | 55 |
Prepared by Area (i.e., certification) Received an initial teaching certification in Computer Science | 51 | 17 | 30 | 47 | 85 | 44 |
Prepared by Major Graduated with a major in Teacher Education - Computer Science | 11 | 10 | 6 | 51 | 15 | 9 |
Number of Hours of Code
Code.org data - Hours of Code per state
Number of Hours of Code completed in a state comes from our Numbers of Hour of Code data.
The reported number of Code Studio accounts (by teacher and by student) includes all accounts that have been created and that have logged in at least once. IP addresses are used to determine the state.
At Code.org, we do not count unique student IDs perfectly when tracking participation in the Hour of Code. Why? Partly because we don’t want the friction of prompting to “login / register” before a student or classroom tries learning for the first time, and partly because there are many activities we cannot track online. We do take certain steps to reduce double-counting, but without a login prompt, this can’t work perfectly. At the same time, there are MANY student activities in the Hour of Code that aren’t tracked at all. For example: (1) students who use a mobile/tablet app to try the Hour of Code are typically not counted, (2) students who share a screen for pair-programming or group-programming may be counted as one, (3) students trying an unplugged classroom activity cannot be counted online, and (4) teachers who create their own Hour of Code activities aren’t tracked. As a result, there is some under-counting and some double-counting, and so we do not view the Hour of Code tracker to be an exact measure of usage. It is certainly directionally correct, and shows that many tens of millions of students have participated. And our “lines of code” counter tracks very real usage in our learning platforms.
Code.org data - Diversity of students on Code Studio
48% of our students are from marginalized racial and ethnic groups underrepresented in computer science. This includes Black/African American, Hispanic/Latino/Latina, Native Hawaiian/Pacific Islander, and Native American/Alaskan. 49% of students are on free and reduced meal programs (FARM). To protect the privacy of our youngest students, we measure the diversity for students under age 13 for the entire classroom by surveying teachers. This means these numbers are based on teachers’ estimates of the actual student ethnicities. For older students, the students self identify their race/ethnicity.
Similarly, for student privacy, we do not ask individual students if they are on free or reduced meals. Instead, we have an optional survey for teachers. This means these numbers are based on their knowledge of which students have subsidized meals. To protect privacy, our surveys are optional and do not represent all Code.org teachers.
Furthermore, this survey method doesn’t reflect the race/ethnicity of students under age 13 who are using Code Studio at home, without a classroom teacher. Our organizational focus is on bringing computer science into K-12 schools, and that is also what we are measuring.
Lastly, our ethnicity surveys do not measure international diversity because our focus is the U.S. and race/ethnicity questions would be different outside the U.S. Similarly, the free and reduced meal program is specific to the United States. We do not measure similar programs internationally.
Our “45% female” measure of gender diversity in CS Fundamentals courses on Code Studio is based on student accounts, and thus represents all active Code Studio students worldwide. This number is updated annually and reflects active student accounts for the previous year.
The previous version of this document (prior to early 2015) can be found here.